ArkTS: McPointChart
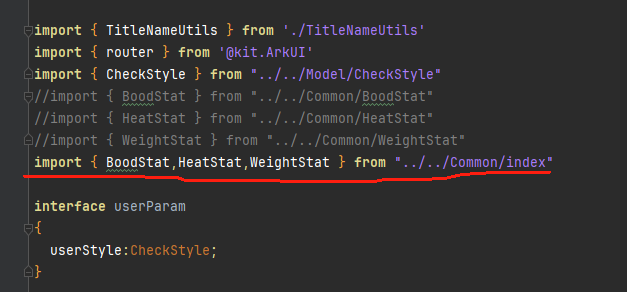
下载来,示例没有显示点效果。加点代码:
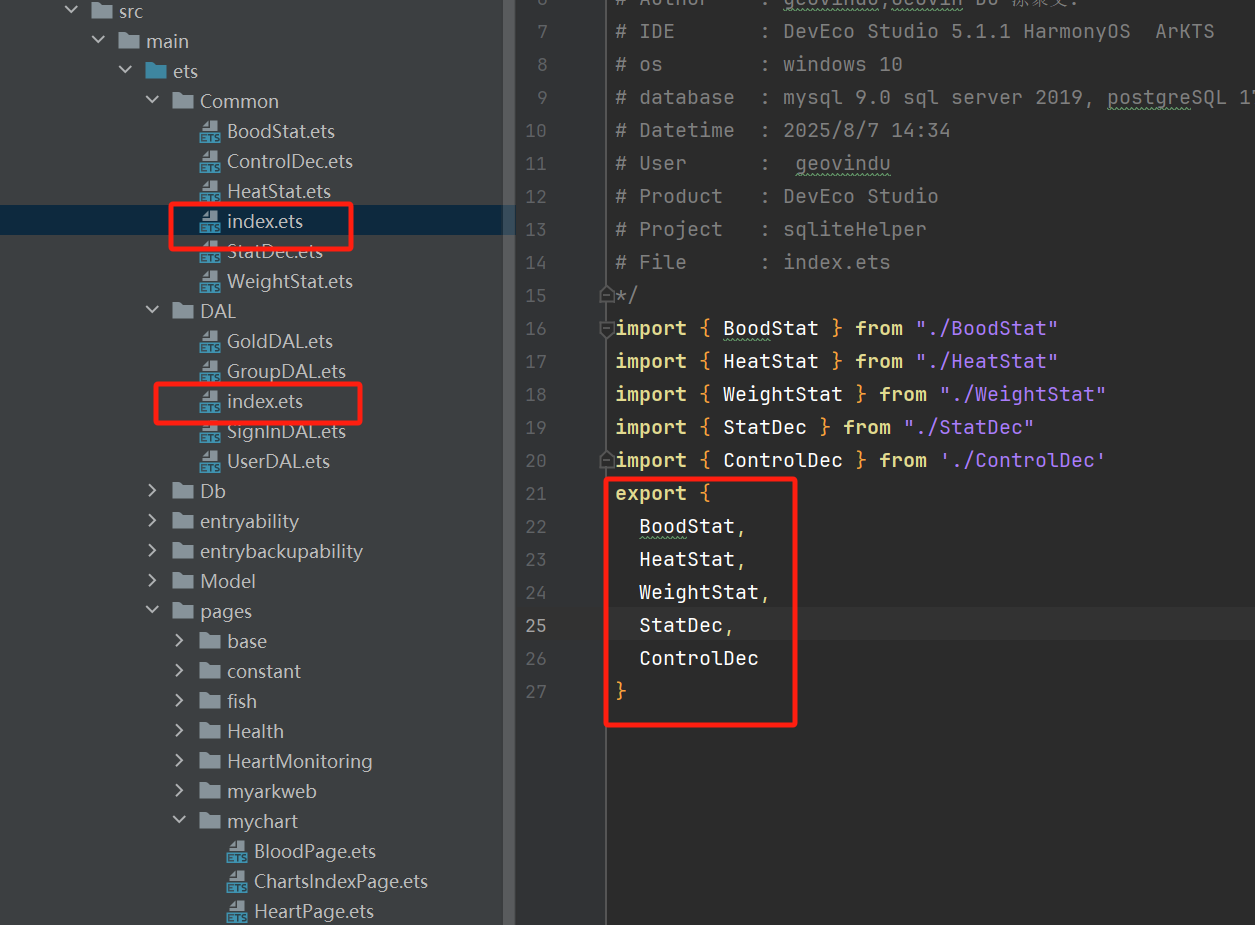
开源源码
项目结构:
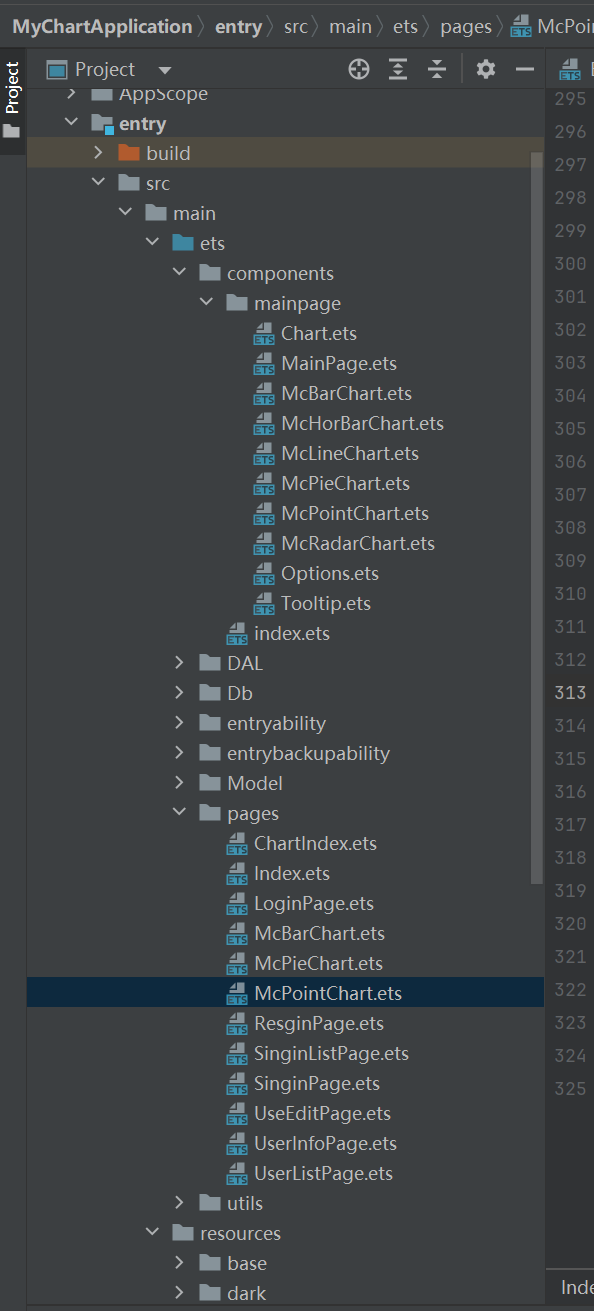
import {McBarChart, McPieChart, McPointChart, Options, chartInterface} from '../components/index'
@Entry
@Component
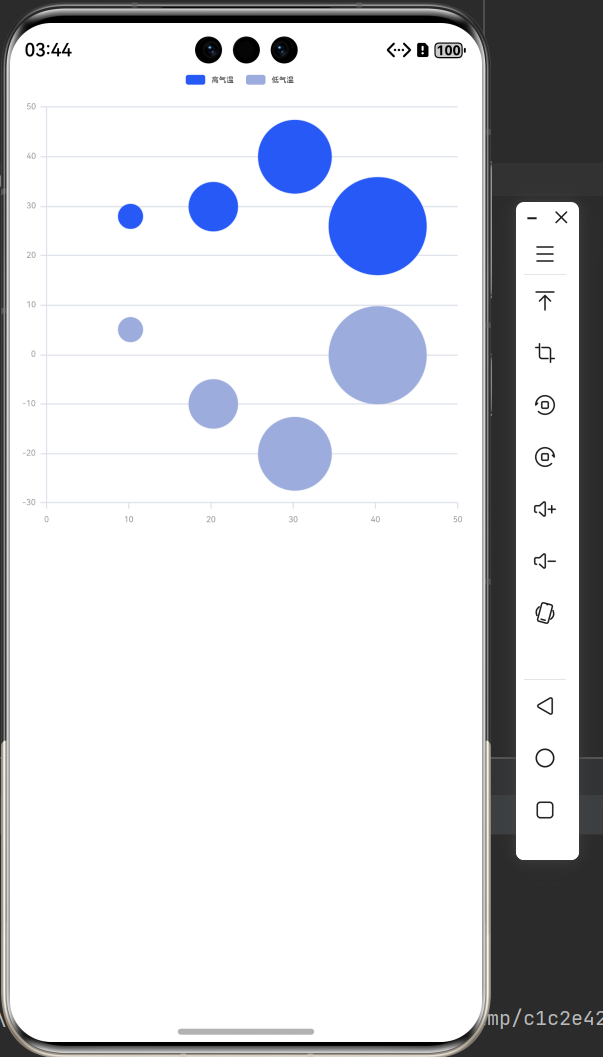
struct Index {@State defOption: Options = new Options({series:[{name:'高气温',data: [{xVal: 40, yVal: 26, num: 17096869, name: '广州'},{xVal: 20, yVal: 30, num: 17096869, name: '上海'},{xVal: 30, yVal: 40, num: 17096869, name: '北京'},{xVal: 10, yVal: 28, num: 17096869, name: '深圳'}]}]})@State xOption: Options = new Options({xAxis:{axisLine: { // 轴线样式show: true, // 是否显示lineStyle: {color: '#ccc',width: 2}},axisTick: { // 刻度线配置show: true, // 是否显示interval: 6, // 与文本的间隔length: 4, // 刻度的长度lineStyle: {color: '#ccc', // 刻度线颜色width: 2 // 刻度线宽度}},axisLabel: {color: '#bf19ff',fontWeight: '600',fontFamily: 'sans-serif',fontSize: 24,}},series:[{name:'高气温',data: [{xVal: 40, yVal: 26, num: 17096869, name: '广州'},{xVal: 20, yVal: 30, num: 17096869, name: '上海'},{xVal: 30, yVal: 40, num: 17096869, name: '北京'},{xVal: 10, yVal: 28, num: 17096869, name: '深圳'}]}]})@State yOption: Options = new Options({yAxis: {name: '单位/摄氏度', // 坐标名称nameTextStyle: {color: '#ccc',fontWeight: 'normal',fontFamily: 'sans-serif',fontSize: 18,},axisLine: { // 轴线样式show: true, // 是否显示lineStyle: {color: '#ccc',width: 2}},axisTick: { // 刻度线配置show: true, // 是否显示interval: 4, // 与文本的间隔length: 5, // 刻度的长度lineStyle: {color: '#ccc', // 刻度线颜色width: 2 // 刻度线宽度}},splitLine: { // 坐标轴中的分隔线。show: true,lineStyle: {color: '#4f000000',width: 2}},axisLabel: { // x轴文本标签样式color: '#bf19ff',fontWeight: '600',fontFamily: 'sans-serif',fontSize: 20,},formatter: (name: string): string => { // 自定义文本标签return name + '°C'},},series:[{name:'高气温',data: [{xVal: 40, yVal: 26, num: 17096869, name: '广州'},{xVal: 20, yVal: 30, num: 17096869, name: '上海'},{xVal: 30, yVal: 40, num: 17096869, name: '北京'},{xVal: 10, yVal: 28, num: 17096869, name: '深圳'}]}]})@State legendOption: Options = new Options({legend: {show: true,left: '90%',top: '2%',itemGap: 10, // 图例每项之间的间隔。横向布局时为水平间隔,纵向布局时为纵向间隔。itemTextGap: 10, // 图例图例之间的间隔。itemWidth: 8, // 图例标记的图形宽度。itemHeight: 8, // 图例标记的图形高度。textStyle: {color: '#000',fontWeight: 'normal',fontFamily: 'sans-serif',fontSize: 24}},series:[{name:'高气温',data: [{xVal: 40, yVal: 26, num: 17096869, name: '广州'},{xVal: 20, yVal: 30, num: 17096869, name: '上海'},{xVal: 30, yVal: 40, num: 17096869, name: '北京'},{xVal: 10, yVal: 28, num: 17096869, name: '深圳'}]}]})@State tooltipOption: Options = new Options({tooltip: {show: true,type: 'default', // 渲染类型。可选值:default(默认)、custom(自定义)axisPointer: {type: 'line',lineStyle: {color: '#000',width: 5,type: 'solid'}},backgroundColor: '#97cccccc',borderColor: '#333',borderWidth: 1,padding: 10,textStyle: {color: '#000',fontWeight: 'normal',fontFamily: 'sans-serif',fontSize: 18}},yAxis: { //设置y轴的相关样式与功能name: '温度', //Y轴名称nameTextStyle: { //Y轴名称样式配置color: '#06B683', //字体颜色fontSize: 30, //字体大小fontWeight: '600' //字体粗细},axisTick: { //刻度线配置length: 6, //刻度的长度lineStyle: { //刻度线样式color: '#06B683', //线颜色width: 1 //线宽度}},axisLine: { //y轴线配置show: true, //控制轴线显示与隐藏 可选值-true显示 false-隐藏lineStyle: { //轴线样式color: '#06B683', //线颜色width: 2, //线宽度type: 'solid' //线类型}},splitLine: { // Y轴分割线配置。show: false //隐藏},axisLabel: { //y轴文本标签样式配置color: '#999999', //字体颜色fontSize: 28, //字体大小fontWeight: '600' //字体粗细}},xAxis: {//设置x轴的相关样式与功能axisLabel: { //X轴文本标签样式配置color: '#999999', //字体颜色fontSize: 28, //字体大小fontWeight: '600' //字体粗线},axisTick: { //刻度线配置length: 6, // 刻度线的长度lineStyle: { //刻度线样式color: '#06B683', //线颜色width: 1 //线宽度}},axisLine: { //x轴线配置show: true, //控制轴线显示与隐藏 可选值-true显示 false-隐藏lineStyle: { //轴线样式color: '#06B683', //线颜色width: 2, //线宽度type: 'solid' //线类型}}},legend: { //设置图例的相关样式与功能top: '5%', //图例距离顶部侧位置itemWidth: 10, //图形的宽度itemHeight: 10, //图形的高度textStyle: { //文本样式配置color: '#FAAD14', //字体颜色fontSize: 30, //字体大小fontWeight: '800' //字体粗细}},series:[{name:'高气温',color: '#06B683', //系列颜色symbolSize: (data: chartInterface.InterfaceObj): string | number => {return data.xVal},data: [{xVal: 40, yVal: 26, num: 19.096869, name: '广州'}, // //xVal: x轴坐标值 yVal:y轴坐标值 num: 实际散点值 name:散点对应名称{xVal: 20, yVal: 30, num: 17.096869, name: '上海'},{xVal: 30, yVal: 40, num: 15.096869, name: '北京'},{xVal: 10, yVal: 28, num: 20.096869, name: '深圳'}]}]})@State seriesOption: Options = new Options({series:[{name:'高气温',color: '#ff2659f5',symbolSize: (data: chartInterface.InterfaceObj): string | number => {return data.xVal},data: [{xVal: 40, yVal: 26, num: 17096869, name: '广州'},{xVal: 20, yVal: 30, num: 17096869, name: '上海'},{xVal: 30, yVal: 40, num: 17096869, name: '北京'},{xVal: 10, yVal: 28, num: 17096869, name: '深圳'}]},{name:'低气温',color: '#ff9cacdd',symbolSize: (data: chartInterface.InterfaceObj): string | number => {return data.xVal},data: [{xVal: 40, yVal: 0, num: 17096869, name: '广州'},{xVal: 20, yVal: -10, num: 17096869, name: '上海'},{xVal: 30, yVal: -20, num: 17096869, name: '北京'},{xVal: 10, yVal: 5, num: 17096869, name: '深圳'}]}]})aboutToAppear() {setTimeout(() => {this.defOption.setVal({series:[{name:'低气温',data: [{xVal: 40, yVal: 0, num: 17096869, name: '广州'},{xVal: 20, yVal: -10, num: 17096869, name: '上海'},{xVal: 30, yVal: -20, num: 17096869, name: '北京'},{xVal: 10, yVal: 5, num: 17096869, name: '深圳'}]}]})}, 2000)}build() {Column() {// // 散点图 -- 默认// McPointChart({//options: this.defOption//})// // 散点图-xAxis属性// McPointChart({// options: this.xOption// })// // 散点图-yAxis属性// McPointChart({// options: this.yOption// })// // 散点图-legend属性// McPointChart({// options: this.legendOption// })// 散点图-tooltip属性//McPointChart({// options: this.tooltipOption//})// .backgroundColor('#f0f0f0') // 添加背景色以便查看容器边.backgroundColor('#f0f0f0') // 添加背景色以便查看容器边// // 散点图-series属性McPointChart({options: this.seriesOption})}.height('50%').width('100%').backgroundColor('#FFFFFF').borderRadius(10)}
}输出: