最终效果
代码实现
<!DOCTYPE html>
<html lang="zh-CN">
<head><meta charset="UTF-8"><meta name="viewport" content="width=device-width, initial-scale=1.0"><title>饼图数值固定显示效果</title><script src="https://cdn.jsdelivr.net/npm/echarts@5.4.3/dist/echarts.min.js"></script><style>body {padding: 20px;}#pieChart {width: 100%;height: 500px;}</style>
</head>
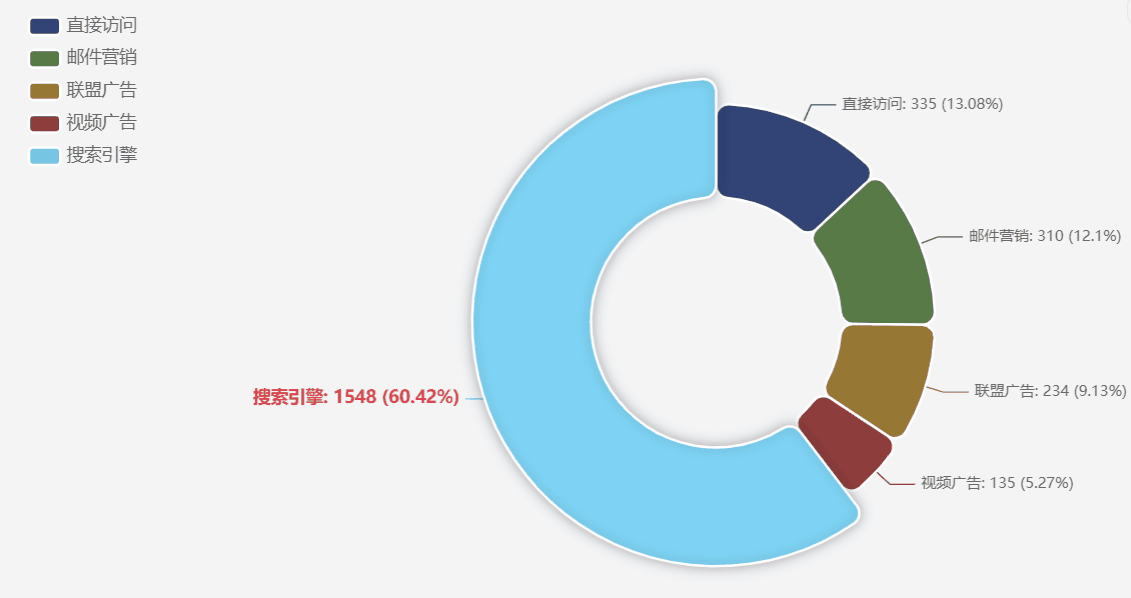
<body><div id="pieChart"></div><script>const chartDom = document.getElementById('pieChart');const myChart = echarts.init(chartDom);let option;const pieData = [{ value: 335, name: '直接访问' },{ value: 310, name: '邮件营销' },{ value: 234, name: '联盟广告' },{ value: 135, name: '视频广告' },{ value: 1548, name: '搜索引擎' }];const originalColors = [];let selectedIndex = -1;const legendNames = pieData.map(item => item.name);function darkenColor(color, percent) {let hex = color.replace('#', '');let r = parseInt(hex.substring(0, 2), 16);let g = parseInt(hex.substring(2, 4), 16);let b = parseInt(hex.substring(4, 6), 16);r = Math.floor(r * (1 - percent/100));g = Math.floor(g * (1 - percent/100));b = Math.floor(b * (1 - percent/100));r = Math.max(0, Math.min(255, r));g = Math.max(0, Math.min(255, g));b = Math.max(0, Math.min(255, b));return '#' + ((1 << 24) + (r << 16) + (g << 8) + b).toString(16).slice(1);}option = {tooltip: {trigger: 'item'},legend: {orient: 'vertical',left: 10,data: legendNames,textStyle: {color: '#666',fontSize: 14},emphasis: {textStyle: {color: '#e63946',fontWeight: 'bold'}}},series: [{name: '访问来源',type: 'pie',radius: ['40%', '70%'],center: ['60%', '50%'],itemStyle: {borderRadius: 10,borderColor: '#fff',borderWidth: 2},label: {show: true, position: 'outside', formatter: '{b}: {c} ({d}%)', color: '#666', fontSize: 12,lineStyle: {color: '#999',width: 1}},labelLine: {show: true, length: 15,length2: 20},emphasis: {scale: true,scaleSize: 20,itemStyle: {shadowBlur: 10,shadowColor: 'rgba(0, 0, 0, 0.3)'},label: {color: '#e63946', fontSize: 14,fontWeight: 'bold'}},data: pieData}],animationDuration: 300,animationEasing: 'elasticOut'};myChart.setOption(option);const colorList = myChart.getOption().color || echarts.graphic.getDefaultColor();pieData.forEach((item, index) => {originalColors[index] = colorList[index % colorList.length];});myChart.on('click', function(params) {if (params.componentType === 'series' && params.seriesType === 'pie') {selectedIndex = selectedIndex === params.dataIndex ? -1 : params.dataIndex;updateChartStyle();} else if (params.componentType === 'legend') {const index = legendNames.indexOf(params.name);selectedIndex = selectedIndex === index ? -1 : index;updateChartStyle();} else {selectedIndex = -1;updateChartStyle();}});function updateChartStyle() {option.series[0].data.forEach((item, index) => {if (index === selectedIndex) {item.itemStyle = {color: originalColors[index]};myChart.dispatchAction({ type: 'highlight', seriesIndex: 0, dataIndex: index });myChart.dispatchAction({ type: 'highlight', seriesIndex: 0, name: legendNames[index] });} else {item.itemStyle = {color: darkenColor(originalColors[index], 40)};myChart.dispatchAction({ type: 'downplay', seriesIndex: 0, dataIndex: index });myChart.dispatchAction({ type: 'downplay', seriesIndex: 0, name: legendNames[index] });}});myChart.setOption(option);}window.addEventListener('resize', () => {myChart.resize();});</script>
</body>
</html>