Prometheus 通过读取文件中的配置来监控目标
一、序言
这是一篇教你使用文件来监控目标的笔记,目标可以是系统也可以是数据库,笔记参考指南来自官方文档:https://prometheus.io/docs/guides/file-sd
二、安装prometheus
可以参考我写的笔记:https://blog.csdn.net/qq_50247813/article/details/149913921
三、修改配置
在prometheus.yml配置文件中的scrape_configs块配置中添加如下配置:
scrape_configs:- job_name: "node"# 配置文件抓取目标file_sd_configs:- files:# 配置抓取文件的名称,我的是当前目录下的targets.json文件- 'targets.json'
来配置targets.json文件:
[{"labels": {"job": "promethus"},"targets": ["localhost:9090"]},{"labels": {"job": "node"},"targets": ["localhost:9100"]}
]
启动Prometheus
./prometheus --config.file="prometheus.yml"
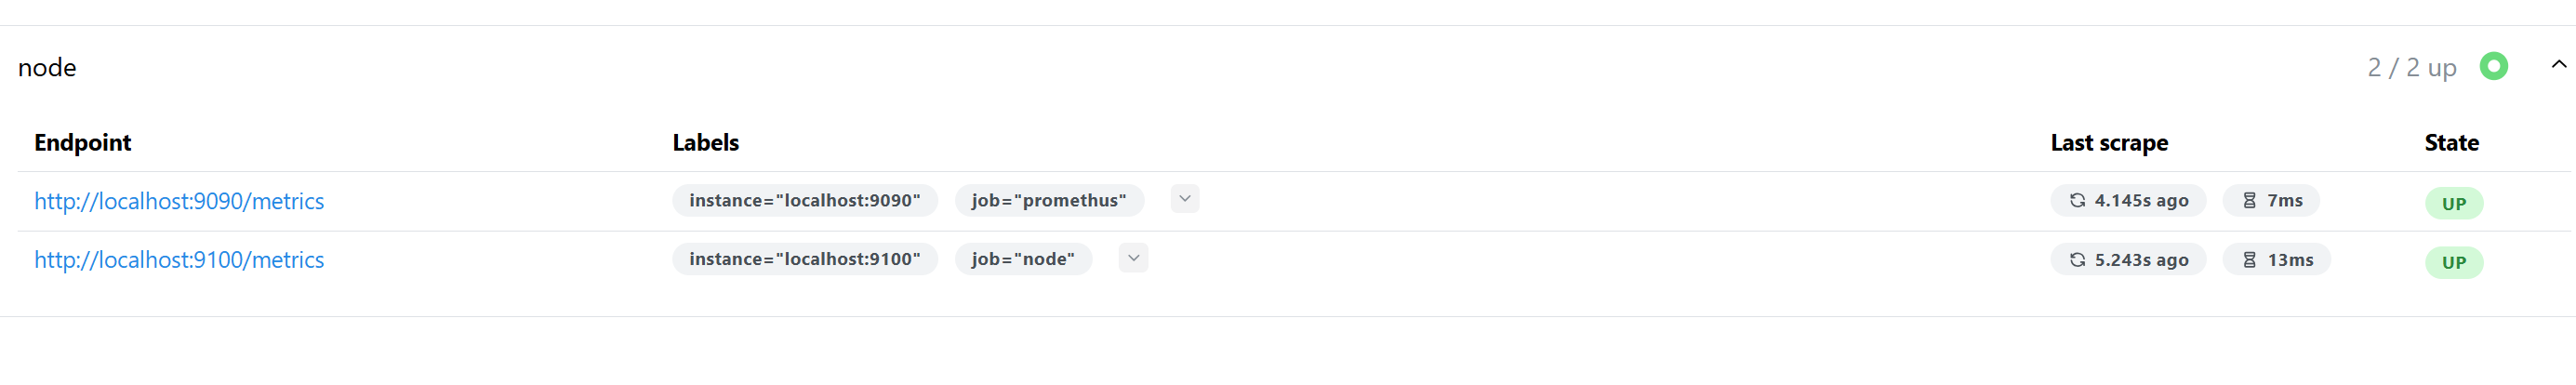
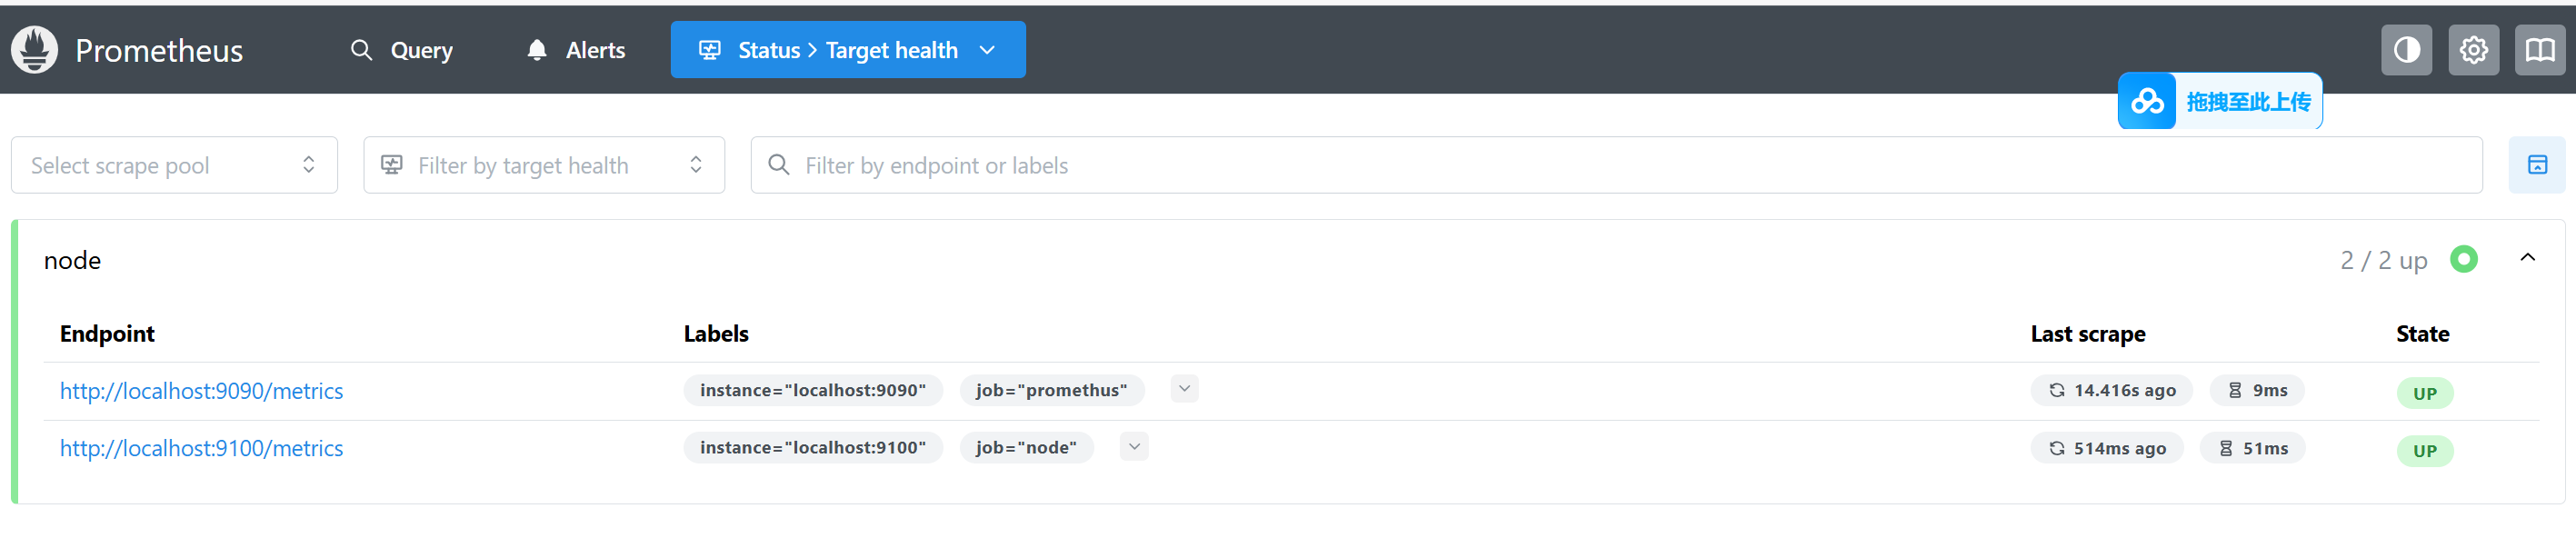
查看监控目标状态:
四、基于文件配置的监控目标,可以动态的添加和减少
实验如下:
-
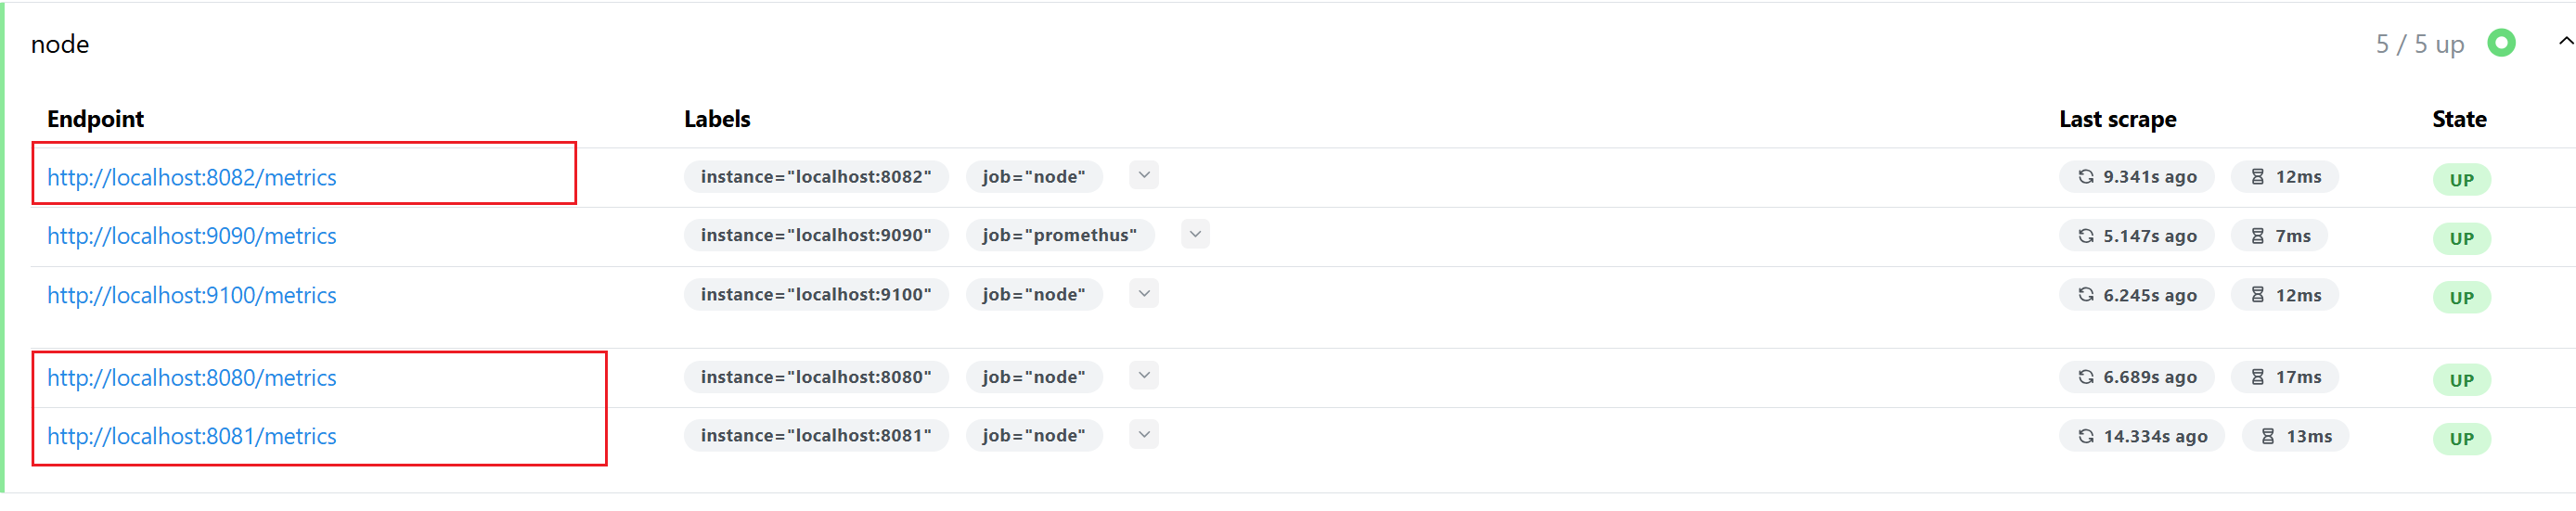
添加多个监控目标
./node_exporter --web.listen-address 0.0.0.0:8080 &./node_exporter --web.listen-address 0.0.0.0:8081 &./node_exporter --web.listen-address 0.0.0.0:8082 & -
添加到targets.json文件
{"labels": {"job": "node"},"targets": ["localhost:8080"]},{"labels": {"job": "node"},"targets": ["localhost:8081"]},{"labels": {"job": "node"},"targets": ["localhost:8082"]} -
查看目标监控状态
-
缩减监控项:
将添加的3个监控目标删除,查看效果:
我这边就直接展示效果了: