零基础学习性能测试第二章-linux/jvm/mysql等数据收集环境搭建
目录
- 零基础搭建性能监控数据收集环境:实战指南
- 一、监控体系架构全景图
- 二、一键部署脚本(全自动安装)
- 三、应用集成配置指南
- 1. JVM监控集成(Spring Boot示例)
- 2. MySQL监控配置
- 3. Linux系统监控
- 四、Grafana看板快速配置
- 1. 导入预置看板
- 2. 创建自定义看板
- 五、告警规则配置
- 1. Prometheus告警规则
- 2. 重启服务生效
- 六、性能测试数据收集实战
- 压测期间数据抓取流程
- 关键性能指标清单
- 七、避坑指南(血泪经验)
- 1. 权限问题解决方案
- 2. 指标采集失败处理
- 3. 资源占用优化
- 八、升级生产级监控
- 1. 高可用部署架构
- 2. 容器化部署方案
- 3. 云原生监控方案
- 九、验证清单
零基础搭建性能监控数据收集环境:实战指南
以下是为零基础设计的Linux/JVM/MySQL全栈监控数据收集方案,通过分步操作和脚本化部署,帮助您快速构建生产级监控系统:
一、监控体系架构全景图
二、一键部署脚本(全自动安装)
保存为 install_monitoring.sh 并执行:
#!/bin/bash  # 安装Prometheus
PROM_VERSION="2.45.0"
wget https://github.com/prometheus/prometheus/releases/download/v${PROM_VERSION}/prometheus-${PROM_VERSION}.linux-amd64.tar.gz
tar xvf prometheus-*.tar.gz
mv prometheus-* /opt/prometheus  # 配置Prometheus
cat <<EOF > /opt/prometheus/prometheus.yml
global:  scrape_interval: 15s  scrape_configs:  - job_name: 'node'  static_configs:  - targets: ['localhost:9100']  - job_name: 'jvm'  static_configs:  - targets: ['localhost:9404']  - job_name: 'mysql'  static_configs:  - targets: ['localhost:9104']
EOF  # 安装Node Exporter(系统监控)
NODE_EXPORTER_VERSION="1.6.1"
wget https://github.com/prometheus/node_exporter/releases/download/v${NODE_EXPORTER_VERSION}/node_exporter-${NODE_EXPORTER_VERSION}.linux-amd64.tar.gz
tar xvf node_exporter-*.tar.gz
mv node_exporter-* /opt/node_exporter  # 安装JMX Exporter(JVM监控)
JMX_EXPORTER_VERSION="0.20.0"
wget https://repo1.maven.org/maven2/io/prometheus/jmx/jmx_prometheus_javaagent/${JMX_EXPORTER_VERSION}/jmx_prometheus_javaagent-${JMX_EXPORTER_VERSION}.jar
cp jmx_prometheus_javaagent-*.jar /opt/jmx_exporter/
cat <<EOF > /opt/jmx_exporter/config.yml
rules:
- pattern: ".*"
EOF  # 安装MySQL Exporter
MYSQL_EXPORTER_VERSION="0.15.0"
wget https://github.com/prometheus/mysqld_exporter/releases/download/v${MYSQL_EXPORTER_VERSION}/mysqld_exporter-${MYSQL_EXPORTER_VERSION}.linux-amd64.tar.gz
tar xvf mysqld_exporter-*.tar.gz
mv mysqld_exporter-* /opt/mysqld_exporter  # 创建MySQL监控用户
mysql -e "CREATE USER 'exporter'@'localhost' IDENTIFIED BY 'StrongPass123!' WITH MAX_USER_CONNECTIONS 3;"
mysql -e "GRANT PROCESS, REPLICATION CLIENT, SELECT ON *.* TO 'exporter'@'localhost';"  # 配置MySQL Exporter
echo 'DATA_SOURCE_NAME="exporter:StrongPass123!@(localhost:3306)/"' > /opt/mysqld_exporter/.my.cnf  # 安装Grafana
wget https://dl.grafana.com/oss/release/grafana-10.1.1.linux-amd64.tar.gz
tar xvf grafana-*.tar.gz
mv grafana-* /opt/grafana  # 创建服务文件
cat <<EOF | sudo tee /etc/systemd/system/prometheus.service
[Unit]
Description=Prometheus  [Service]
ExecStart=/opt/prometheus/prometheus --config.file=/opt/prometheus/prometheus.yml
Restart=always  [Install]
WantedBy=multi-user.target
EOF  cat <<EOF | sudo tee /etc/systemd/system/node_exporter.service
[Unit]
Description=Node Exporter  [Service]
ExecStart=/opt/node_exporter/node_exporter
Restart=always  [Install]
WantedBy=multi-user.target
EOF  cat <<EOF | sudo tee /etc/systemd/system/mysqld_exporter.service
[Unit]
Description=MySQL Exporter  [Service]
EnvironmentFile=/opt/mysqld_exporter/.my.cnf
ExecStart=/opt/mysqld_exporter/mysqld_exporter
Restart=always  [Install]
WantedBy=multi-user.target
EOF  # 启动所有服务
systemctl daemon-reload
systemctl enable --now prometheus node_exporter mysqld_exporter grafana-server  echo "======= 安装完成 ======="
echo "Prometheus: http://$(hostname -I | awk '{print $1}'):9090"
echo "Grafana:    http://$(hostname -I | awk '{print $1}'):3000 (admin/admin)"
三、应用集成配置指南
1. JVM监控集成(Spring Boot示例)
在应用启动命令中添加JMX agent:
java -javaagent:/opt/jmx_exporter/jmx_prometheus_javaagent-0.20.0.jar=9404:/opt/jmx_exporter/config.yml \ -jar your-application.jar
关键指标验证:
curl http://localhost:9404/metrics | grep jvm_memory_used_bytes
2. MySQL监控配置
确保MySQL启用性能统计:
-- 检查性能模式
SHOW VARIABLES LIKE 'performance_schema';
SET GLOBAL performance_schema=ON;  -- 关键性能视图
SELECT * FROM performance_schema.events_statements_summary_by_digest;
3. Linux系统监控
Node Exporter 默认监控项:
- CPU使用率:
node_cpu_seconds_total - 内存使用:
node_memory_MemAvailable_bytes - 磁盘IO:
node_disk_io_time_seconds_total - 网络流量:
node_network_receive_bytes_total
四、Grafana看板快速配置
1. 导入预置看板
| 监控类型 | 看板ID | 安装命令 |
|---|---|---|
| 主机资源 | 1860 | grafana-cli dashboards import 1860 |
| JVM监控 | 8563 | grafana-cli dashboards import 8563 |
| MySQL监控 | 7362 | grafana-cli dashboards import 7362 |
2. 创建自定义看板
Linux资源概览看板配置:
{  "panels": [  {  "type": "stat",  "title": "CPU使用率",  "targets": [{  "expr": "100 - (avg by(instance)(rate(node_cpu_seconds_total{mode=\"idle\"}[5m])) * 100",  "format": "percent"  }]  },  {  "type": "gauge",  "title": "内存使用",  "targets": [{  "expr": "(node_memory_MemTotal_bytes - node_memory_MemAvailable_bytes) / node_memory_MemTotal_bytes * 100"  }]  }  ]
}
JVM监控看板关键面板:
{  "title": "GC暂停时间",  "type": "timeseries",  "targets": [{  "expr": "sum(jvm_gc_pause_seconds_sum{job=\"jvm\"}) by (gc)"  }]
}
MySQL性能看板:
{  "title": "慢查询统计",  "type": "table",  "targets": [{  "expr": "topk(10, mysql_global_status_slow_queries)"  }]
}
五、告警规则配置
1. Prometheus告警规则
创建 /opt/prometheus/alerts.yml:
groups:
- name: server-alerts  rules:  - alert: HighCpuUsage  expr: 100 - (avg by(instance)(rate(node_cpu_seconds_total{mode="idle"}[5m])) * 100 > 85  for: 5m  labels:  severity: critical  annotations:  summary: "高CPU使用率 ({{ $labels.instance }})"  description: "CPU使用率超过85% 当前值: {{ $value }}%"  - alert: JvmFullGcFrequent  expr: increase(jvm_gc_pause_seconds_count{gc="PS MarkSweep"}[1h]) > 5  labels:  severity: warning  annotations:  summary: "JVM频繁Full GC"  - alert: MysqlSlowQueries  expr: rate(mysql_global_status_slow_queries[5m]) > 10  labels:  severity: warning  annotations:  summary: "MySQL慢查询激增"
在 prometheus.yml 中添加:
rule_files: - "alerts.yml"
2. 重启服务生效
systemctl restart prometheus
六、性能测试数据收集实战
压测期间数据抓取流程
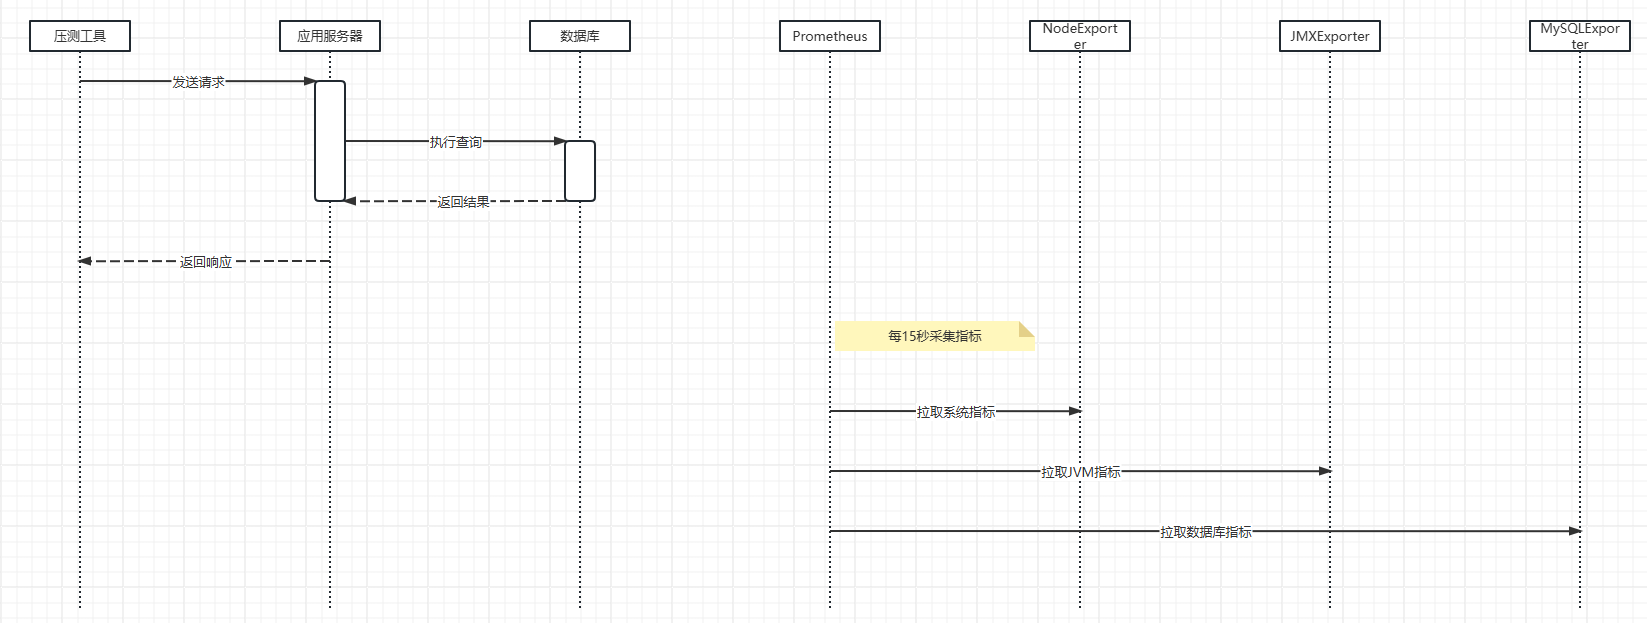
关键性能指标清单
| 监控对象 | 关键指标 | PromQL查询 |
|---|---|---|
| Linux | CPU使用率 | 100 - (avg by(instance)(rate(node_cpu_seconds_total{mode="idle"}[5m])) * 100 |
| 内存可用率 | node_memory_MemAvailable_bytes / node_memory_MemTotal_bytes * 100 | |
| JVM | 堆内存使用 | jvm_memory_used_bytes{area="heap"} |
| GC暂停时间 | jvm_gc_pause_seconds_sum | |
| 线程数 | jvm_threads_current | |
| MySQL | 连接数 | mysql_global_status_threads_connected |
| 查询吞吐量 | rate(mysql_global_status_questions[5m]) | |
| 缓冲池命中率 | 1 - (mysql_global_status_innodb_buffer_pool_reads / mysql_global_status_innodb_buffer_pool_read_requests) |
七、避坑指南(血泪经验)
1. 权限问题解决方案
MySQL访问被拒绝:
GRANT PROCESS, REPLICATION CLIENT, SELECT ON *.* TO 'exporter'@'localhost';
FLUSH PRIVILEGES;
文件权限问题:
sudo chown -R prometheus:prometheus /opt/prometheus
2. 指标采集失败处理
检查Exporter状态:
curl http://localhost:9100/metrics  # Node Exporter
curl http://localhost:9404/metrics  # JMX Exporter
curl http://localhost:9104/metrics  # MySQL Exporter
Prometheus调试:
systemctl status prometheus
journalctl -u prometheus -f  # 查看实时日志
3. 资源占用优化
降低采集频率:
# prometheus.yml
global:  scrape_interval: 30s  # 从15s调整为30s
过滤无用指标:
scrape_configs: - job_name: 'node' metric_relabel_configs: - source_labels: [__name__] regex: '(node_netstat_.*|node_time_.*)' action: drop
八、升级生产级监控
1. 高可用部署架构
2. 容器化部署方案
# Docker Compose示例
version: '3'
services:  prometheus:  image: prom/prometheus  volumes:  - ./prometheus.yml:/etc/prometheus/prometheus.yml  node-exporter:  image: prom/node-exporter  grafana:  image: grafana/grafana  ports:  - "3000:3000"
3. 云原生监控方案
# Kubernetes部署
helm install prometheus prometheus-community/kube-prometheus-stack \  --set prometheus.service.type=NodePort \  --set grafana.service.type=NodePort
九、验证清单
- Node Exporter指标可见:
http://IP:9100/metrics - JMX Exporter指标可见:
http://IP:9404/metrics - MySQL Exporter指标可见:
http://IP:9104/metrics - Prometheus成功抓取目标:
http://IP:9090/targets - Grafana看板数据正常显示
- 测试告警触发机制(如强制CPU满载)
- 压测期间指标变化符合预期
部署完成标志:在Grafana中可同时查看Linux系统负载、JVM内存使用和MySQL查询吞吐量的实时数据,并在CPU超过85%时收到告警通知。
通过本方案,您可以在30分钟内完成全栈监控环境的搭建,并立即应用于性能测试工作。实际执行时建议先在小规模测试环境验证,再推广到生产环境。