数据统计:词频统计、词表生成、排序及计数、词云图生成
文章目录
- 📚输入及输出
- 📚代码实现
📚输入及输出
-
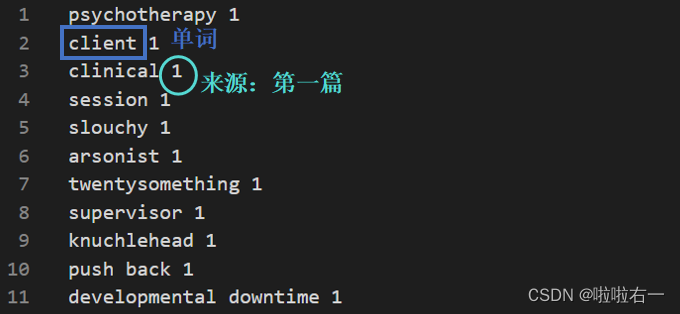
输入:读取一个
input.txt,其中包含单词及其对应的TED打卡号。
-
输出
-
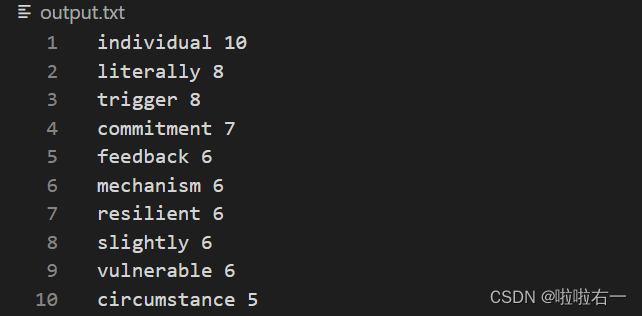
output.txt:包含按频率降序排列的每个单词及其计数(这里直接用于后续的词云图生成)。
-
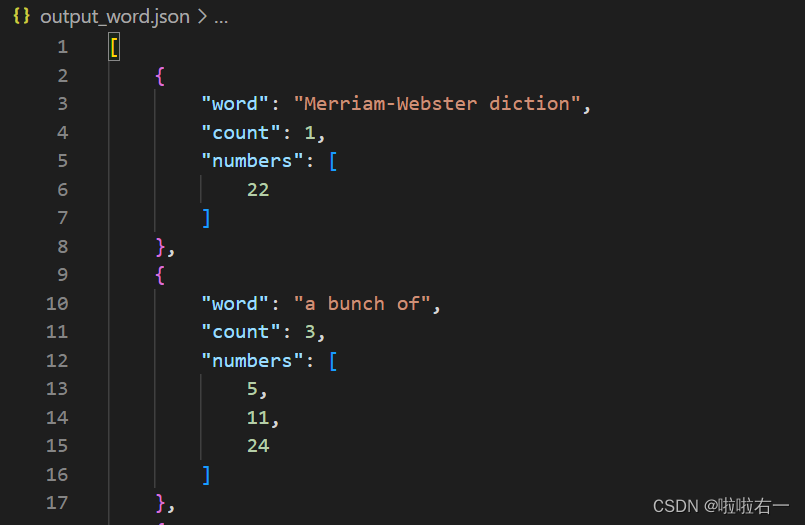
output_word.json:包含每个单词及其计数,以及与之关联的TED打卡号列表,生成一个json文件(按字母序排列,用于后续网页数据导入)。
-
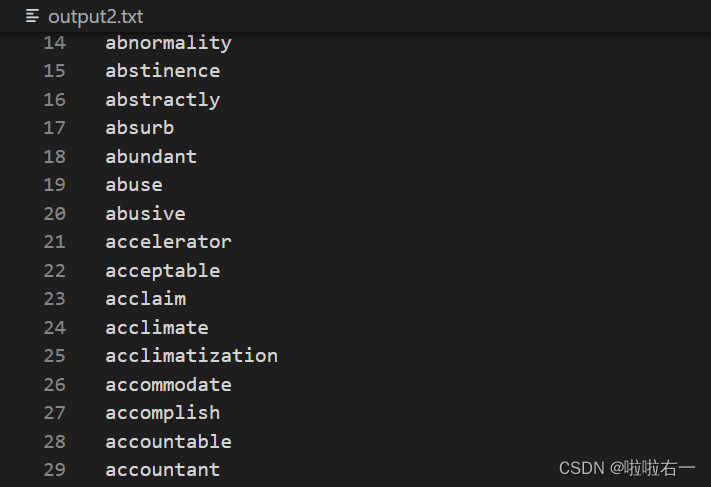
output2.txt:按字母顺序排序的所有单词,即导出一个单词词表(可以导入到不背单词里生成自定义词表)。
-
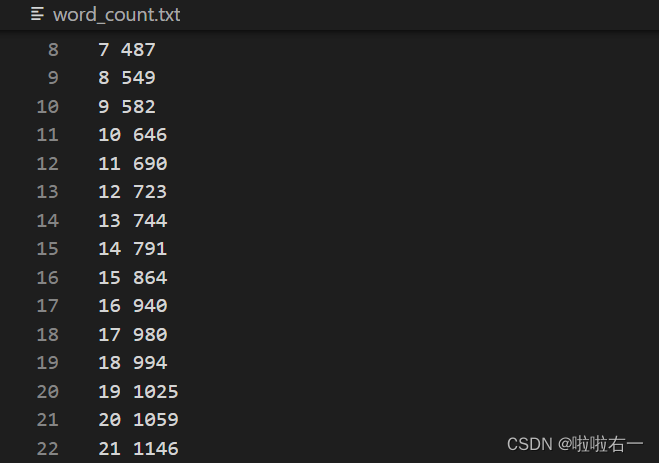
word_count.txt:记录截至每篇TED打卡号时涉及到的单词总数(该数据用于绘制后续的折线图)。
-
-
生成词云:在处理数据后,脚本读取
output.txt并生成基于单词频率的词云,并将词云保存至指定目录。

📚代码实现
-
逻辑梳理
- 在函数中使用了两个defaultdict,一个用于统计单词出现的频率,另一个用于记录单词对应的打卡号集合。
- 打开输入文件,并逐行读取单词及其对应的打卡号,对于每个单词,统计其出现的频率,并将打卡号添加到对应的集合中。同时,对每篇TED的打卡号进行统计,记录每篇 TED 结束时涉及到的当前单词总数量,写入
output_word_count_txt,对应word_count.txt。 - 统计完所有单词后,对单词频率进行排序,并将排序后的结果写入
output_txt_file,对应input.txt。 - 将单词、频率和相应的(排序过后的)打卡号列表存储为 JSON 文件,对应
output_word.json。 - 将所有单词按字母顺序写入
output_txt_file_sorted中,对应output2.txt。
-
具体详见注释↓
import json
from collections import defaultdict
from wordcloud import WordCloud
import matplotlib.pyplot as plt
import redef count_word_frequency(input_file, output_txt_file, output_word_json_file, output_txt_file_sorted, output_word_count_txt):# 使用defaultdict初始化两个字典,用于统计单词出现频率、单词对应打卡号集合word_count = defaultdict(int)# 设置为set集合自动去重,单词对应的打卡号集合word_numbers = defaultdict(set)  current_number = 0  # 当前打卡号初始化为0# 创建一个空的单词计数分析文本文件open(output_word_count_txt, 'w').close()# 打开输入文件并逐行读取单词及其对应的数字with open(input_file, 'r') as file:for line in file:line_parts = line.strip().split()word = " ".join(line_parts[:-1])  # 提取单词number = int(line_parts[-1])  # 提取打卡号# 如果当前打卡号与前一个不同(即已经开始下一篇了),记录前一个打卡号(即刚刚完成的那一篇)对应的(截至该篇的)单词总数到output_word_count_txt中if number != current_number:current_number = number# 用sum函数来统计word_numbers中非空集合的数量,即当前TED打卡号下已经出现过的单词数current_unique_count = sum(1 for word_set in word_numbers.values() if len(word_set) > 0)with open(output_word_count_txt, 'a') as count_file:count_file.write(f"{current_number-1} {current_unique_count}\n")# 统计单词的频率及相应的打卡号(这里排除了同一个单词在一片篇TED里多次记录的重复计数情况)if number not in word_numbers[word]:  word_count[word] += 1word_numbers[word].add(number)  # 对每个单词的打卡号进行排序,使得最后TED打卡号列表按序显示for word in word_numbers:word_numbers[word] = sorted(word_numbers[word])# 补充记录最后一个打卡号对应的(截至该篇的)单词总数到output_word_count_txt中current_unique_count = sum(1 for word_set in word_numbers.values() if len(word_set) > 0)with open(output_word_count_txt, 'a') as count_file:count_file.write(f"{current_number} {current_unique_count}\n")# 对单词频率进行排序,并将排序后的结果写入输出文本文件中sorted_words = sorted(word_count.items(), key=lambda x: (-x[1], x[0]))with open(output_txt_file, 'w') as file_txt:for word, count in sorted_words:file_txt.write(word + " " + str(count) + "\n")# 将单词、频率和相应的打卡号列表存储为JSON文件word_data = []for word, count in word_count.items():word_entry = {"word": word,"count": count,"numbers": list(word_numbers[word])  }word_data.append(word_entry)word_data_sorted = sorted(word_data, key=lambda x: x["word"])with open(output_word_json_file, 'w') as file_word_json:json.dump(word_data_sorted, file_word_json, indent=4)# 将所有单词按字母顺序写入输出文本文件中all_words = list(word_count.keys())all_words.sort()with open(output_txt_file_sorted, 'w') as file_txt_sorted:file_txt_sorted.write('\n'.join(all_words) + '\n')# 定义输入文件和输出文件的名称
input_file = "input.txt"
output_txt_file = "output.txt"
output_word_json_file = "output_word.json"
output_txt_file_sorted = "output2.txt"
output_word_count_txt = "word_count.txt"# 调用函数统计单词频率并生成相关输出
count_word_frequency(input_file, output_txt_file, output_word_json_file, output_txt_file_sorted, output_word_count_txt)# 读取输出文本文件的单词频率数据
words = []
with open('output.txt', 'r', encoding='utf-8') as file:for line in file:# 使用正则表达式匹配每行的单词和对应的频率match = re.match(r'(.+?)\s+(\d+)', line)if match:  # 如果匹配成功word = match.group(1)  # 提取匹配到的单词部分freq = int(match.group(2))  # 提取匹配到的数字部分作为频率words.append((word, freq))  # 将单词和对应的频率以元组的形式添加到列表中# 生成词云图像并保存为文件
wordcloud = WordCloud(width=800, height=400, background_color='white').generate_from_frequencies(dict(words))
plt.figure(figsize=(10, 6))
plt.imshow(wordcloud, interpolation='bilinear')
plt.axis('off')
wordcloud.to_file('./images/wordcloud.png')
plt.show()