构建Docker容器监控系统(Cadvisor +Prometheus+Grafana)
Cadvisor +Prometheus+Grafana
1.1、Cadvisor产品简介
Cadvisor是Google开源的一款用于展示和分析容器运行状态的可视化工具。通过在主机上运行Cadvisor用户可以轻松的获取到当前主机上容器的运行统计信息,并以图表的形式向用户展示。
1.2、安装docker-ce
[root@localhost ~]# iptables -F
[root@localhost ~]# setenforce 0
setenforce: SELinux is disabled
[root@localhost ~]# systemctl stop firewalld[root@localhost ~]# cd /etc/yum.repos.d/
[root@localhost ~]# wget http://mirrors.aliyun.com/repo/Centos-7.repo[root@localhost ~]# yum -y install yum-utils device-mapper-persistent-data lvm2
[root@localhost ~]# yum-config-manager --add-repo http://mirrors.aliyun.com/docker-ce/linux/centos/docker-ce.repo
[root@localhost ~]# yum -y install docker-ce
[root@localhost ~]# systemctl start docker
[root@localhost ~]# systemctl enable docker
[root@localhost ~]# docker versionClient: Docker Engine - CommunityVersion:           24.0.5API version:       1.43Go version:        go1.20.6Git commit:        ced0996Built:             Fri Jul 21 20:39:02 2023OS/Arch:           linux/amd64Context:           defaultServer: Docker Engine - CommunityEngine:Version:          24.0.5API version:      1.43 (minimum version 1.12)Go version:       go1.20.6Git commit:       a61e2b4Built:            Fri Jul 21 20:38:05 2023OS/Arch:          linux/amd64Experimental:     falsecontainerd:Version:          1.6.21GitCommit:        3dce8eb055cbb6872793272b4f20ed16117344f8runc:Version:          1.1.7GitCommit:        v1.1.7-0-g860f061docker-init:Version:          0.19.0GitCommit:        de40ad0
阿里云镜像加速器
阿里云登录 - 欢迎登录阿里云,安全稳定的云计算服务平台欢迎登录阿里云,全球领先的云计算及人工智能科技公司,阿里云为200多个国家和地区的企业、开发者和政府机构提供云计算基础服务及解决方案。阿里云云计算、安全、大数据、人工智能、企业应用、物联网等云计算服务。
[root@localhost ~]# cat << END > /etc/docker/daemon.json
{"registry-mirrors":[ "https://nyakyfun.mirror.aliyuncs.com" ]
}
END[root@localhost ~]# systemctl daemon-reload[root@localhost ~]# systemctl restart docker
下载组件镜像
[root@localhost ~]# docker pull tutum/influxdbUsing default tag: latest
latest: Pulling from tutum/influxdb
a3ed95caeb02: Pull complete
23efb549476f: Pull complete
aa2f8df21433: Pull complete
ef072d3c9b41: Pull complete
c9f371853f28: Pull complete
a248b0871c3c: Pull complete
749db6d368d0: Pull complete
db2492acfcc3: Pull complete
b7e7d2e12d53: Pull complete
4272a53eef10: Pull complete
9b2fefdb5321: Pull complete
Digest: sha256:5b7c5e318303ad059f3d1a73d084c12cb39ae4f35f7391b79b0ff2c0ba45304b
Status: Downloaded newer image for tutum/influxdb:latest
docker.io/tutum/influxdb:latest[root@localhost ~]# docker pull google/cadvisorUsing default tag: latest
latest: Pulling from google/cadvisor
ff3a5c916c92: Pull complete
44a45bb65cdf: Pull complete
0bbe1a2fe2a6: Pull complete
Digest: sha256:815386ebbe9a3490f38785ab11bda34ec8dacf4634af77b8912832d4f85dca04
Status: Downloaded newer image for google/cadvisor:latest
docker.io/google/cadvisor:latest[root@localhost ~]# docker pull grafana/grafanaUsing default tag: latest
latest: Pulling from grafana/grafana
97518928ae5f: Pull complete
5b58818b7f48: Pull complete
d9a64d9fd162: Pull complete
4e368e1b924c: Pull complete
867f7fdd92d9: Pull complete
387c55415012: Pull complete
07f94c8f51cd: Pull complete
ce8cf00ff6aa: Pull complete
e44858b5f948: Pull complete
4000fdbdd2a3: Pull complete
Digest: sha256:18d94ae734accd66bccf22daed7bdb20c6b99aa0f2c687eea3ce4275fe275062
Status: Downloaded newer image for grafana/grafana:latest
docker.io/grafana/grafana:latest[root@localhost ~]# docker imagesREPOSITORY        TAG       IMAGE ID       CREATED         SIZE
grafana/grafana   latest    9b957e098315   20 months ago   275MB
google/cadvisor   latest    eb1210707573   4 years ago     69.6MB
tutum/influxdb    latest    c061e5808198   6 years ago     290MB
创建自定义网络
[root@localhost ~]# docker network create monitorbfe09a56d338b3173da008204dac13e46873ab8c46601683bba6457178e7dbcc[root@localhost ~]# docker network lsNETWORK ID     NAME      DRIVER    SCOPE
dbe5fb2353e8   bridge    bridge    local
fc4521838733   host      host      local
bfe09a56d338   monitor   bridge    local
4e2c57eec484   none      null      local
1.3、部署Cadvisor
被监控主机上部署Cadvisor容器
[root@localhost ~]# docker run -d \
> --volume=/:/rootfs:ro \
> --volume=/var/run:/var/run:ro \
> --volume=/sys:/sys:ro \
> --volume=/var/lib/docker/:/var/lib/docker:ro \
> --volume=/dev/disk/:/dev/disk:ro \
> --publish=8080:8080 \
> --detach=true \
> --name=cadvisor \
> google/cadvisor:latest39067a18d264733e884272d932cd1d2bf1ae279092729aca01cfc0f12fa2571d
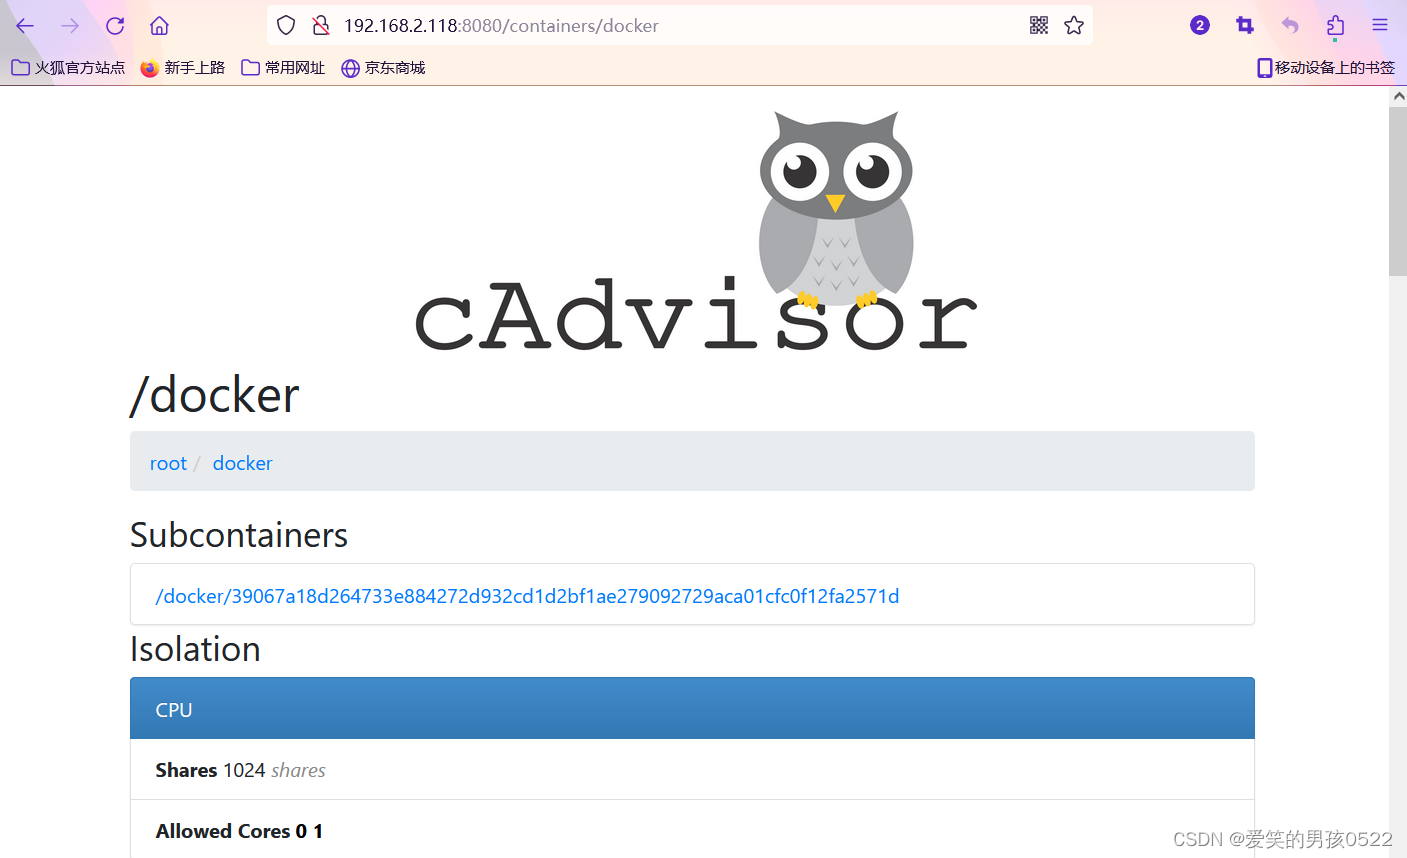
1.4、访问cAdvisor页面
访问http://192.168.2.118:8080 cAdvisor页面可以看到收集到的数据
1.5、Prometheus产品简介
Prometheus是一个最初在SoundCloud上构建的开源系统监视和警报工具包。自2012年成立以来,很多公司和组织都采用了Prometheus,该项目拥有非常活跃的开发者和用户社区。 它现在是一个独立的开源项目,可以独立于任何公司进行维护。 为了强调这一点,并阐明项目的治理结构,Prometheus于2016年加入Cloud Native Computing Foundation(云原生基金会),作为继Kubernetes之后的第二个托管项目。
Prometheus的主要特征有:
- 多维度数据模型-由指标键值对标识的时间序列数据组成
- PromQL,一种灵活的查询语言
- 不依赖分布式存储; 单个服务器节点是自治的
- 以HTTP方式,通过pull模型拉取时间序列数据
- 支持通过中间网关推送时间序列数据
- 通过服务发现或者静态配置,来发现目标服务对象
- 支持多种多样的图表和界面展示
1.6、部署Prometheus
[root@localhost ~]# docker pull prom/prometheusUsing default tag: latest
latest: Pulling from prom/prometheus
3cb635b06aa2: Pull complete
34f699df6fe0: Pull complete
33d6c9635e0f: Pull complete
f2af7323bed8: Pull complete
c16675a6a294: Pull complete
827843f6afe6: Pull complete
3d272942eeaf: Pull complete
7e785cfa34da: Pull complete
05e324559e3b: Pull complete
170620261a59: Pull complete
ec35f5996032: Pull complete
5509173eb708: Pull complete
Digest: sha256:cb9817249c346d6cfadebe383ed3b3cd4c540f623db40c4ca00da2ada45259bb
Status: Downloaded newer image for prom/prometheus:latest
docker.io/prom/prometheus:latest
先准备配置
[root@localhost ~]# vim /tmp/prometheus.yml
# my global config
global:scrape_interval:     15s # Set the scrape interval to every 15 seconds. Default is every 1 minute.evaluation_interval: 15s # Evaluate rules every 15 seconds. The default is every 1 minute.# scrape_timeout is set to the global default (10s).# Alertmanager configuration
alerting:alertmanagers:- static_configs:- targets:# - alertmanager:9093# Load rules once and periodically evaluate them according to the global 'evaluation_interval'.
rule_files:# - "first_rules.yml"# - "second_rules.yml"# A scrape configuration containing exactly one endpoint to scrape:
# Here it's Prometheus itself.
scrape_configs:# The job name is added as a label `job=<job_name>` to any timeseries scraped from this config.- job_name: 'prometheus'# metrics_path defaults to '/metrics'# scheme defaults to 'http'.static_configs:- targets: ['localhost:9090']- job_name: 'docker'      ##定义一个叫docker的组static_configs:
- targets: ['192.168.2.118:8080']   ##填写一个或多个cadvisor的主机地址用逗号隔开
运行容器
[root@localhost ~]# docker run -d \
--name=prometheus  -p 9090:9090  \
-v /tmp/prometheus.yml:/etc/prometheus/prometheus.yml \-v /etc/localtime:/etc/localtime \
prom/prometheus402b019bb5fd489911f925ae717e87994e68ec7b836f37bc106de8f3c2801cbc#如果起不来就重启一下docker,再用docker restart $(docker ps -qa) 重启所有容器1.7、访问prometheus页面
http://192.168.2.118:9090

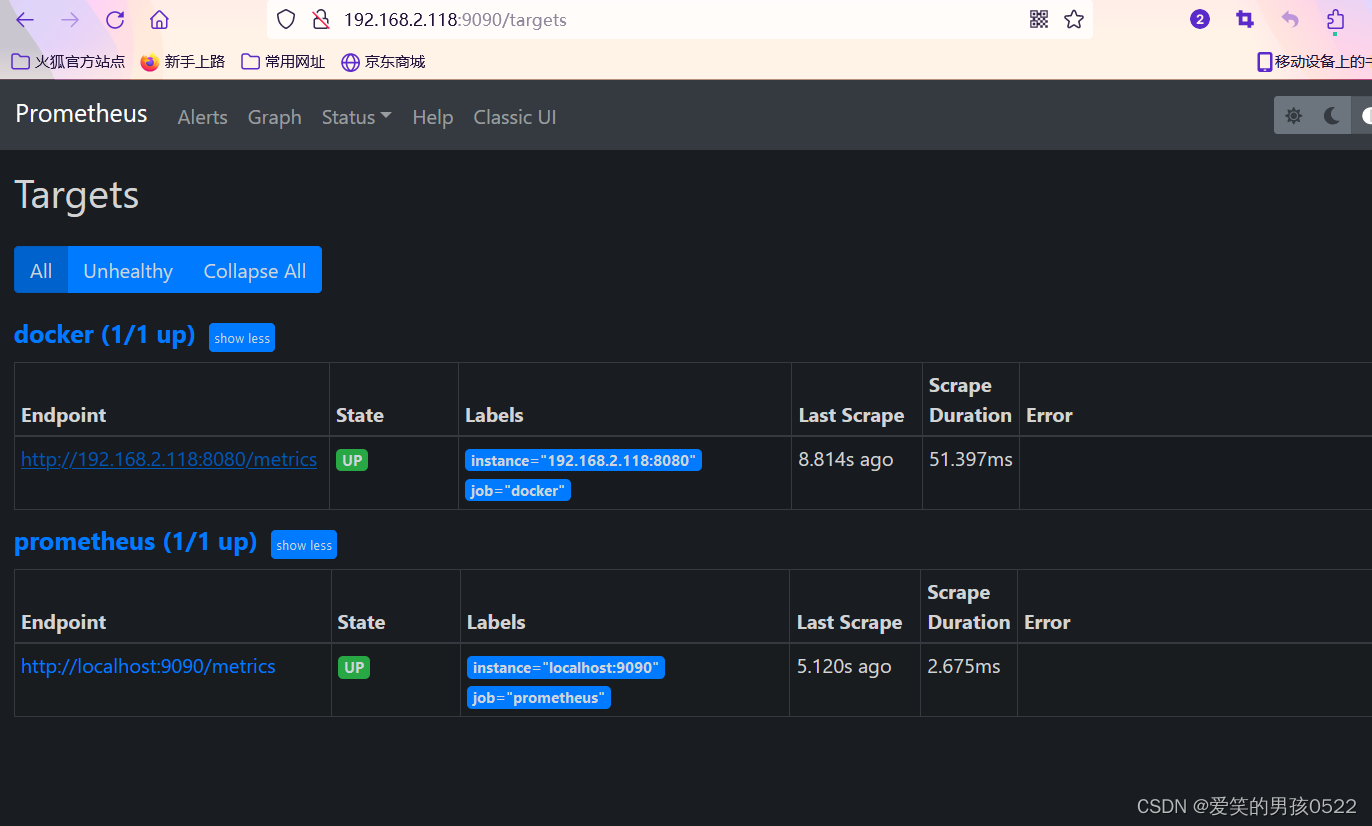
看到docker组状态up为正常
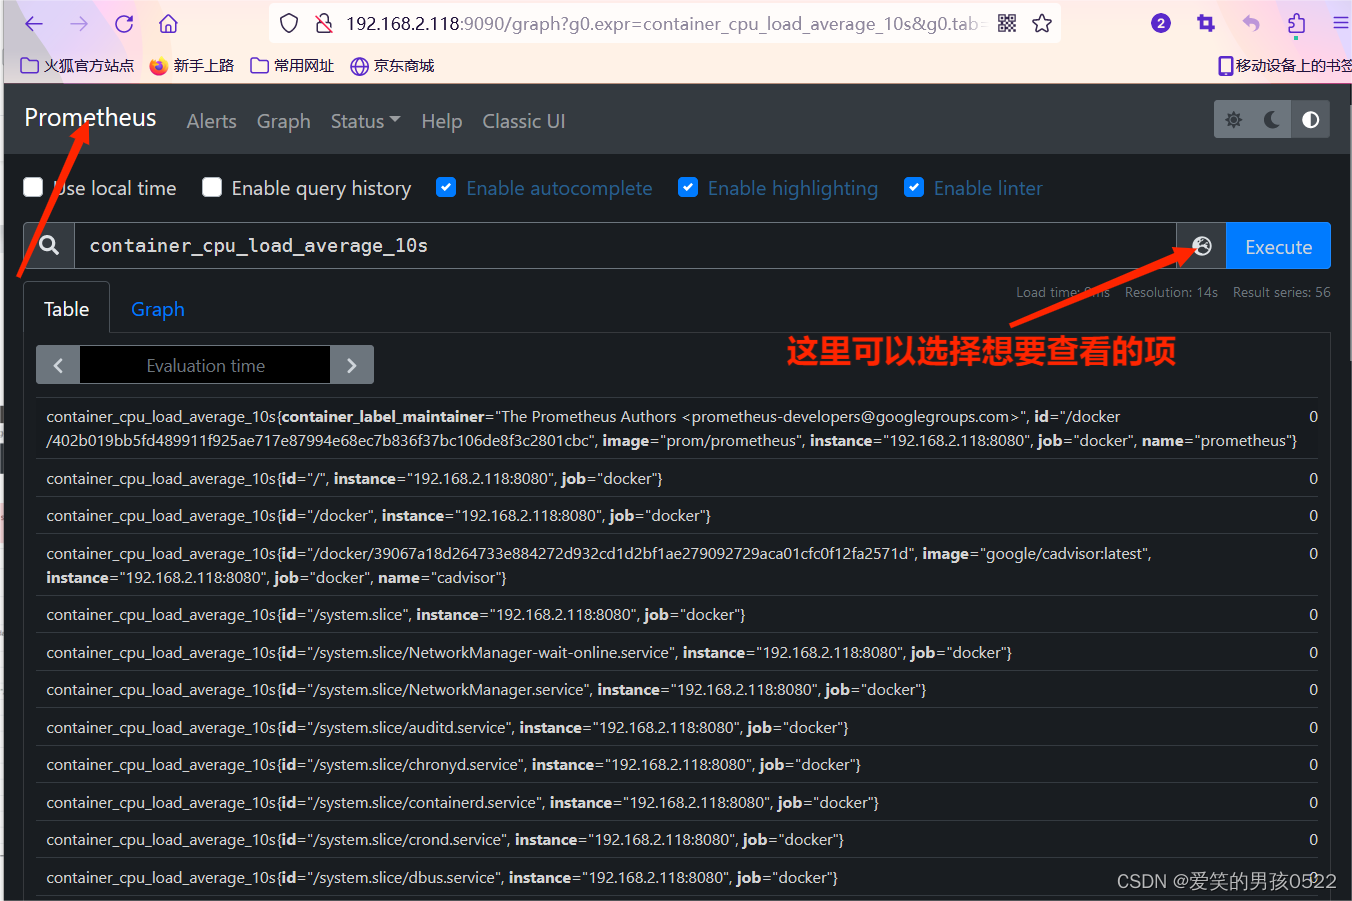
查询项是可以查到数据的
1.8、部署Granfana
[root@localhost ~]# docker run -d \
> --name=grafana \
>  -p 3000:3000 \
> grafana/grafana42b131dbf96ac1b613c6b8ac305c94eb322b8cf6b320f48990ad059bba5ba0d6
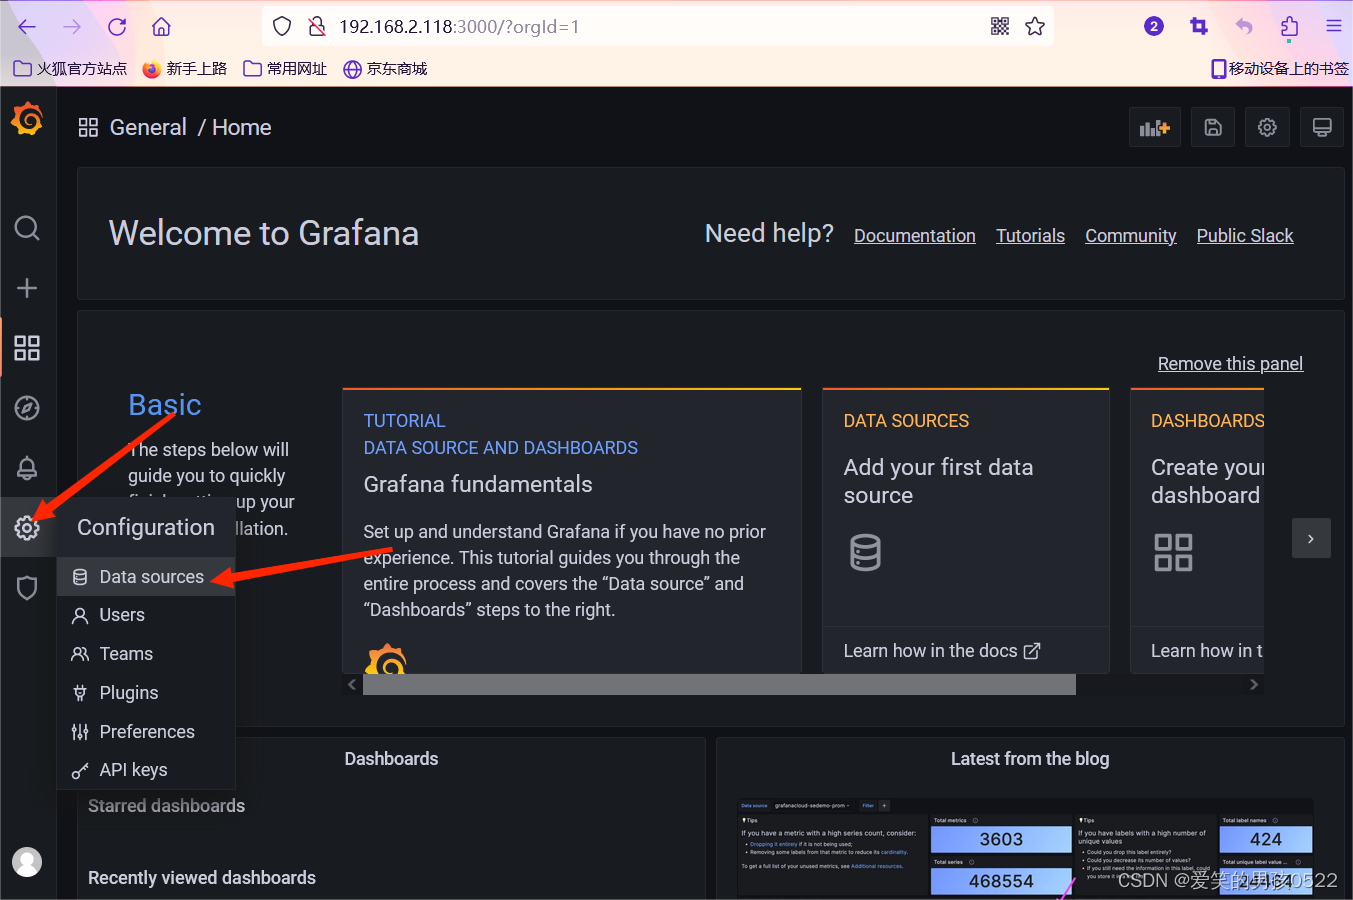
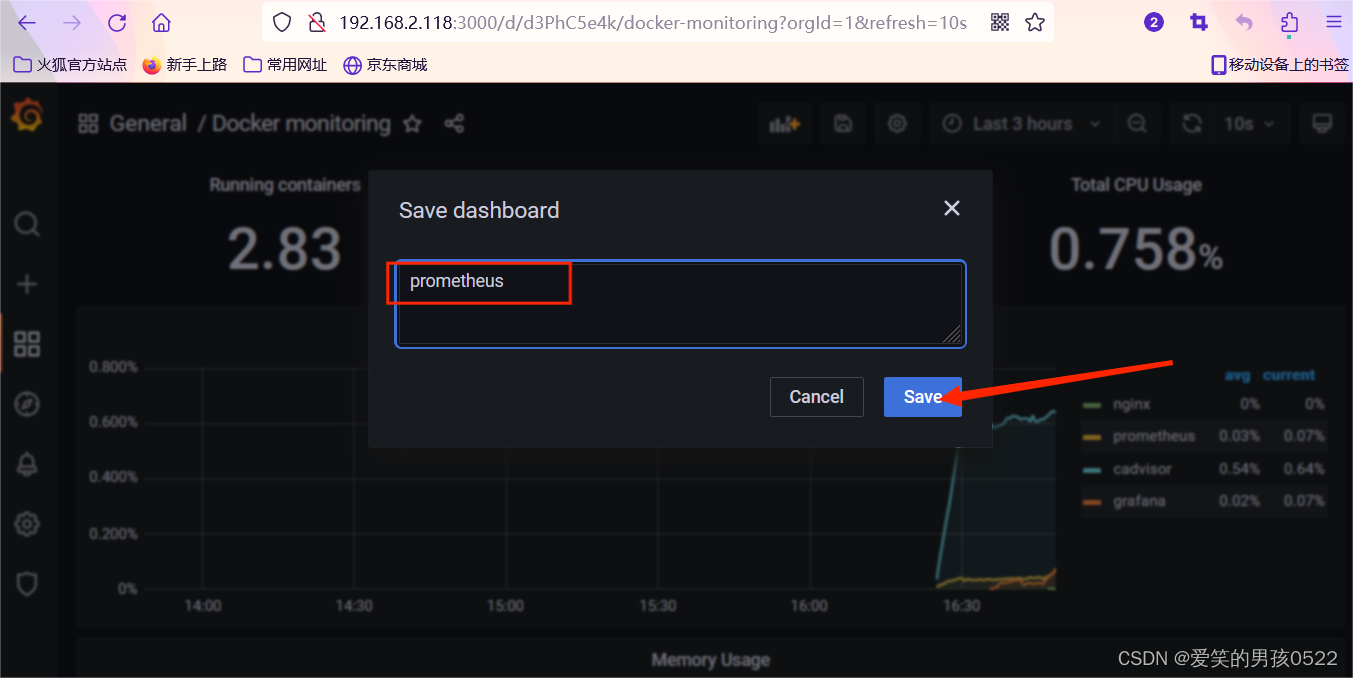
1.9、配置Granfana
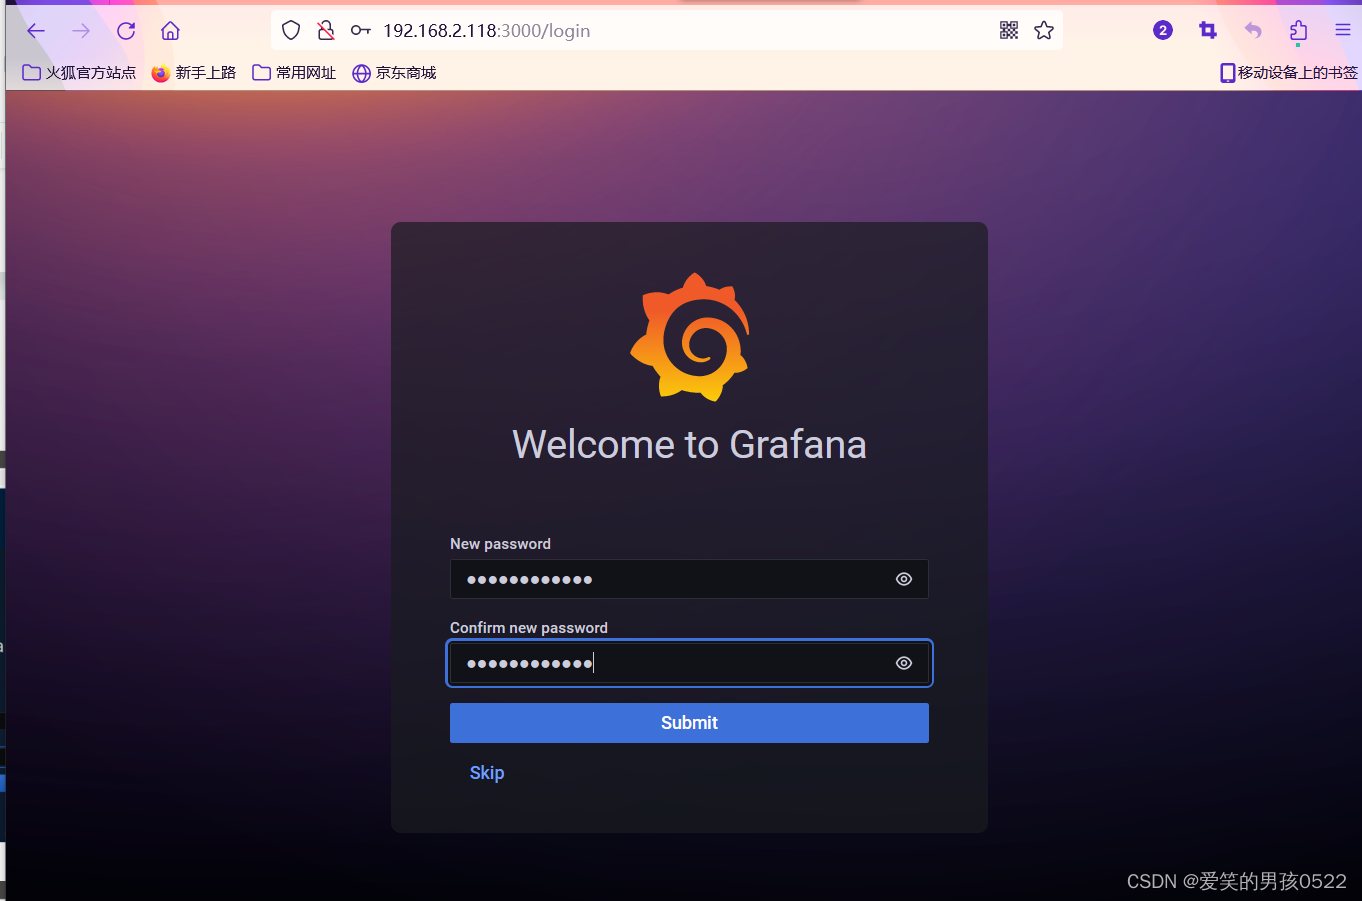
访问http://192.168.2.118:3000默认账户admin 密码 admin首次登陆需要修改密码

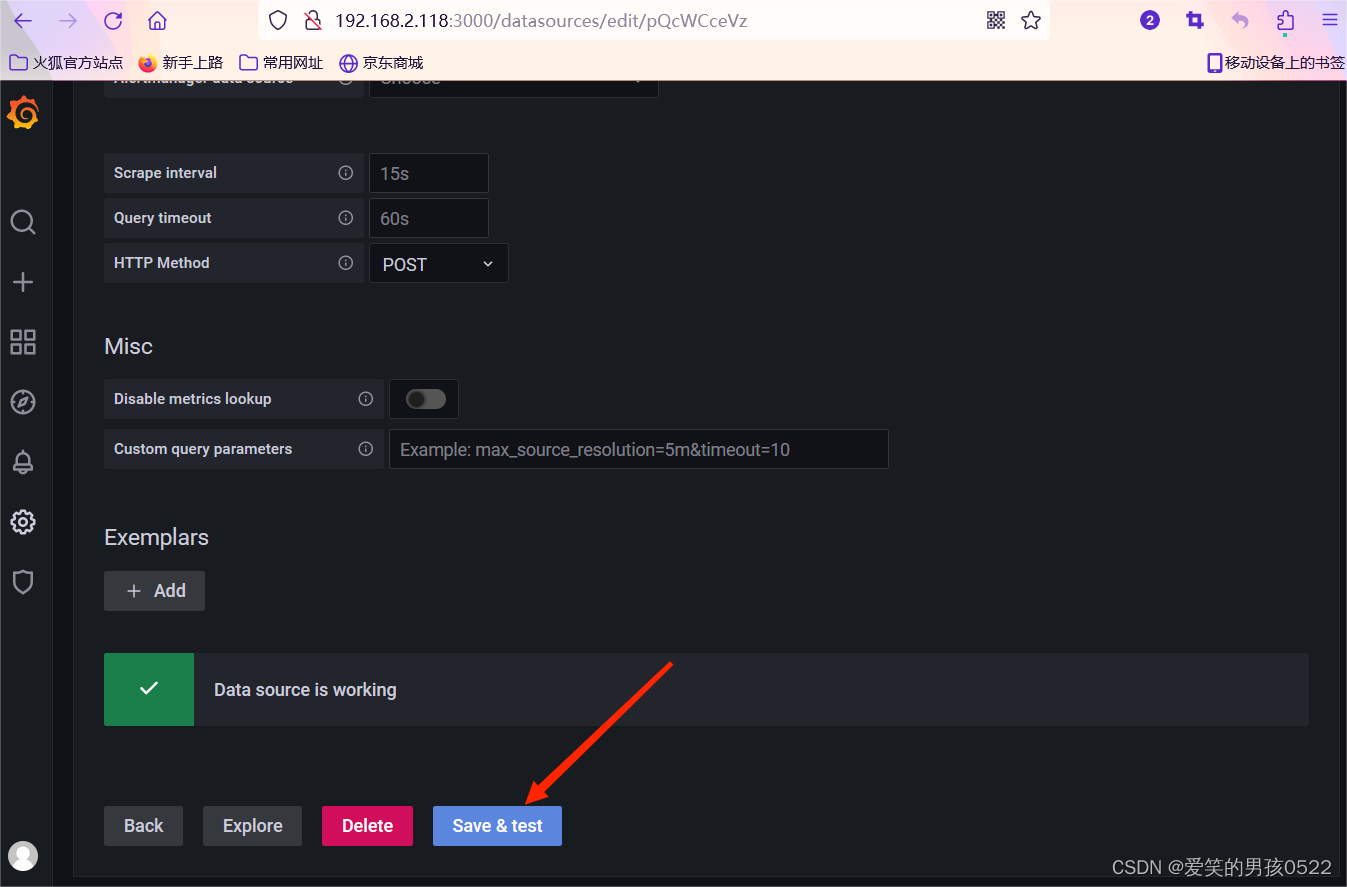
配置数据源


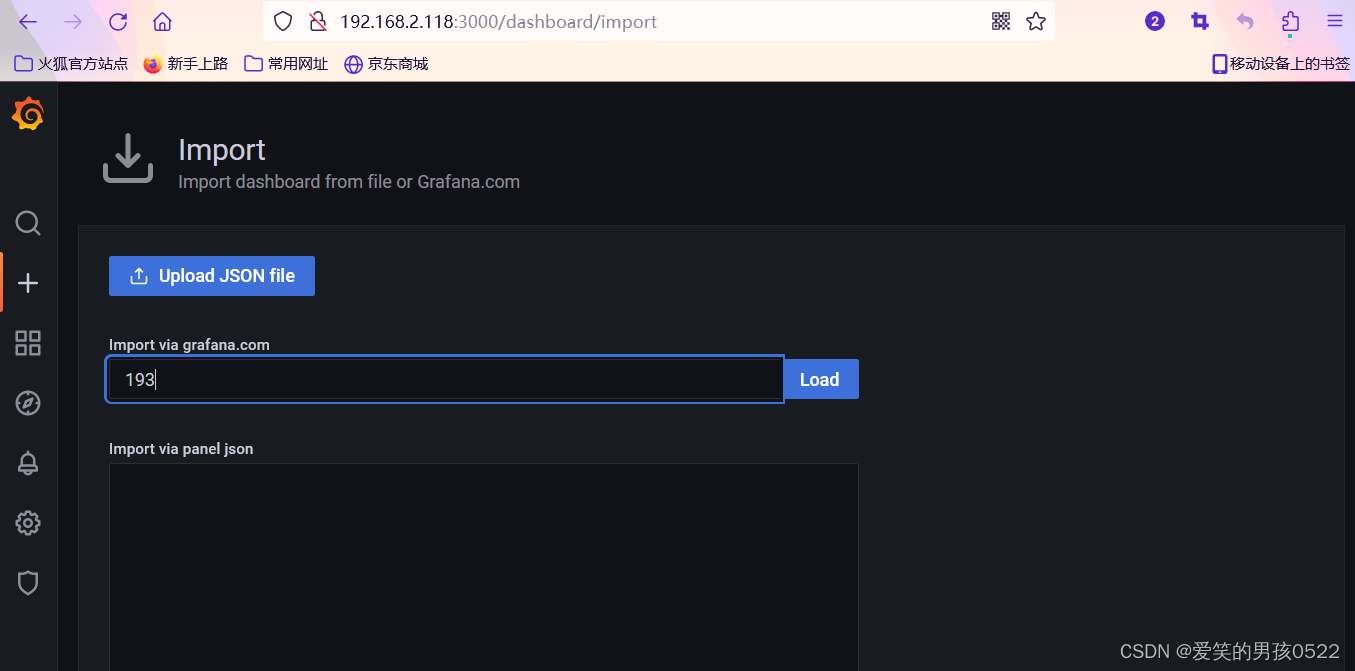
导入模板

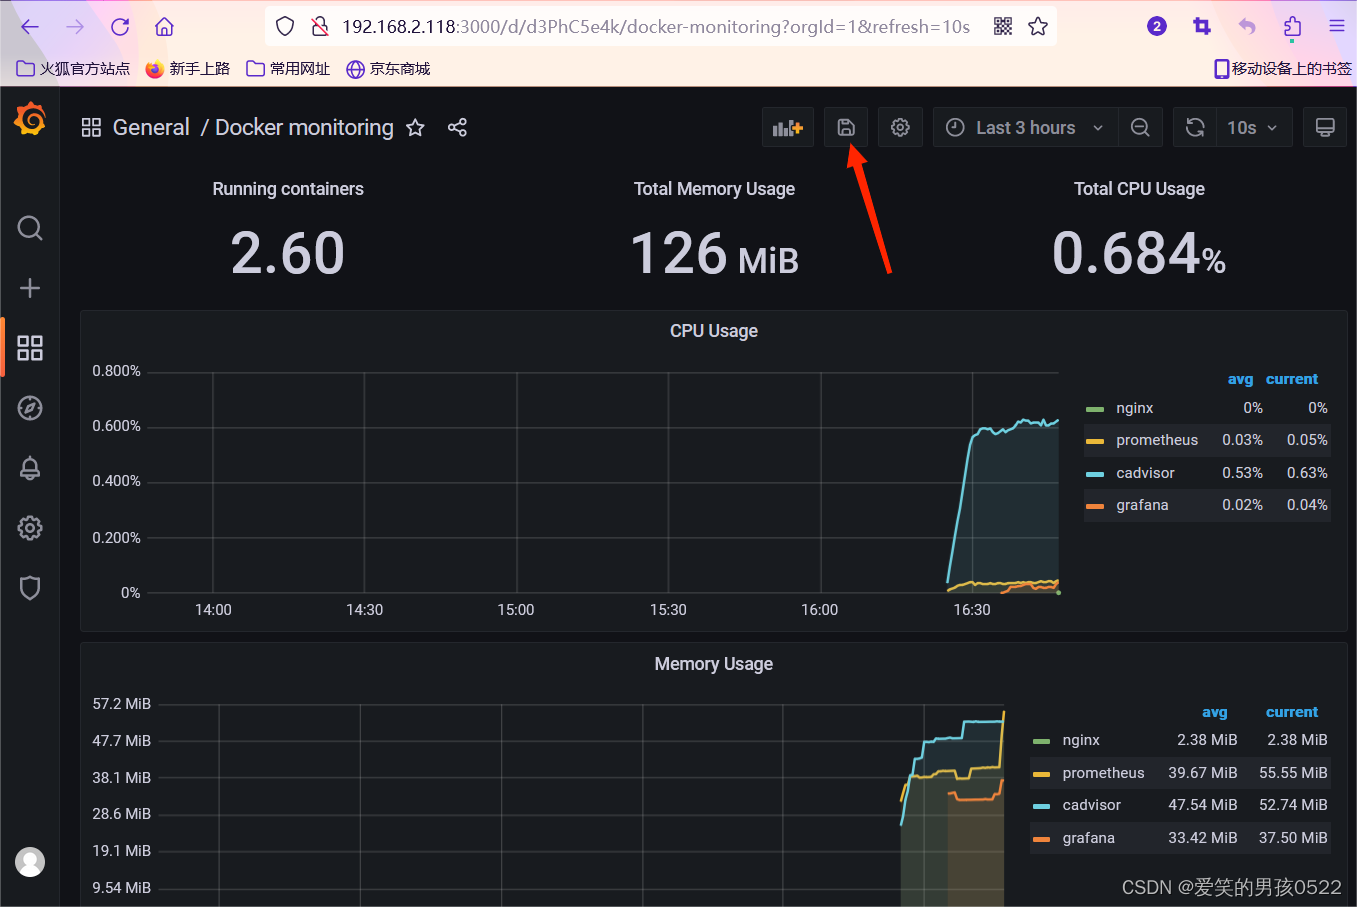
选择对应的数据源,点击导入,就可以看到被监控主机的数据

准备测试容器
[root@localhost ~]# docker run --name=nginx -d -p 80:80 nginx
d2000b50c5a035fde255c5f488fde43653733806a36167c4b73460a0c74d27f6
到此Cadvisor +Prometheus+Grafana基本架构部署完毕