【NLP舆情分析】基于python微博舆情分析可视化系统(flask+pandas+echarts) 视频教程 - 微博评论IP地图可视化分析实现
大家好,我是java1234_小锋老师,最近写了一套【NLP舆情分析】基于python微博舆情分析可视化系统(flask+pandas+echarts)视频教程,持续更新中,计划月底更新完,感谢支持。今天讲解微博评论IP地图可视化分析实现
视频在线地址:
2026版【NLP舆情分析】基于python微博舆情分析可视化系统(flask+pandas+echarts+爬虫) 视频教程 (火爆连载更新中..)_哔哩哔哩_bilibili
课程简介:
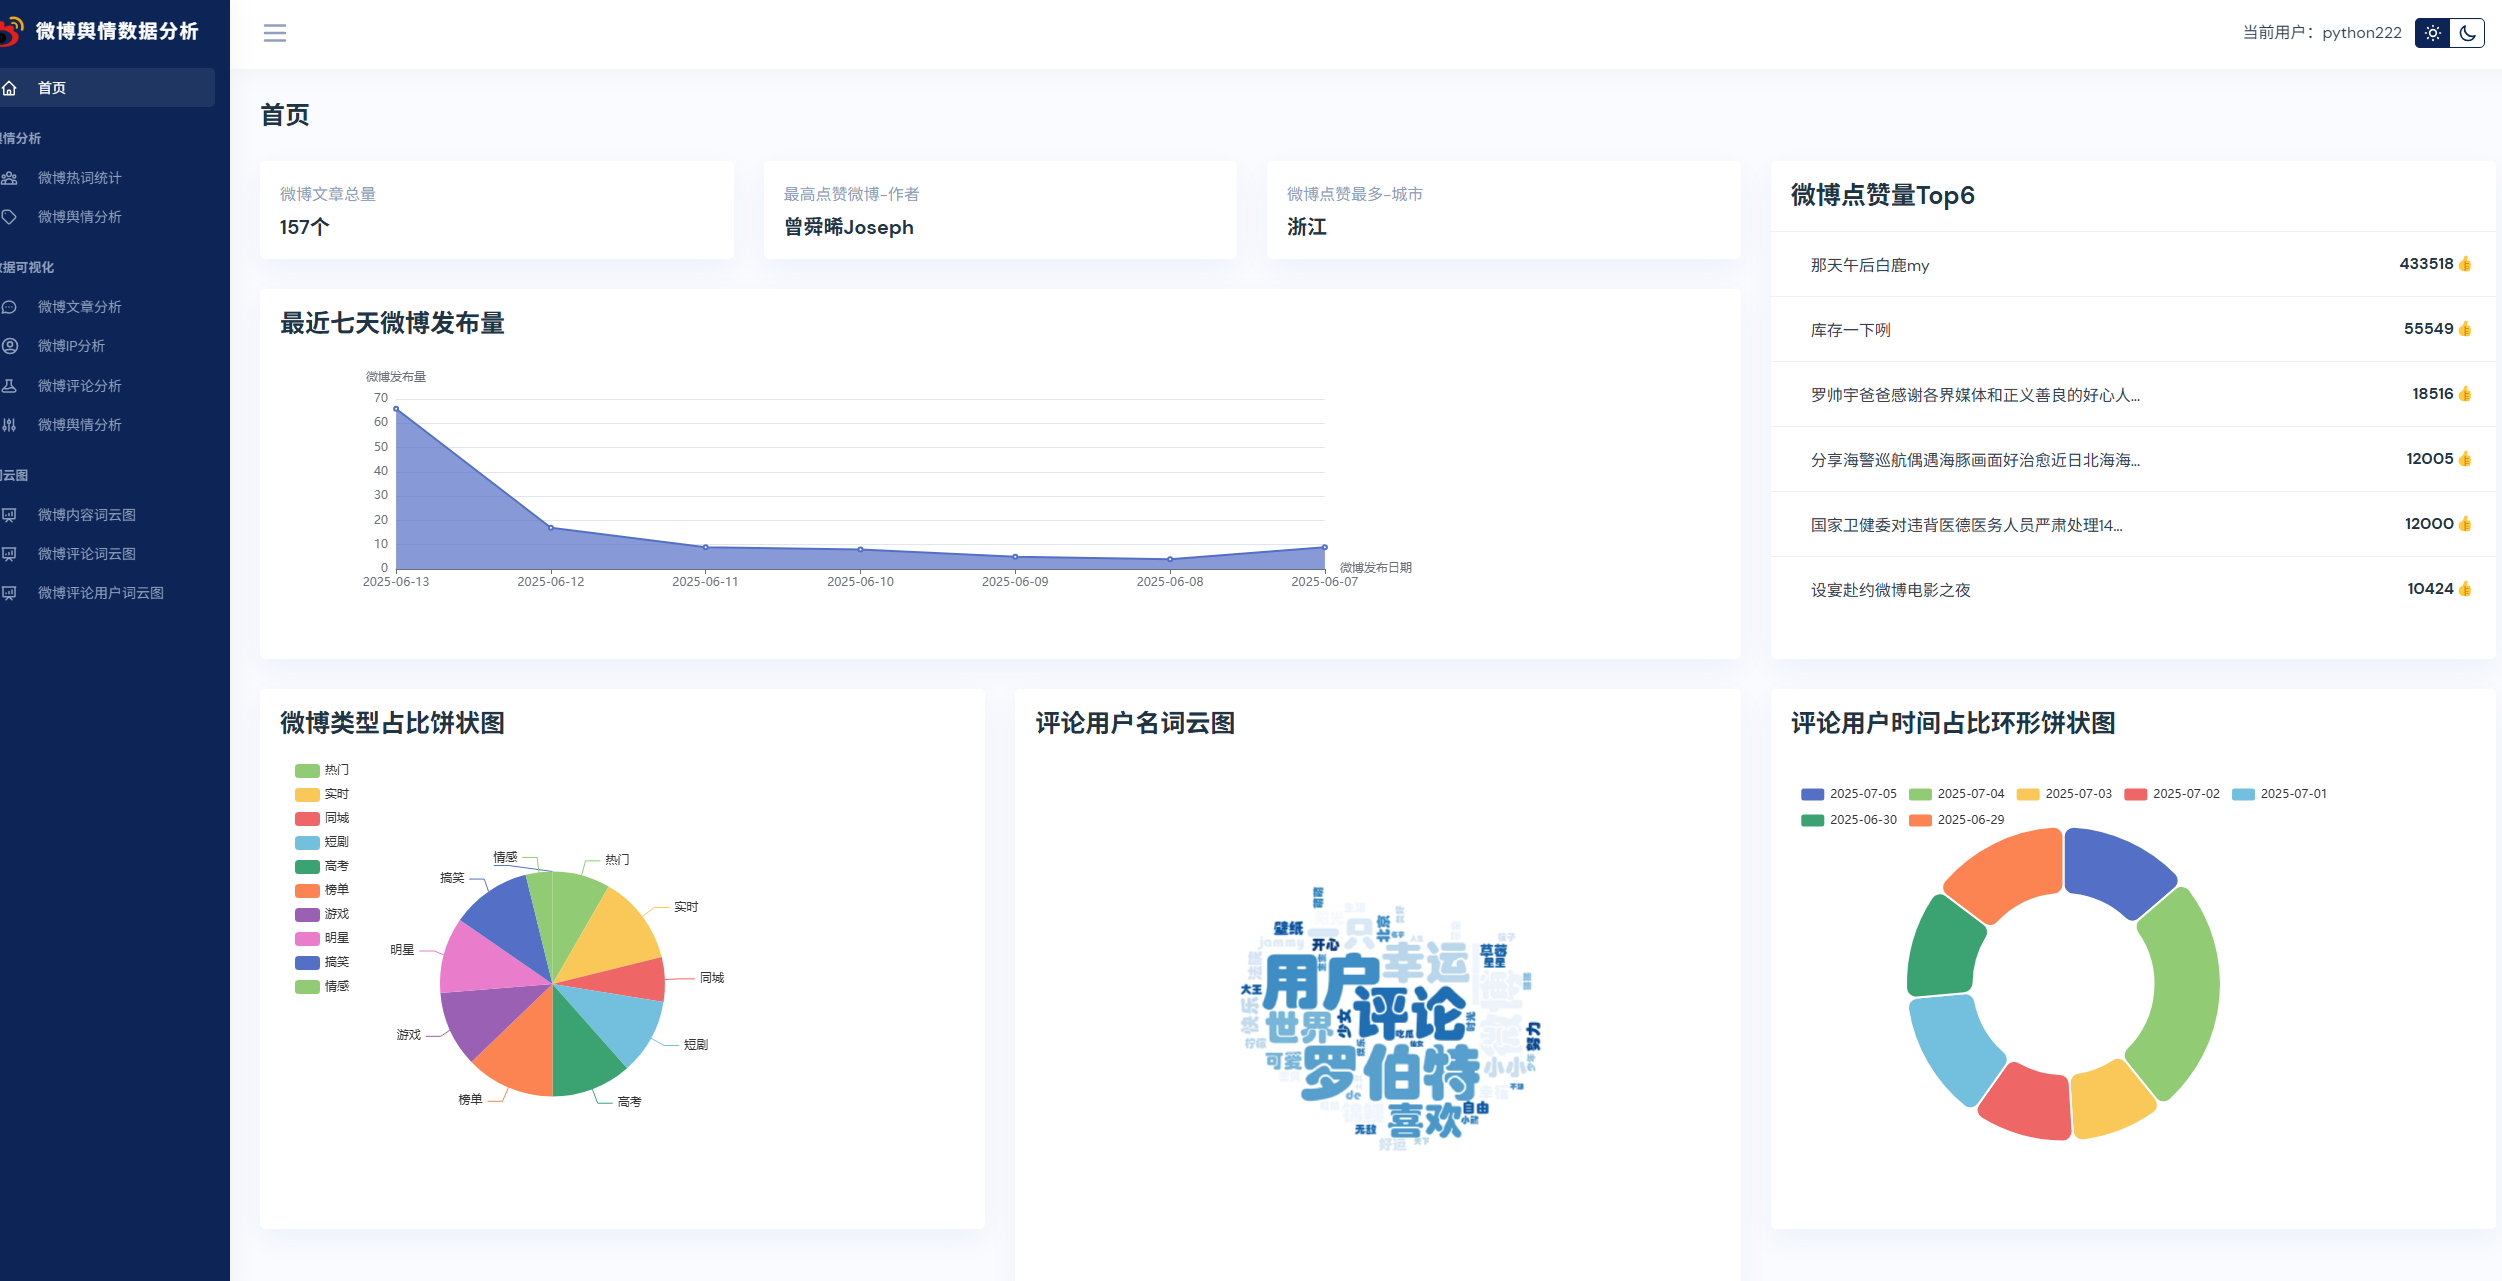
本课程采用主流的Python技术栈实现,Mysql8数据库,Flask后端,Pandas数据分析,前端可视化图表采用echarts,以及requests库,snowNLP进行情感分析,词频统计,包括大量的数据统计及分析技巧。
实现了,用户登录,注册,爬取微博帖子和评论信息,进行了热词统计以及舆情分析,以及基于echarts实现了数据可视化,包括微博文章分析,微博IP分析,微博评论分析,微博舆情分析。最后也基于wordcloud库实现了词云图,包括微博内容词云图,微博评论词云图,微博评论用户词云图等功能。
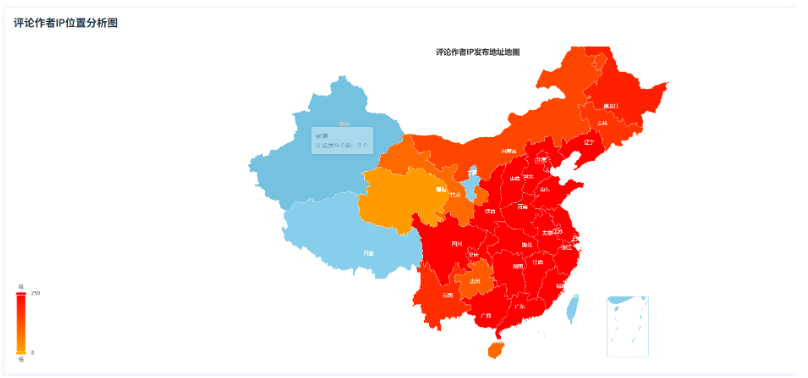
微博评论IP地图可视化分析实现
同理,我们在ipDataAnalysis方法里实现下评论IP代码:
cityDic2 = {} # 微博评论作者IPcommentList = commentDao.getAllComment()for comment in commentList:if comment[3]:for city in cityList:if city['province'].find(comment[3]) != -1:if cityDic2.get(city['province'], -1) == -1:cityDic2[city['province']] = 1else:cityDic2[city['province']] += 1commentCityDicList = [{'name': x[0],'value': x[1]} for x in cityDic2.items()]
return render_template('ipDataAnalysis.html',articleCityDicList=articleCityDicList,commentCityDicList=commentCityDicList)前端再实现下评论IP图表代码:
<script>
function formatValue(value) {if (value) {return value} else {return 0}}
var chartDom = document.getElementById('plMain');var myChart = echarts.init(chartDom);var option;
option = {title: {text: '评论作者IP发布地址地图',left: 'center',textStyle: {color: '#333',fontWeight: "bold"}},tooltip: {trigger: 'item',formatter: function (params) {return params.name + '<br>评论发布个数:' + formatValue(params.value) + ' 个'}},visualMap: {min: 0,max: 250,text: ['高', '低'],realtime: true,calculable: true,inRange: {color: ['orange', 'red']}},series: [{type: 'map',map: 'china',label: {normal: {show: true,color: "white",fontSize: "12"},},emphasis: {label: {show: true}},data:{{ commentCityDicList | tojson }},
itemStyle: {normal: {areaColor: "skyblue",borderColor: "#fff"},emphasis: {areaColor: "#2B91B7"}},zoom: 1.4,roam: true}]};
option && myChart.setOption(option);
</script>