监控系列(六)prometheus监控DMHS操作步骤
一、监控的操作逻辑
- 给操作系统安装expect命令
- expect脚本执行dmhs_console脚本执行 cpt / exec 命令
- 用脚本进行过滤字符串过滤
- dm_export读取脚本与当前日期作比较,然后返回差值
二、安装步骤
1. linux中Expect工具的安装及使用方法
https://blog.csdn.net/wangtaoking1/article/details/78268574
# wget https://sourceforge.net/projects/tcl/files/Tcl/8.4.19/tcl8.4.19-src.tar.gz
# tar zxvf tcl8.4.19-src.tar.gz
# cd tcl8.4.19/unix && ./configure
# make
# make install# 回退到基目录下在执行一下操作# wget http://sourceforge.net/projects/expect/files/Expect/5.45/expect5.45.tar.gz
# tar zxvf expect5.45.tar.gz
# cd expect5.45
# ./configure --with-tcl=/usr/local/lib --with-tclinclude=../tcl8.4.19/generic
# make
# make install
# ln -s /usr/local/bin/expect /usr/bin/expect# 安装完成之后运行expect命令,查看是否安装成功。
# expect
expect1.1>
2. dm_exporter工具配置文件
调整application.yml
新增dmhs的相关属性,注意enableType类型 需要区分源端以及目的端
[root@p4-oakdmdb02 dm_exporter]# vi application.yml spring:application:name: dm-prometheus
server:port: 9200##ip识别错误时使用ip:##主机的hostnamehostname:##告警保留时间(分钟)alarmSaveTime: 5##大key的保留时间(表空间使用 分组)bigKeySaveTime: 720##会话等待的检测时间(分钟) 检测会话等待值 sql传参waitingSessionTime: 5##是否屏蔽特殊项 0 不屏蔽 1屏蔽 (屏蔽定时任务、sql超时)specialCheck: 1
dmdbms:jdbcUrl:  jdbc:dm://127.0.0.1:5236username: SYSDBApassword: SYSDBA
dmhs:## 0 不启动  1 cpt源端 2 目的端enableType: 0installBinPath: /home/dmdba/dmhs/bin
management:endpoints:# 关闭所有的检查项enabled-by-default: falseweb:exposure:# 暴露监控接口,*为全部接口include: 'prometheus'# 不暴露接口#        exclude: 'info'base-path: "/"# 对外暴露prometheus接口并擦好看更多健康信息endpoint:prometheus:enabled: truehealth:show-details: always## 关闭内置的检查项metrics:enable:jvm: falselogback: falsefiles: falsetomcat: falseexecutor: falsedisk: falseuptime: falseintegration: falsetrace:http:enabled: false
logging:config: classpath:log4j2.xml
生成脚本(get_hs_console_info.sh)
工具自动生成,此脚本做参考
#!/usr/bin/env bash/usr/bin/expect << EOF
set timeout 3
spawn /home/dmdba/dmhs_new_20230925/bin/dmhs_console
send "cpt\r"
send "exit\r"
expect eof
EOF
生成脚本(get_hs_console_result_info.sh)
工具自动生成,此脚本做参考
#!/usr/bin/env bash
HS_BIN_DIR=/home/dmdba/dmhs_new_20230925/bin
SCRIPT_DIR=/prometheus/dm_exporter/export_script
LOG_FILE=$SCRIPT_DIR/hs_console.txt
RESULT_FILE=$SCRIPT_DIR/hs_console_result.txt
cd $HS_BIN_DIR
sh $SCRIPT_DIR/get_hs_console_info.sh >$LOG_FILE
sed -i 's/\x1B\[[0-9;]*m//g; s/\x0D$//g; s/\^M\$//g' $LOG_FILE
CheckPointTime=`cat $LOG_FILE |grep "checkpoint time"|awk -F " : " '{print $3}'|awk -F " " '{print $1,$2}'|awk 'NR==1{print}'`
echo 'CheckPointTime='$CheckPointTime'' > $RESULT_FILE
CurrentLogTime=`cat $LOG_FILE |grep "current log time"|awk -F " : " '{print $2}'|awk -F " " '{print $1,$2}'|awk 'NR==1{print}'`
echo 'CurrentLogTime='$CurrentLogTime'' >> $RESULT_FILE[root@p4-oa15dmdb01 export_script]# cat hs_console_result.txt
CheckPointTime=2023-10-13 11:41:21
CurrentLogTime=2023-10-13 13:28:10
三、调整promehteus配置文件
1. 添加主机配置 prometheus.yml
[root@Zabbbix prometheus-2.35.0]# vim prometheus.yml# my global config
global:scrape_interval: 1m # Set the scrape interval to every 15 seconds. Default is every 1 minute.evaluation_interval: 1m # Evaluate rules every 15 seconds. The default is every 1 minute.scrape_timeout: 1m # scrape_timeout is set to the global default (10s).# Alertmanager configuration
alerting:alertmanagers:- static_configs:- targets:- 127.0.0.1:9093# Load rules once and periodically evaluate them according to the global 'evaluation_interval'.
rule_files:- "rules/*.yml"# - "rules/*_alerts.yml"# A scrape configuration containing exactly one endpoint to scrape:
# Here it's Prometheus itself.
scrape_configs:# The job name is added as a label `job=<job_name>` to any timeseries scraped from this config.- job_name: "prometheus"static_configs:- targets: ["localhost:9090"]- job_name: "dmdbms_bgoak_dw"metrics_path: "/prometheus"static_configs:- targets: ["192.63.97.93:9200","192.63.97.94:9200"]labels:cluster_name: '办公OAK'
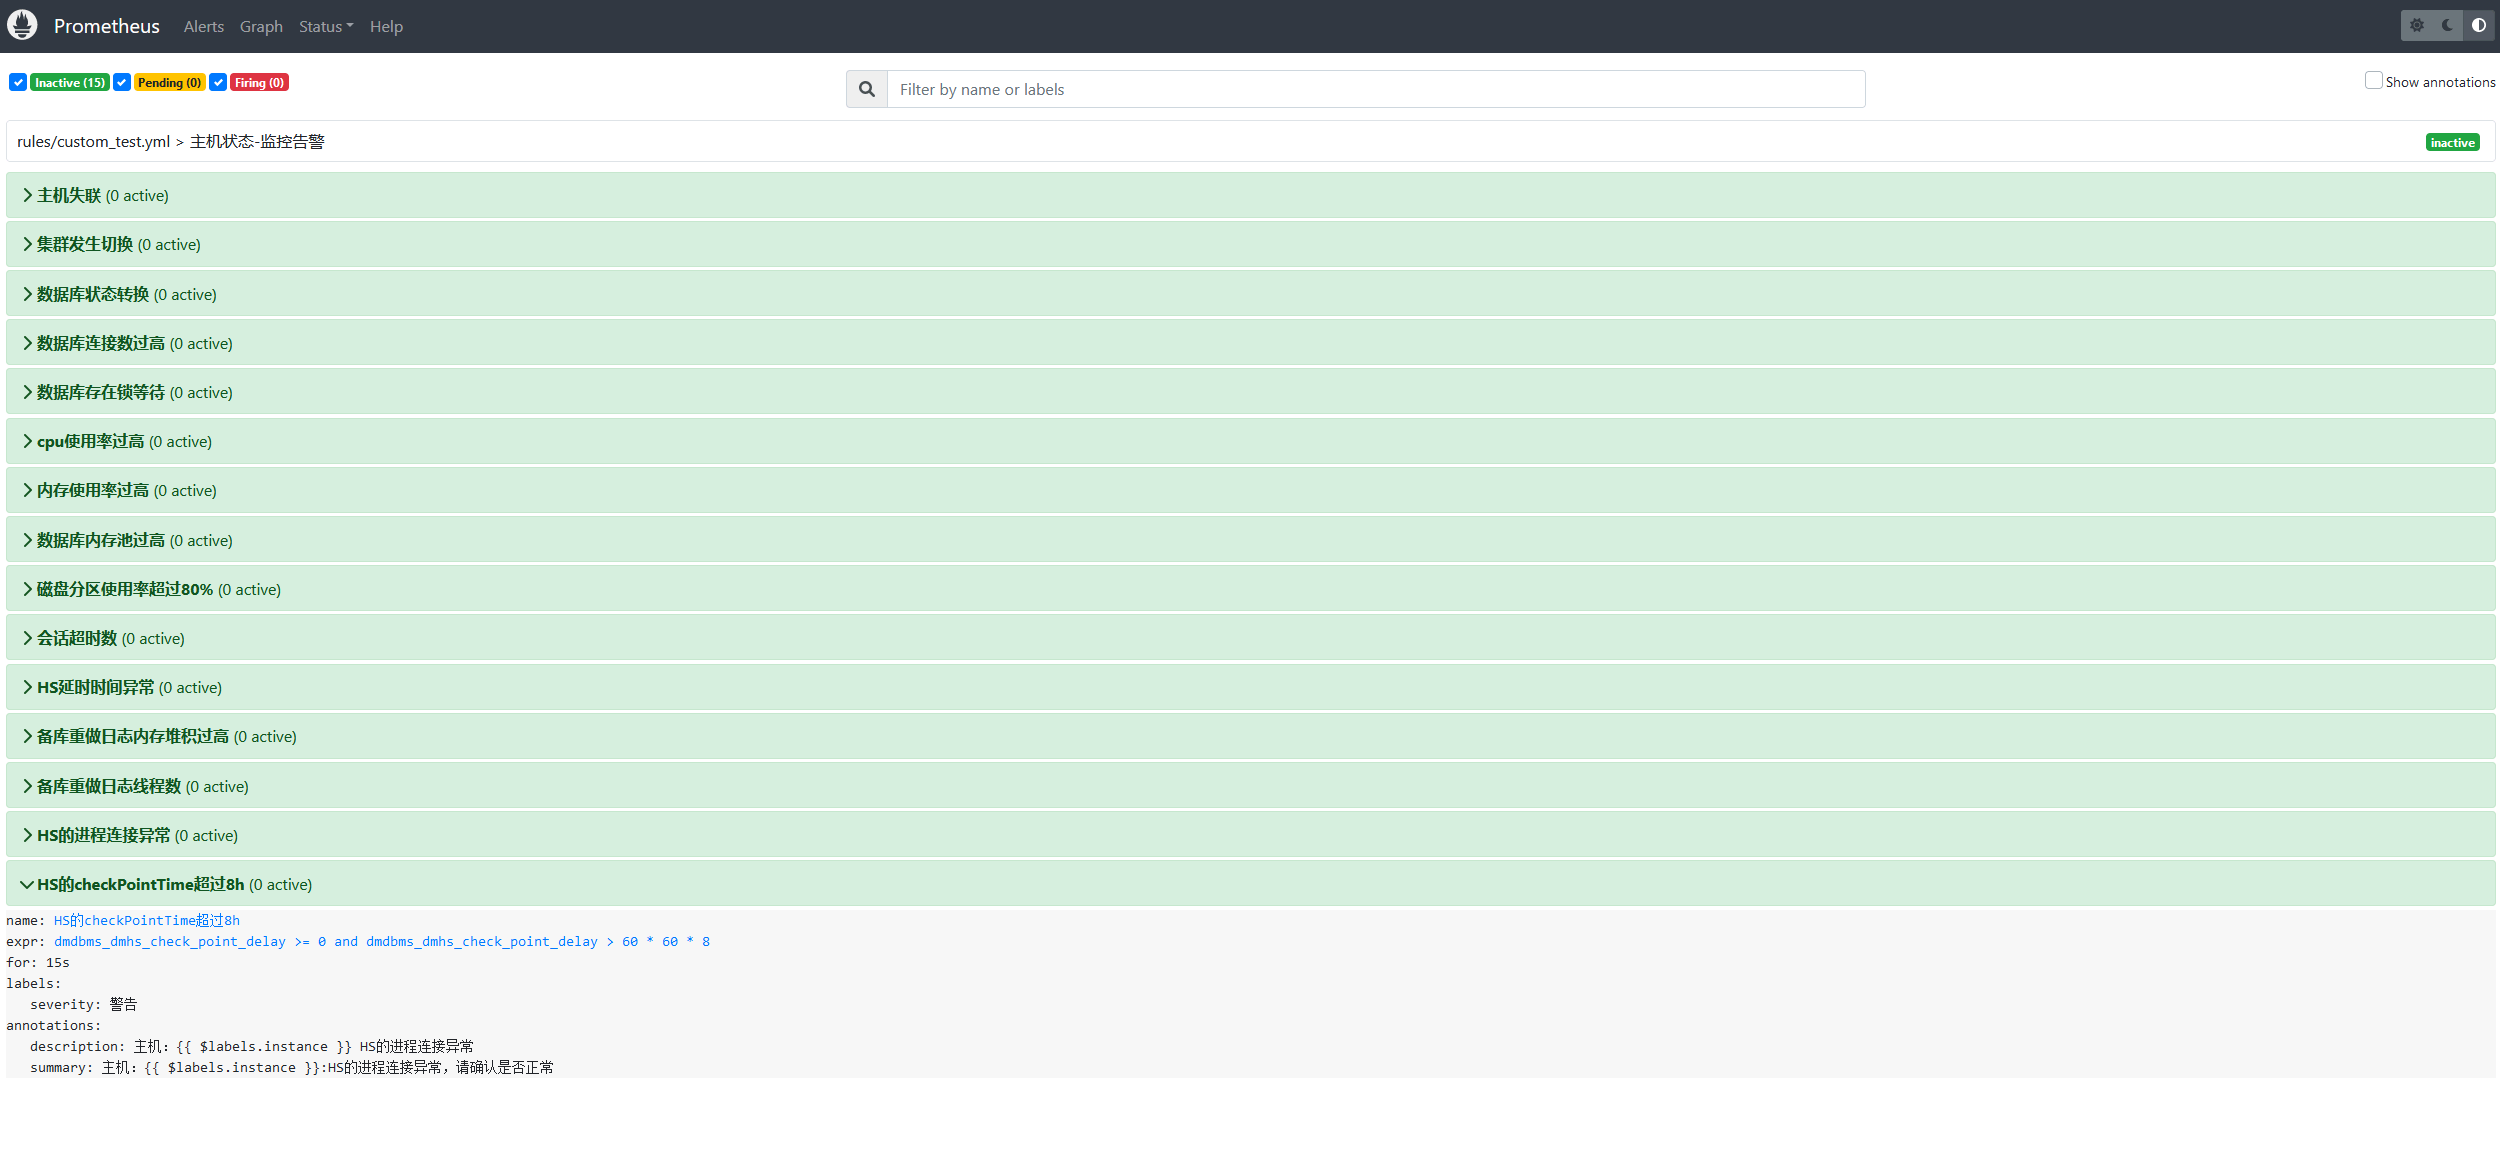
2. 添加告警规则vim custom_test.yml
[root@Zabbbix rules]# vim custom_test.yml- alert: 备库重做日志内存堆积过高expr: dmdbms_rapply_sys_task_mem_used >= 512000000for: 15slabels:severity: 警告annotations:description: "主机:{{ $labels.instance }} 备库重做日志内存堆积过高"summary: "主机:{{ $labels.instance }}:备库重做日志内存堆积过高,请确认是否正常"- alert: 备库重做日志线程数expr: dmdbms_rapply_sys_task_num >= 2048for: 15slabels:severity: 警告annotations:description: "主机:{{ $labels.instance }} 备库重做日志线程数过高"summary: "主机:{{ $labels.instance }}:备库重做日志线程数过高,请确认是否正常"- alert: HS的进程连接异常expr: dmdbms_dmhs_process_is_exit == 0for: 15slabels:severity: 警告annotations:description: "主机:{{ $labels.instance }} HS的进程连接异常"summary: "主机:{{ $labels.instance }}:HS的进程连接异常,请确认是否正常"- alert: HS的checkPointTime超过8hexpr: dmdbms_dmhs_check_point_delay >=0 and dmdbms_dmhs_check_point_delay > 60*60*8for: 15slabels:severity: 警告annotations:description: "主机:{{ $labels.instance }} HS的checkPointTime超过8h"summary: "主机:{{ $labels.instance }}:HS的checkPointTime超过8h,请确认是否正常"
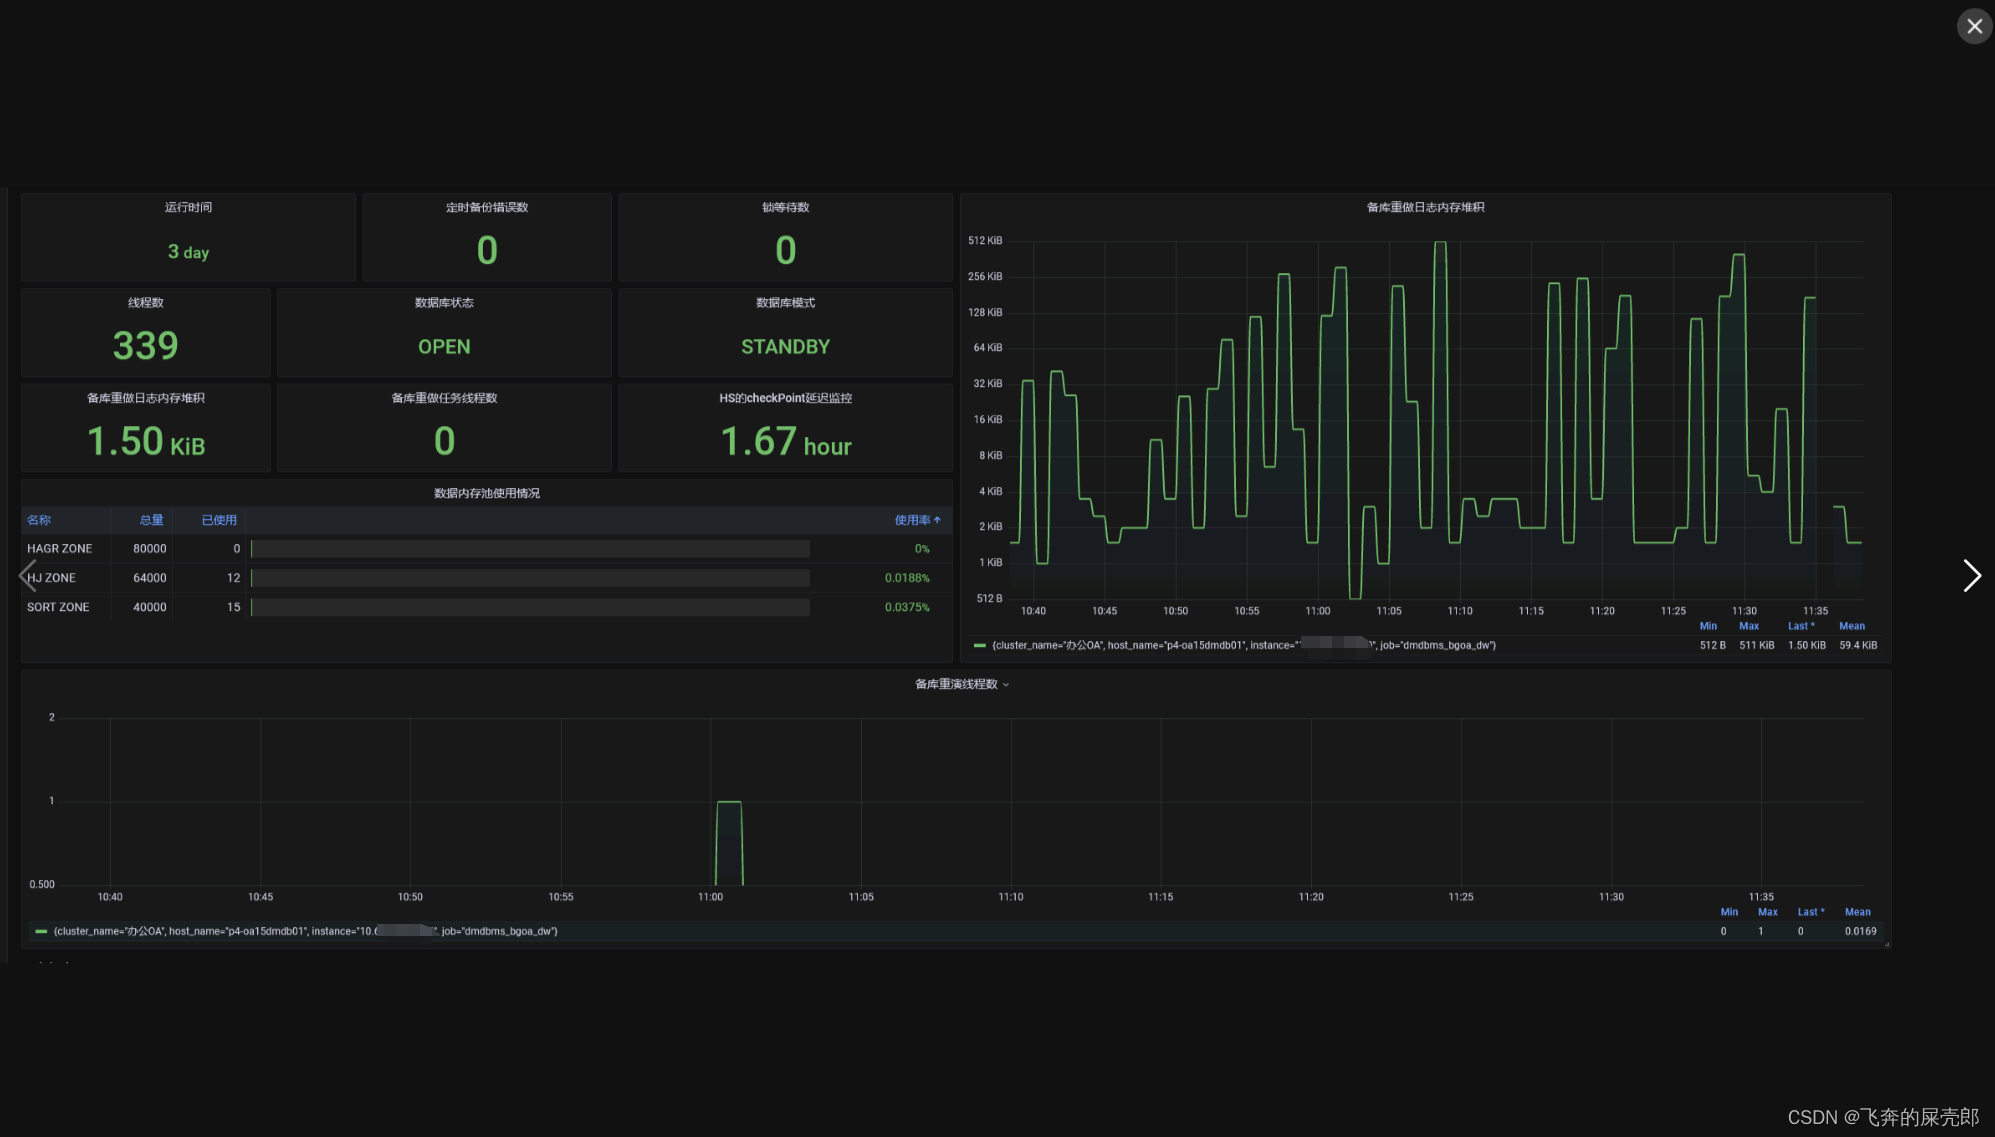
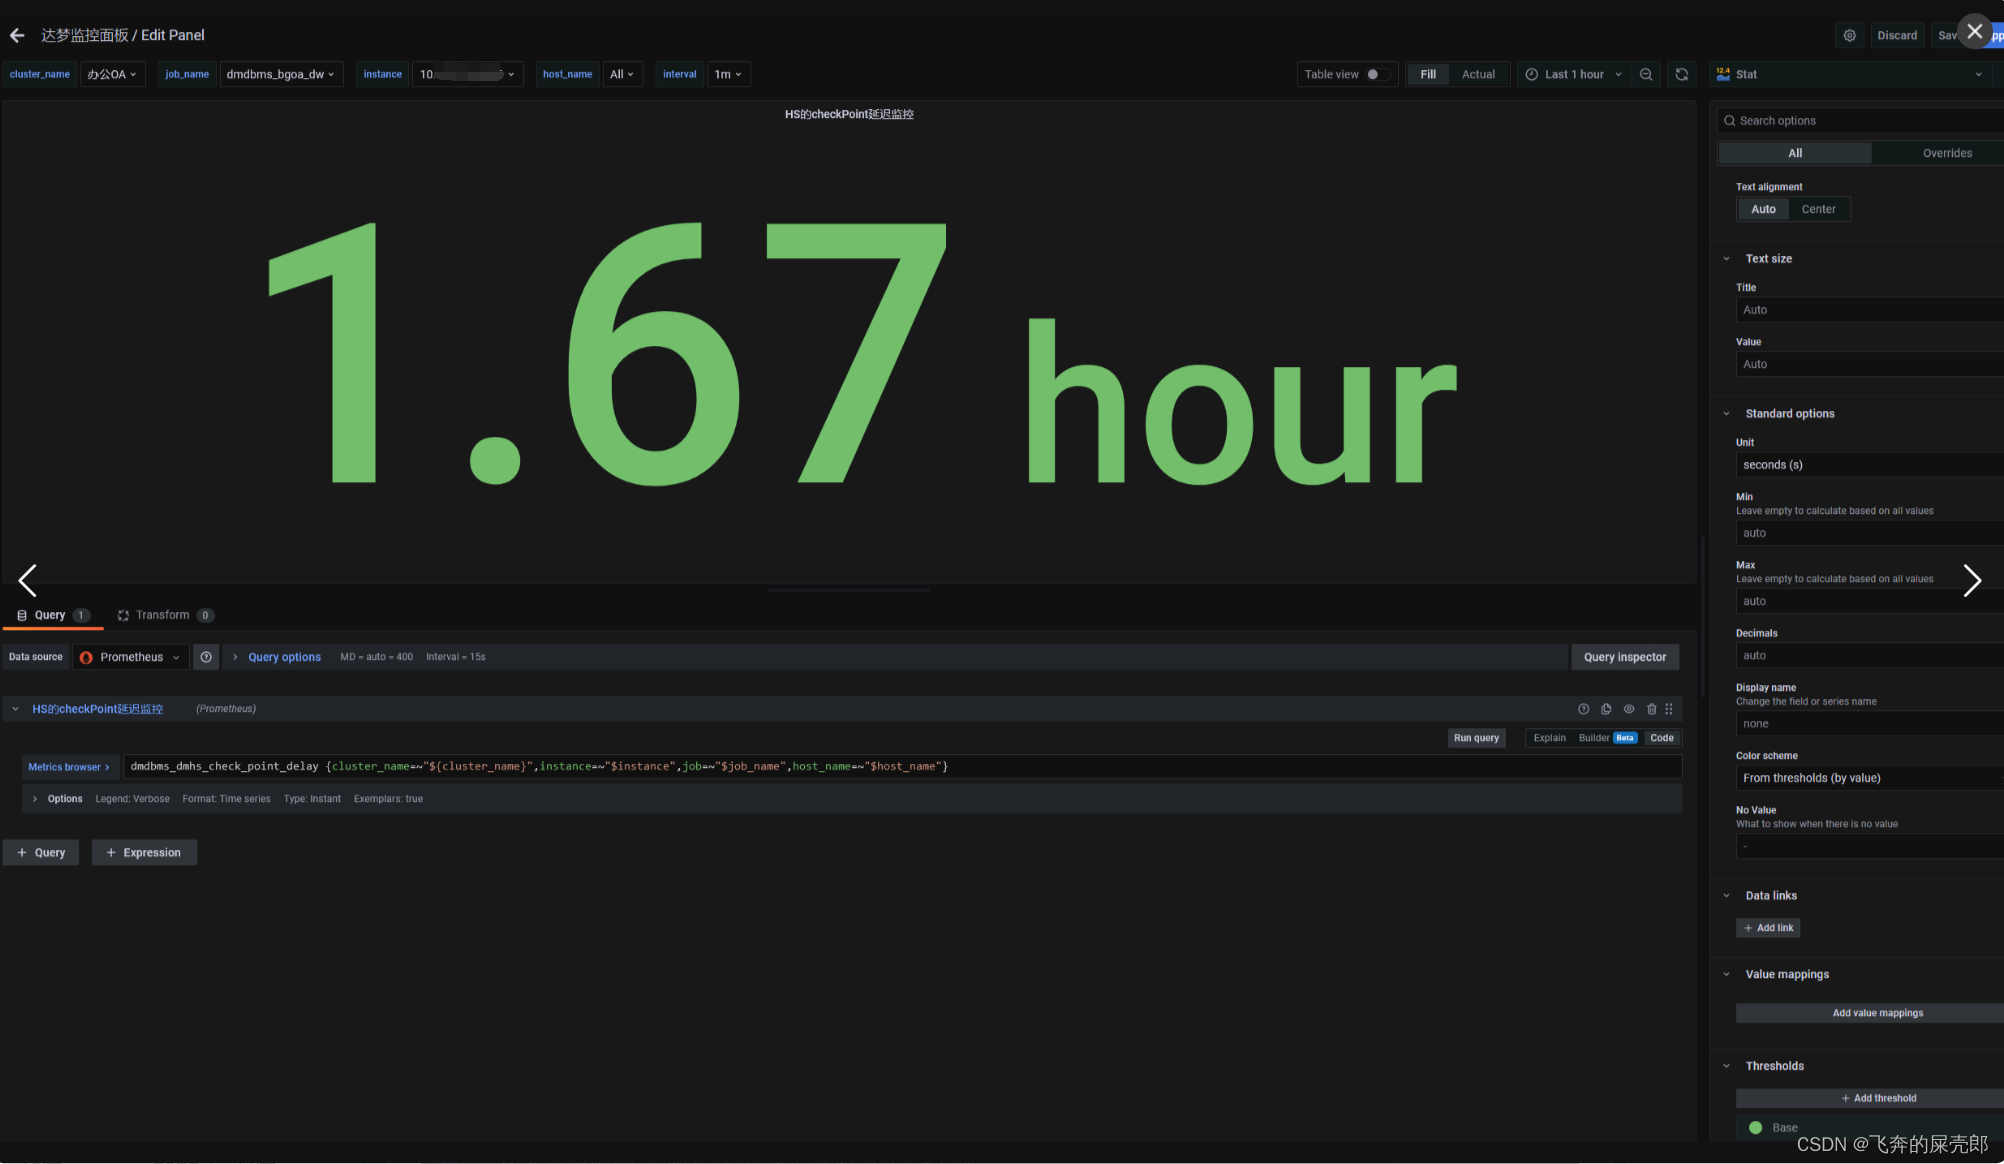
四、修改grafana图表
效果如下:
五、报错
安装expect报错 no acceptable cc found in $PATH

# 安装gcc的依赖环境
yum install gcc-c++