Android studio “Layout Inspector“工具在Android14 userdebug设备无法正常使用
背景描述
做rom开发的都知道,“Layout Inspector”和“Attach Debugger to Android Process”是studio里很好用的工具,可以用来查看布局、调试系统进程(比如setting、launcher、systemui)。
问题描述
最进刚开始一个Android 14的项目,刷userdebug版本后,发现“Layout Inspector”和“Attach Debugger to Android Process”都无法正常使用,它像user版本一样看不到系统的进程。
拿出前半年做的Android 13 userdebug设备发现可以正常使用。
于是创建了1个Google case,请求帮助。
解决方案
在经过几轮log和截图后,google同事给出了反馈:
Thanks for the extra details.
From Android 14 if you need to debug a Java process which isn’t a debuggable app , and are using an userdebug build, you also need to enable JDWP by running the following commands
adb shell setprop persist.debug.dalvik.vm.jdwp.enabled 1
adb reboot
This change was made by the platform (Android), not by Layout Inspector.
Let me know if this fixes your problem.
验证之后是有效的,Android 14 userdebug版本的设备可以使用“Layout Inspector”和“Attach Debugger to Android Process”工具了,又可以快乐的调试系统进程了。
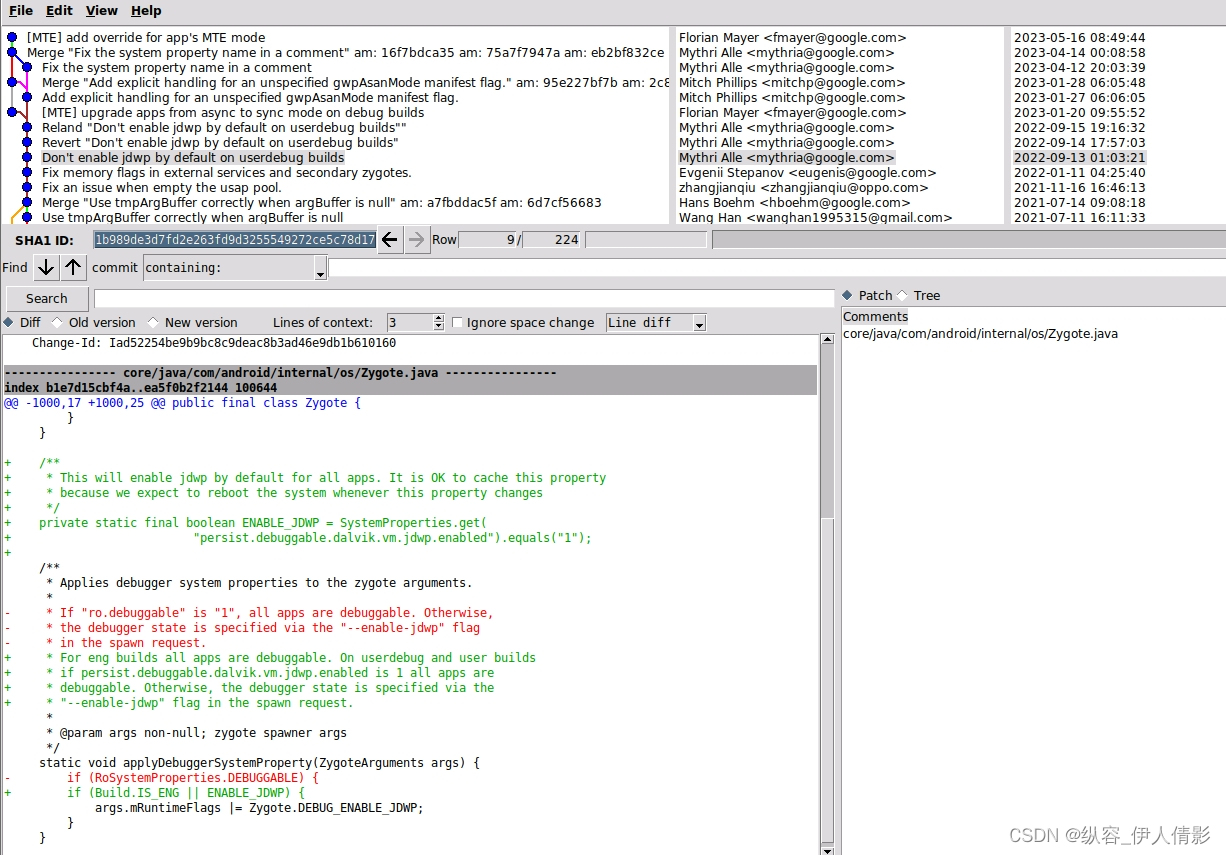
问题原因
在源码搜索persist.debug.dalvik.vm.jdwp.enabled发现是Google新加的代码。
在之前Android 13的项目里没有这段逻辑