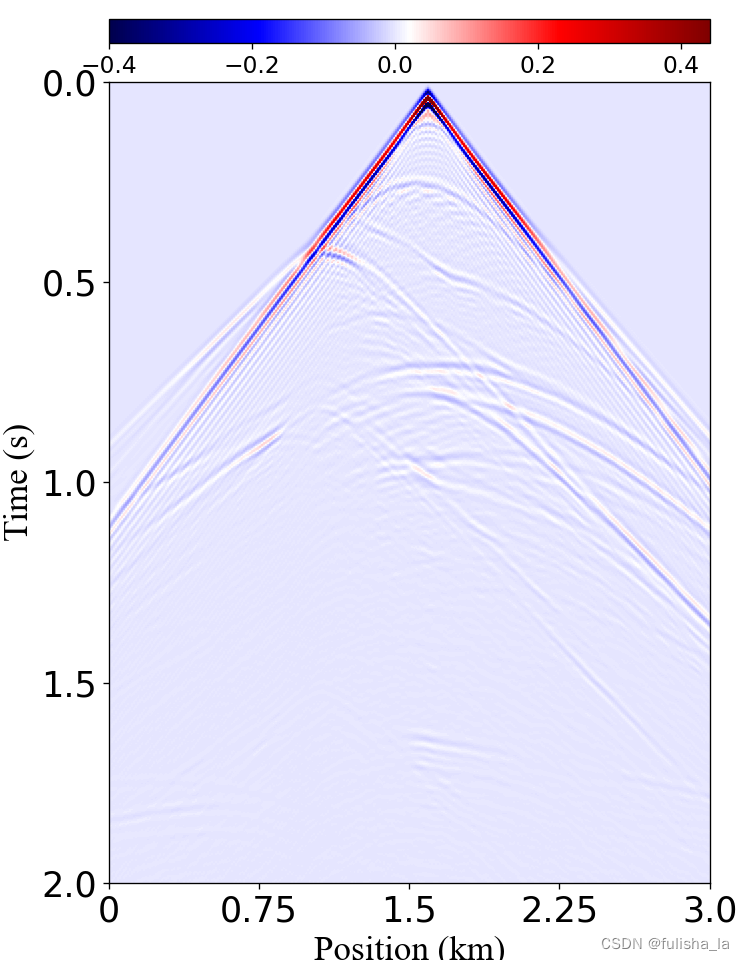
# 绘制SEG盐层数据的地震图像
def pain_seg_seismic_data(para_seismic_data):'''Plotting seismic data images of SEG salt datasets:param para_seismic_data: Seismic data (400 x 301) (numpy):param is_colorbar: Whether to add a color bar (1 means add, 0 is the default, means don't add)'''fig, ax = plt.subplots(figsize=(6.2,8), dpi=120)im = ax.imshow(para_seismic_data, extent=[0,300,400,0], cmap=plt.cm.seismic, vmin=-0.4, vmax=0.44)ax.set_xlabel('Position (km)', font21)ax.set_ylabel('Time (s)', font21)ax.set_xticks(np.linspace(0,300,5))ax.set_yticks(np.linspace(0,400,5))ax.set_xticklabels(labels=[0,0.75,1.5,2.25,3.0], size=21)ax.set_yticklabels(labels=[0.0,0.50,1.00,1.50,2.00], size=21)plt.rcParams['font.size']=14 # Set colorbar font sizedivider =make_axes_locatable(ax)cax = divider.append_axes("top", size="3%", pad=0.32)plt.colorbar(im, ax=ax, cax=cax, orientation='horizontal')plt.subplots_adjust(bottom=0.08, top=0.98, left=0.11, right=0.99)plt.show()
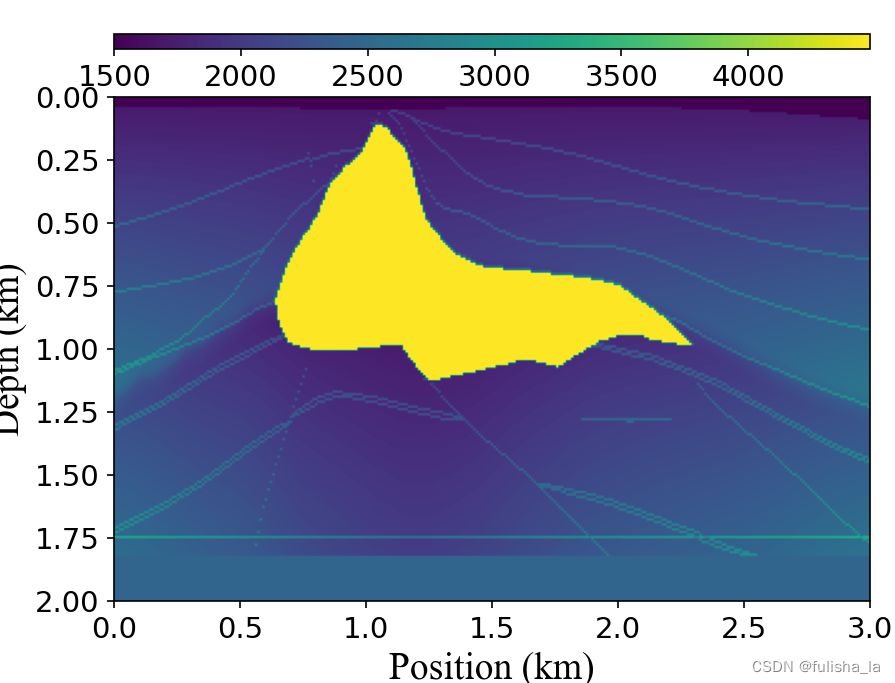
2. SEG盐速度模型
def pain_seg_velocity_model(para_velocity_model):''':param para_velocity_model: Velocity model (200 x 301) (numpy):param min_velocity: Upper limit of velocity in the velocity model:param max_velocity: Lower limit of velocity in the velocity model:return:'''fig, ax = plt.subplots(figsize=(5.8,4.3), dpi=150)im = ax.imshow(para_velocity_model, extent=[0,3,2,0])ax.set_xlabel('Position (km)', font18)ax.set_ylabel('Depth (km)', font18)ax.tick_params(labelsize=14)plt.rcParams['font.size']=14 # Set colorbar font sizedivider =make_axes_locatable(ax)cax = divider.append_axes("top", size="3%", pad=0.32)plt.colorbar(im, ax=ax, cax=cax, orientation='horizontal')plt.subplots_adjust(bottom=0.12, top=0.95, left=0.11, right=0.99)plt.show()
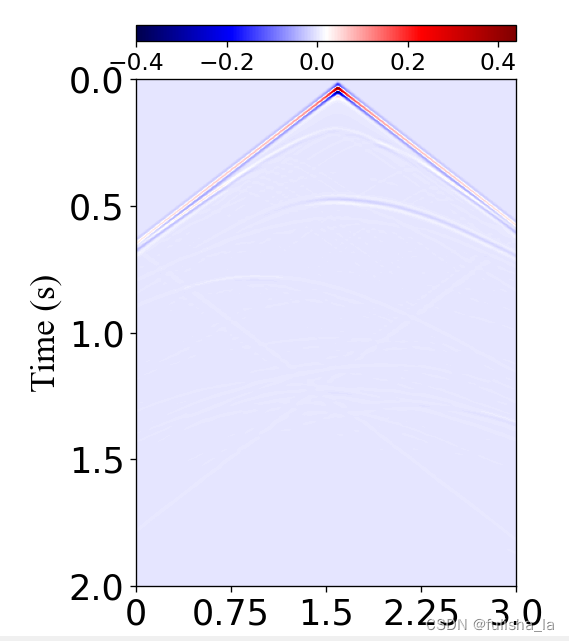
3. SEG盐模拟地震数据
def pain_seg_seismic_data(para_seismic_data):'''Plotting seismic data images of SEG salt datasets:param para_seismic_data: Seismic data (400 x 301) (numpy):param is_colorbar: Whether to add a color bar (1 means add, 0 is the default, means don't add)'''fig, ax = plt.subplots(figsize=(6.2,8), dpi=120)im = ax.imshow(para_seismic_data, extent=[0,300,400,0], cmap=plt.cm.seismic, vmin=-0.4, vmax=0.44)ax.set_xlabel('Position (km)', font21)ax.set_ylabel('Time (s)', font21)ax.set_xticks(np.linspace(0,300,5))ax.set_yticks(np.linspace(0,400,5))ax.set_xticklabels(labels=[0,0.75,1.5,2.25,3.0], size=21)ax.set_yticklabels(labels=[0.0,0.50,1.00,1.50,2.00], size=21)plt.rcParams['font.size']=14 # Set colorbar font sizedivider =make_axes_locatable(ax)cax = divider.append_axes("top", size="3%", pad=0.32)plt.colorbar(im, ax=ax, cax=cax, orientation='horizontal')plt.subplots_adjust(bottom=0.08, top=0.98, left=0.11, right=0.99)plt.show()
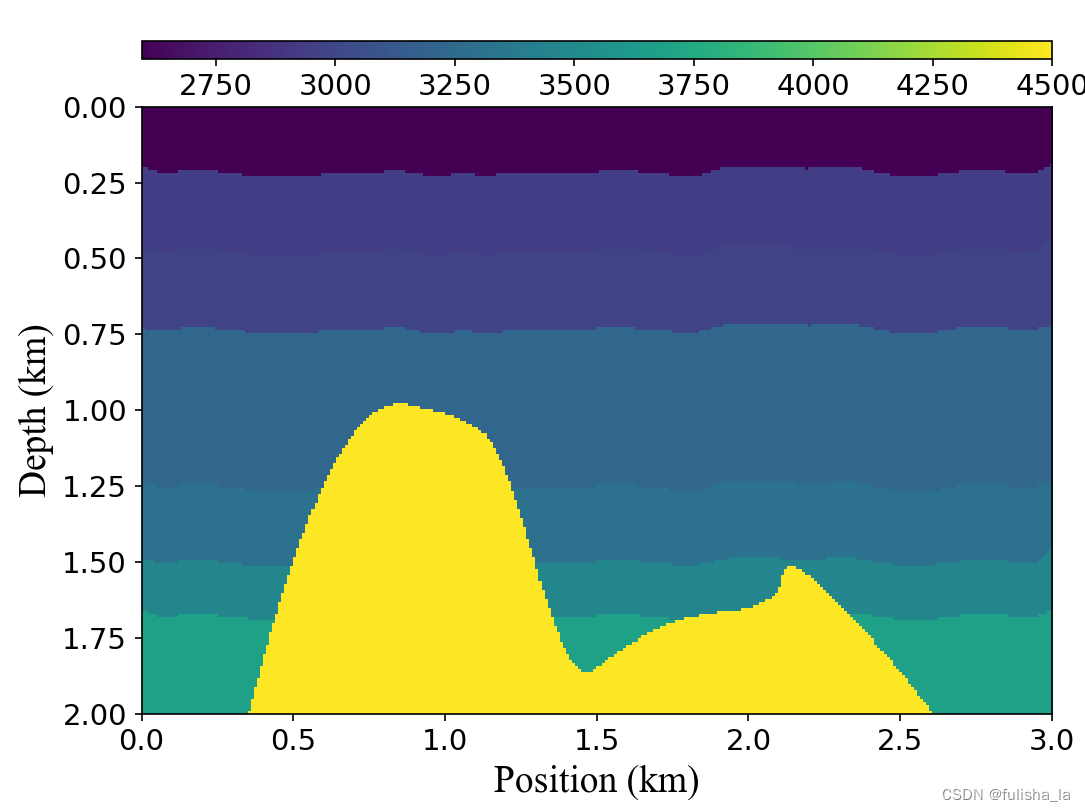
4. SEG盐模拟速度模型
def pain_seg_velocity_model(para_velocity_model):''':param para_velocity_model: Velocity model (200 x 301) (numpy):param min_velocity: Upper limit of velocity in the velocity model:param max_velocity: Lower limit of velocity in the velocity model:return:'''fig, ax = plt.subplots(figsize=(5.8,4.3), dpi=150)im = ax.imshow(para_velocity_model, extent=[0,3,2,0])ax.set_xlabel('Position (km)', font18)ax.set_ylabel('Depth (km)', font18)ax.tick_params(labelsize=14)plt.rcParams['font.size']=14 # Set colorbar font sizedivider =make_axes_locatable(ax)cax = divider.append_axes("top", size="3%", pad=0.32)plt.colorbar(im, ax=ax, cax=cax, orientation='horizontal')plt.subplots_adjust(bottom=0.12, top=0.95, left=0.11, right=0.99)plt.show()
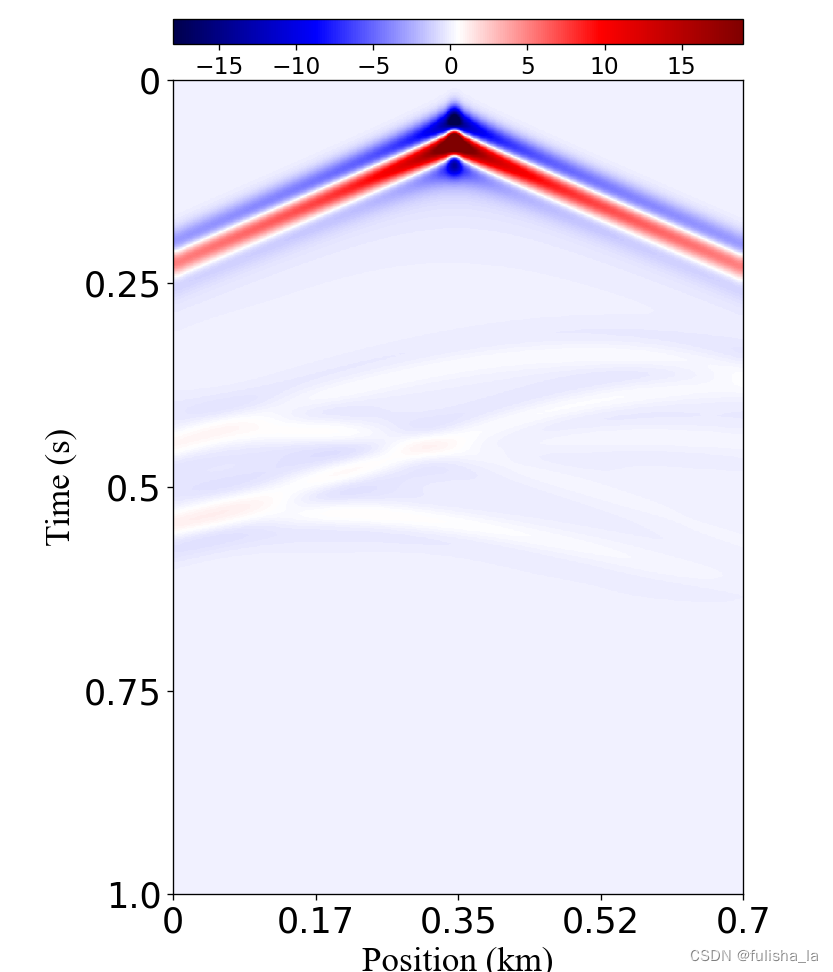
5. openfwi地震数据
def pain_openfwi_seismic_data(para_seismic_data):'''Plotting seismic data images of openfwi dataset:param para_seismic_data: Seismic data (1000 x 70) (numpy)'''data = cv2.resize(para_seismic_data, dsize=(400,301), interpolation=cv2.INTER_CUBIC)fig, ax = plt.subplots(figsize=(6.1,8), dpi=120)im = ax.imshow(data, extent=[0,0.7,1.0,0], cmap=plt.cm.seismic, vmin=-18, vmax=19)ax.set_xlabel('Position (km)', font21)ax.set_ylabel('Time (s)', font21)ax.set_xticks(np.linspace(0,0.7,5))ax.set_yticks(np.linspace(0,1.0,5))ax.set_xticklabels(labels=[0,0.17,0.35,0.52,0.7], size=21)ax.set_yticklabels(labels=[0,0.25,0.5,0.75,1.0], size=21)plt.rcParams['font.size']=14 # Set colorbar font sizedivider =make_axes_locatable(ax)cax = divider.append_axes("top", size="3%", pad=0.3)plt.colorbar(im, ax=ax, cax=cax, orientation='horizontal')plt.subplots_adjust(bottom=0.08, top=0.98, left=0.11, right=0.99)plt.show()
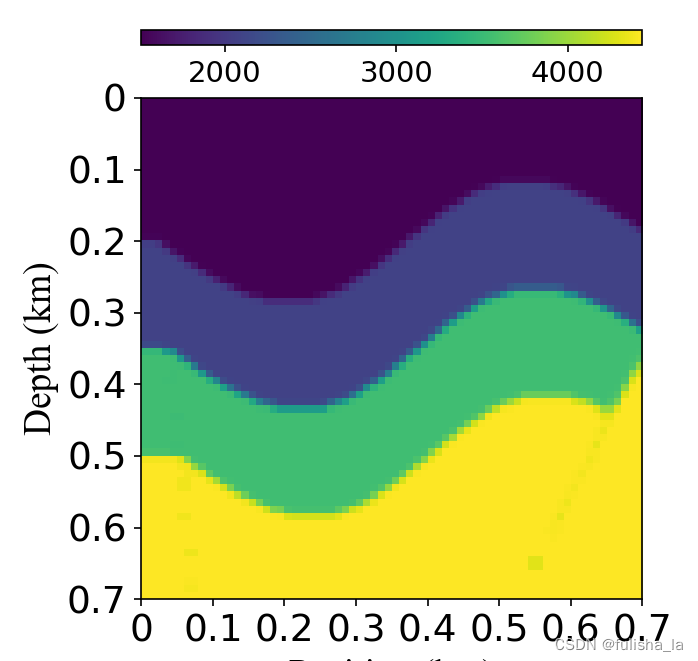
6. openfwi速度模型
def pain_openfwi_velocity_model(para_velocity_model):'''Plotting seismic data images of openfwi dataset:param para_velocity_model: Velocity model (70 x 70) (numpy):param min_velocity: Upper limit of velocity in the velocity model:param max_velocity: Lower limit of velocity in the velocity model:param is_colorbar: Whether to add a color bar (1 means add, 0 is the default, means don't add):return:'''fig, ax = plt.subplots(figsize=(5.8,6), dpi=150)im = ax.imshow(para_velocity_model, extent=[0,0.7,0.7,0])ax.set_xlabel('Position (km)', font18)ax.set_ylabel('Depth (km)', font18)ax.set_xticks(np.linspace(0,0.7,8))ax.set_yticks(np.linspace(0,0.7,8))ax.set_xticklabels(labels=[0,0.1,0.2,0.3,0.4,0.5,0.6,0.7], size=18)ax.set_yticklabels(labels=[0,0.1,0.2,0.3,0.4,0.5,0.6,0.7], size=18)plt.rcParams['font.size']=14 # Set colorbar font sizedivider =make_axes_locatable(ax)cax = divider.append_axes("top", size="3%", pad=0.35)plt.colorbar(im, ax=ax, cax=cax, orientation='horizontal')plt.subplots_adjust(bottom=0.10, top=0.95, left=0.13, right=0.95)plt.show()