Flutter-Charts_painter大数据量绘制性能优化-数据收敛
Flutter-Charts_painter大数据量绘制性能优化-数据收敛
1、背景介绍
HRV测量仪器上传的数据,每秒有250个数据,业务上需要测量180秒,预计有3w-5w个数据点需要绘制到折线图上去。Charts_painter绘制这么大的数据是时候会有些卡顿,所以需要进行性能优化。
优化方向有两个:1、缩减数据量 2、组件异步渲染。
Flutter暂时不支持异步离屏渲染,所以我们的只能进行数据量缩减
2、优化方式 - 数据收敛
方案:
- 每20个数据点收敛成两个,保留最大值和最小值两个数据点,这样数据就收敛了10倍,并且保留数据特征
- 需要判断20个数据点的走向趋势。通过最大值和最小值在原数据中的索引下标位置,确定谁在前谁在后
static List<double> handleBMData(List<double> source) {List<double> reslutList = [];List<double> partList = [];source.asMap().forEach((key, value) {partList.add(value);if ((key + 1) % 20 == 0) {double maxValue = partList.reduce(math.max);double minValue = partList.reduce(math.min);int maxIndex = partList.indexWhere((element) => element == maxValue);int minIndex = partList.indexWhere((element) => element == minValue);// int maxStep = math.min(maxIndex, 9 - maxIndex);// int minStep = math.min(minIndex, 9 - minIndex);// if (maxStep > minStep) {// reslutList.add(maxValue);// } else if (maxStep < minStep) {// reslutList.add(minValue);// } else {// if (maxIndex >= minIndex) {// reslutList.add(maxValue);// } else {// reslutList.add(minValue);// }// }if (maxIndex > minIndex) {reslutList.addAll([minValue, maxValue]);} else {reslutList.addAll([maxValue, minValue]);}partList = [];}});return reslutList;}
3、效果展示
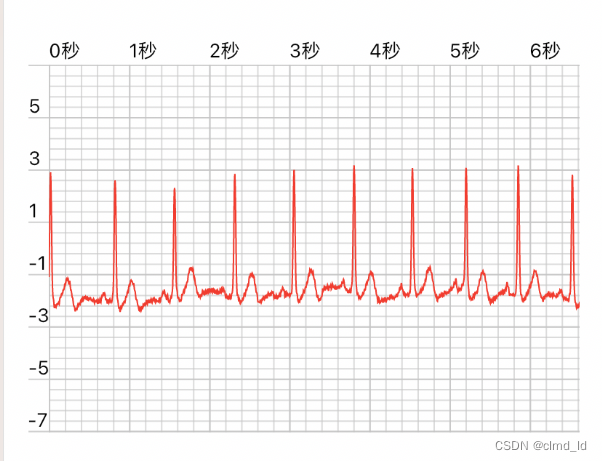
优化前,数据密集,折线抖动,GPU渲染压力大
优化后,数据分散,折线能有效反映数据特征,GPU渲染压力小
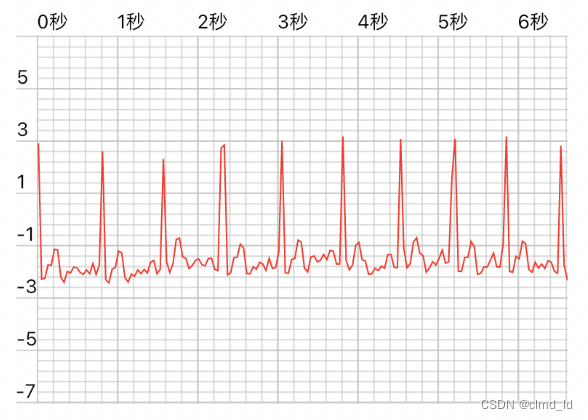
可见我们保留了原数据的数据特征,同时将数据下降了一个量级,让Charts_painter渲染性能直接指数级大幅提升
如果有码友能从异步渲染角度解决性能问题,欢迎探讨