vue-echarts实现多功能图表
前言
作为前端人员,日常图表、报表、地图的接触可谓相当频繁,今天小编隆重退出前端框架之VUE结合百度echart实现中国地图+各种图表的展示与使用;作为“你值得拥有”专栏阶段性末篇,值得一看
主要实现功能
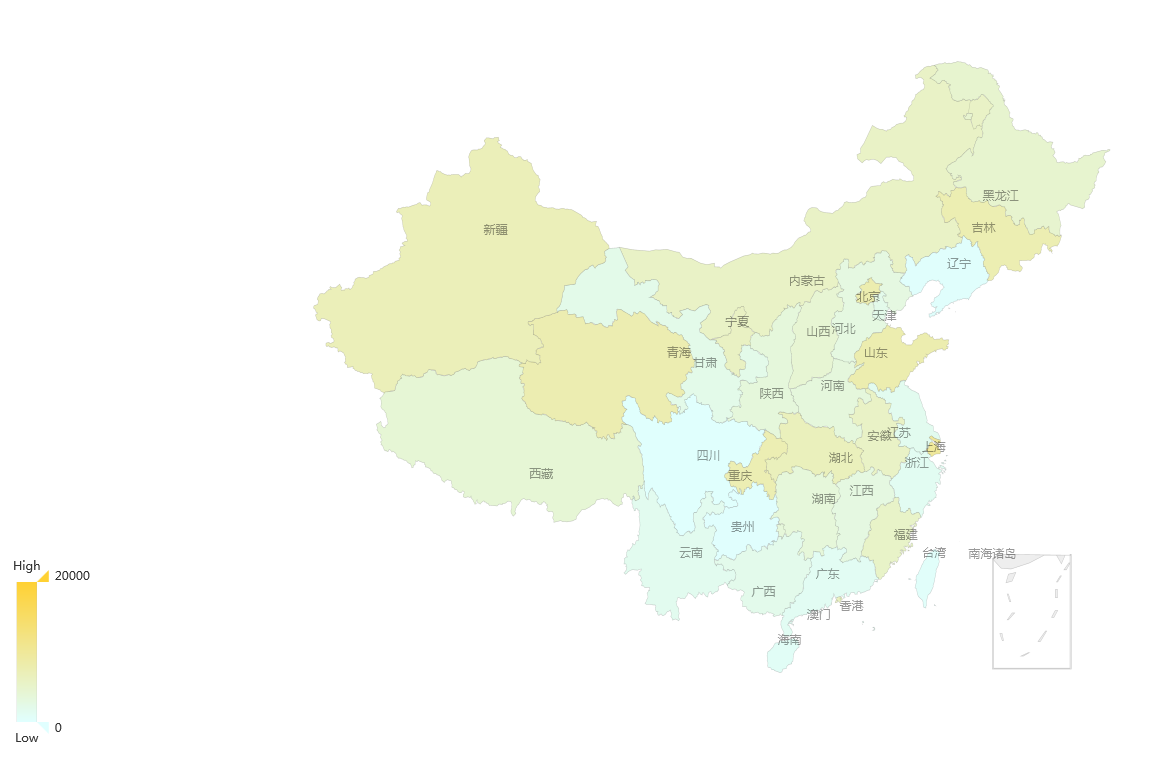
——中国地图
——环形图
——折线图
——柱形图
——复杂交互
——单选复选
环境搭建
初始化环境参考:利用vue-cli搭建vue项目框架
项目部署
build project:
npm install
npm run build
npm run dev
访问地址:
http://localhost:8895/#/dashboard
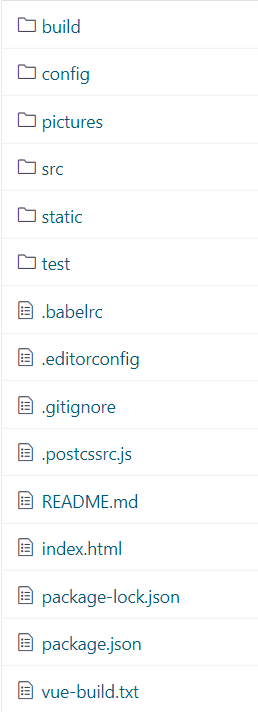
项目结构
项目代码
dashboard.vue-主界面
<script>
import pie from 'com/pie/pie'
import line from 'com/line/line'
import multipleColumn from 'com/multipleColumn/multipleColumn'
import point from 'com/point/point'export default {data() {return {items: []}},mounted() {this.init()},methods: {oresize() {this.$root.charts.forEach((myChart) => {myChart.resize()})},init() {this.items = document.querySelectorAll('.flex-container .item')for (let i = 0; i < this.items.length; i++) {this.items[i].dataset.order = i + 1;}},clickChart(clickIndex) {let activeItem = document.querySelector('.flex-container .active')let activeIndex = activeItem.dataset.orderlet clickItem = this.items[clickIndex - 1]if (activeIndex === clickIndex) {return}activeItem.classList.remove('active')clickItem.classList.add('active')this._setStyle(clickItem, activeItem)},_setStyle(el1, el2) {let transform1 = el1.style.transformlet transform2 = el2.style.transformel1.style.transform = transform2el2.style.transform = transform1}},components: {multipleColumn,point,'v-line': line,pie: pie}
}</script>
multipleColumn.vue-复合柱形图
<script>
import filter from 'com/filter/filter'
import echarts from 'echarts'
import china from 'echarts/map/js/china'
import world from 'echarts/map/js/world'
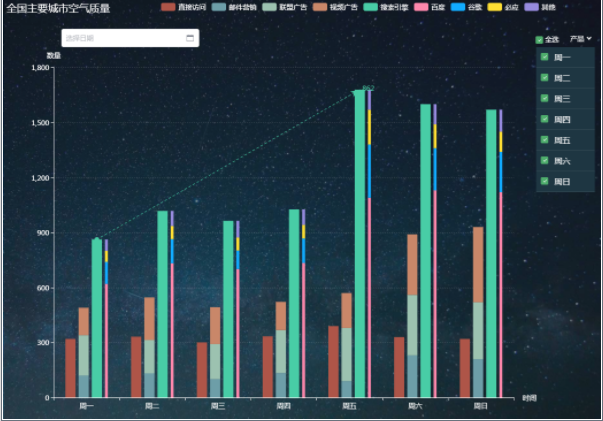
import http from 'js/http'export default {data() {return {mcChart: {},options2: {shortcuts: [{text: '最近一周',value () {const end = new Date();const start = new Date();start.setTime(start.getTime() - 3600 * 1000 * 24 * 7);return [start, end];},onClick: (picker) => {}},{text: '最近一个月',value () {const end = new Date();const start = new Date();start.setTime(start.getTime() - 3600 * 1000 * 24 * 30);return [start, end];},onClick: (picker) => {}},{text: '最近三个月',value () {const end = new Date();const start = new Date();start.setTime(start.getTime() - 3600 * 1000 * 24 * 90);return [start, end];},onClick: (picker) => {}}]},value2: '',startTime: '',endTime: '',}},methods: {_mcCharts() {var dom = document.querySelector('.multipleColumn .main')this.mcChart = echarts.init(dom);var app = {}, option = null;app.title = '堆叠柱状图';option = {title: {text: '全国主要城市空气质量',left: 'left',textStyle: {color: '#fff',fontWeight: 300,}},tooltip : {trigger: 'axis',axisPointer : { // 坐标轴指示器,坐标轴触发有效type : 'shadow' // 默认为直线,可选为:'line' | 'shadow'}},color: ['#AE5548', '#6D9EA8', '#9CC2B0', '#C98769', '#48cda6','#fd87ab','#11abff','#ffdf33','#968ade'],legend: {data:['直接访问','邮件营销','联盟广告','视频广告','搜索引擎','百度','谷歌','必应','其他'],x: 'right',textStyle: {// legend字体颜色color: '#fff'}},grid: {left: '5%',right: '8%',top: '16%',bottom: '3%',containLabel: true},xAxis : [{name: '时间',type : 'category',data : ['周一','周二','周三','周四','周五','周六','周日'],axisLine:{lineStyle:{color: '#fff',type:'solid' //'dotted'虚线 'solid'实线} }}],yAxis : [{name: '数量',type : 'value',splitLine: {lineStyle: {color: ['rgba(230, 230, 230, 0.2)'],type:'dotted' //'dotted'虚线 'solid'实线}},axisLine: {lineStyle:{color: '#fff',type:'solid' //'dotted'虚线 'solid'实线} }}],series : [{name:'直接访问',type:'bar',data:[320, 332, 301, 334, 390, 330, 320]},{name:'邮件营销',type:'bar',stack: '广告',data:[120, 132, 101, 134, 90, 230, 210]},{name:'联盟广告',type:'bar',stack: '广告',data:[220, 182, 191, 234, 290, 330, 310]},{name:'视频广告',type:'bar',stack: '广告',data:[150, 232, 201, 154, 190, 330, 410]},{name:'搜索引擎',type:'bar',data:[862, 1018, 964, 1026, 1679, 1600, 1570],markLine : {lineStyle: {normal: {type: 'dashed'}},data : [[{type : 'min'}, {type : 'max'}]]}},{name:'百度',type:'bar',barWidth : 5,stack: '搜索引擎',data:[620, 732, 701, 734, 1090, 1130, 1120]},{name:'谷歌',type:'bar',stack: '搜索引擎',data:[120, 132, 101, 134, 290, 230, 220]},{name:'必应',type:'bar',stack: '搜索引擎',data:[60, 72, 71, 74, 190, 130, 110]},{name:'其他',type:'bar',stack: '搜索引擎',data:[62, 82, 91, 84, 109, 110, 120]}]};if (option && typeof option === "object") {this.mcChart.setOption(option, true);};// 绑定点击事件this.mcChart.on('click', function (params) {console.log(params)})},// 时间插件onChangeDate(date) { // daterange改变的时候触发的事件 默认接收一个date对象this.startTime = date[0];this.endTime = date[1];},// 时间插件okChange() { // 点击确定按钮触发的事件var params = {startTime: this.startTime, endTime: this.endTime}if( params.startTime === '' || params.endTime=== '') {this.$Message.info('请选择日期范围');return} else {this._showPoint(params)}},// 时间插件onClear() {console.log('今日实况')},},mounted: function() {this._mcCharts()window.addEventListener('resize', function() { // 第一步:main中添加style="100%",第二步:添加.bind(this)this.mcChart.resize()}.bind(this));},components: {'v-filter': filter}}
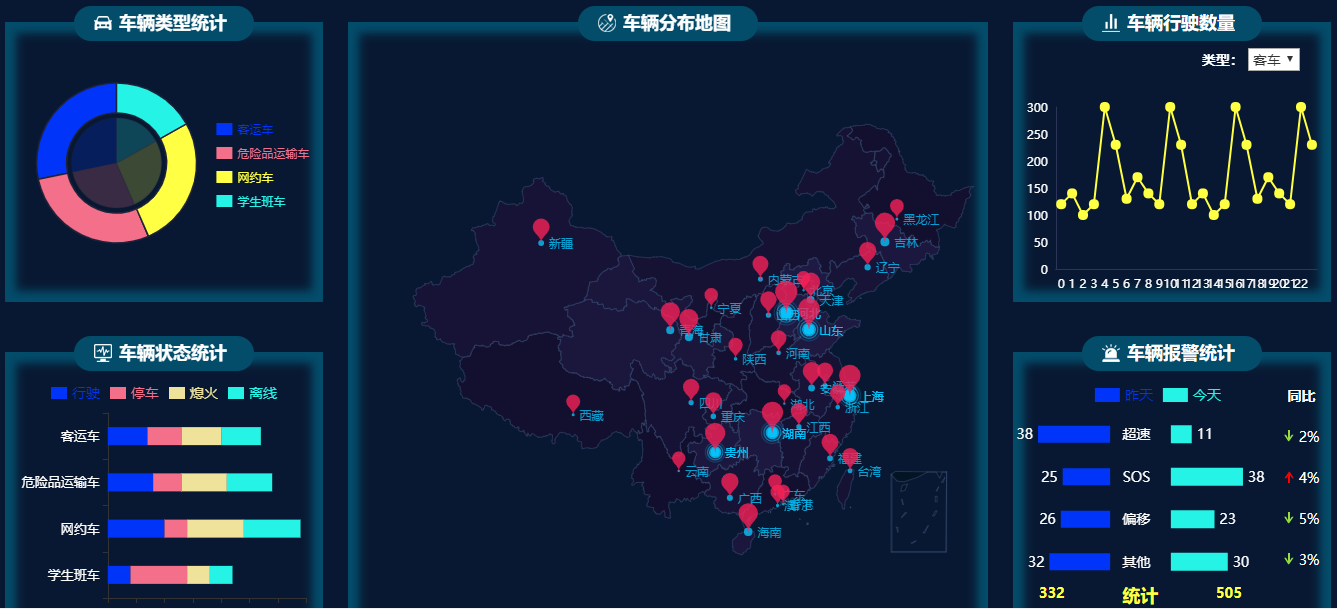
</script>项目截图

地图功能

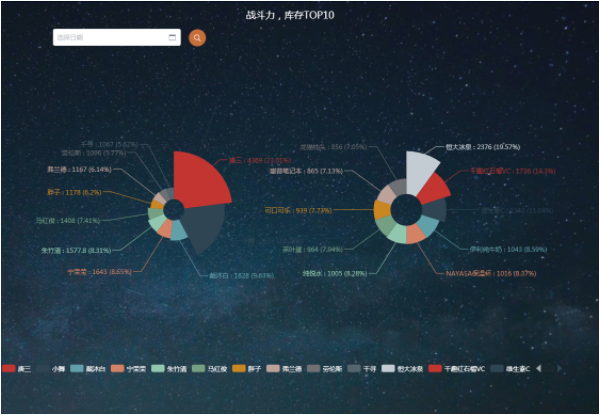
饼图功能+单选复选
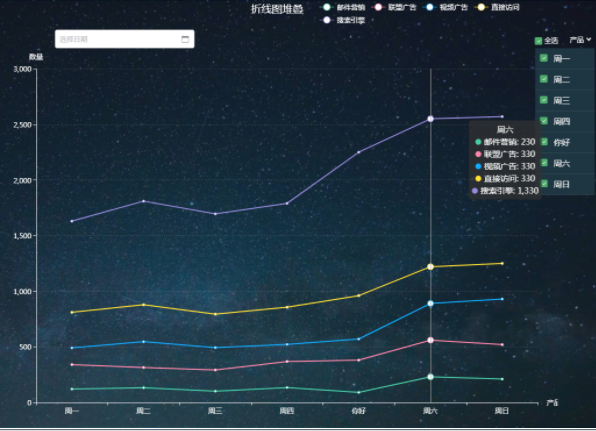
复杂折线图+单选复选
复杂柱状图+单选复选
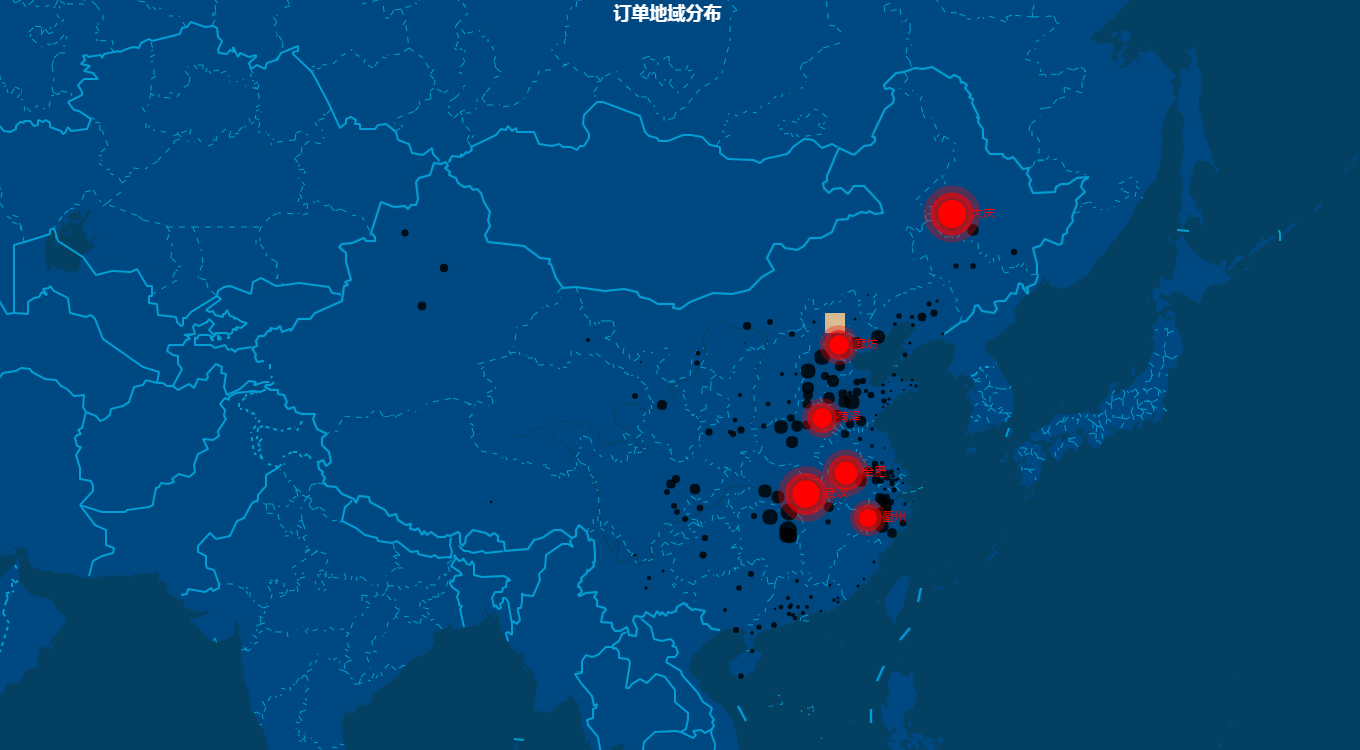
百度地图api实现跳点
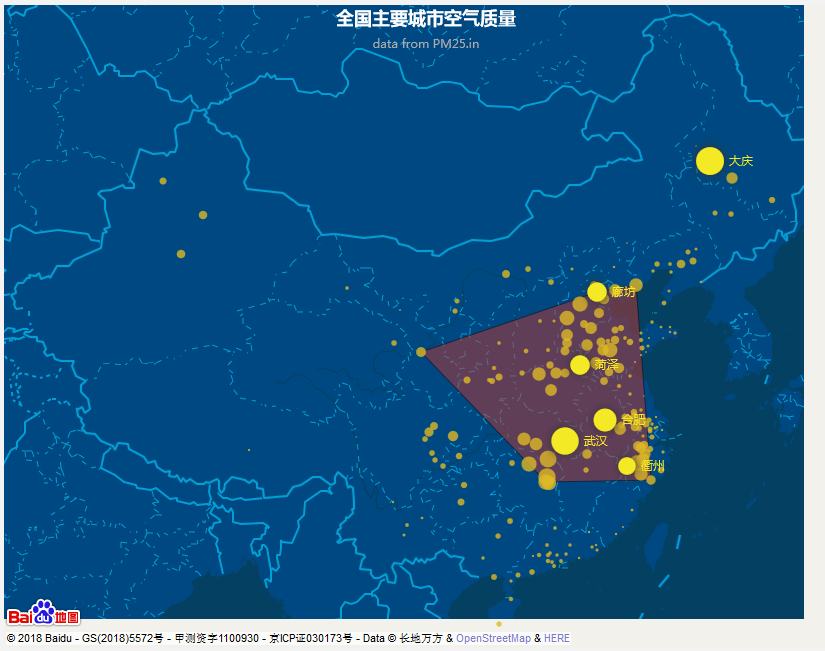

大屏展示
相关源码
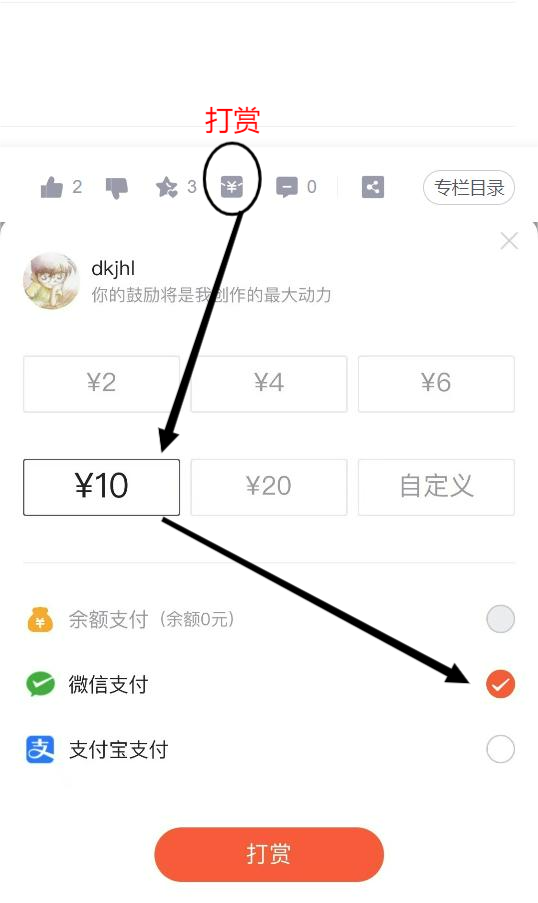
(9.99元——打赏后评论或者备注留言,例如:”已支持,your_email@xxx.com,echart”)
一年365天,希望各位看官达人多多支持,打赏后将及时发送源码
操作如下