QT实现固高运动控制卡示波器
目录
一、固高示波器
二、基于QCustomPlot实现示波器
三、完整源码
一、固高示波器
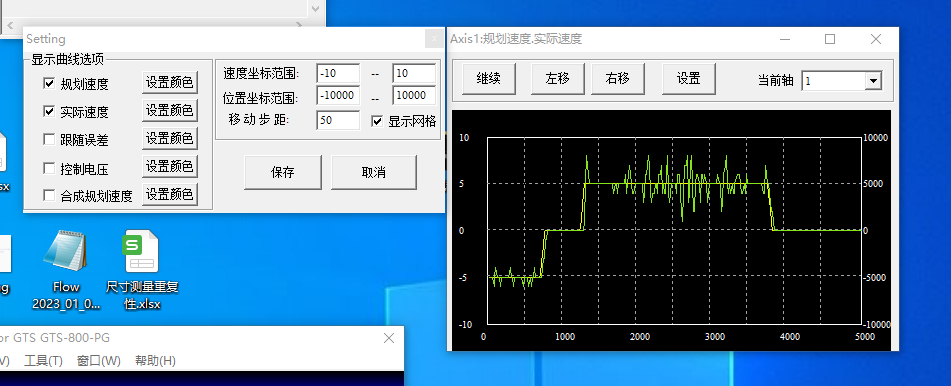
固高运动控制卡自带的软件有一个示波器功能,可以实时显示速度的波形,可辅助分析电机的运行状态。但是我们基于sdk开发了自己的软件,无法再使用该功能,原因是2个软件不能同时与控制卡通信,故此需要我们自己再开发一个示波器。
固高示波器功能展示,功能包括多条曲线的显示、继续/暂停、左移、右移、设置、轴选择等。
二、基于QCustomPlot实现示波器
GCustomPlot简介与使用看官网就可以了
简介, Qt Plotting Widget QCustomPlot - Introduction
下载, Qt Plotting Widget QCustomPlot - Download
需要注意的是需要在pro文件中加入printsuppot模块,源码中使用该模块做pdf打印功能
QT += printsupport参考固高的功能实现速度示波器效果如下

QCustomPlot初始化设置
m_customPlot = new QCustomPlot(this);m_customPlot->setObjectName(QLatin1String("customPlot"));ui->vlyPlot->addWidget(m_customPlot);m_customPlot->setBackground(QBrush(QColor("#474848")));m_customPlot->setInteractions(QCP::iRangeDrag | QCP::iRangeZoom |QCP::iSelectPlottables); /* 可拖拽+可滚轮缩放 */m_customPlot->legend->setVisible(true);添加两条曲线图,addGraph
m_customPlot->addGraph();m_customPlot->graph(0)->setPen(QPen(Qt::green, 3));m_customPlot->graph(0)->setName(QStringLiteral("实际速度"));m_customPlot->addGraph();m_customPlot->graph(1)->setPen(QPen(Qt::yellow, 3));m_customPlot->graph(1)->setName(QStringLiteral("规划速度"));左右移动,通过设置X轴的范围来改变,再使用replot函数更新视图
m_customPlot->xAxis->setRange(m_customPlot->xAxis->range().lower - ui->spbStep->value(),m_customPlot->xAxis->range().upper - ui->spbStep->value());m_customPlot->replot();网格线显示与隐藏
m_customPlot->xAxis->grid()->setVisible(checked);m_customPlot->yAxis->grid()->setVisible(checked);m_customPlot->replot();添加数据,示波器有向左自动滚动的效果,也是通过设置范围来实现
void OscilloscopeFrame::addData(double key, double actVel, double prfVel)
{m_customPlot->graph(0)->addData(key, actVel);m_customPlot->graph(1)->addData(key, prfVel);m_customPlot->xAxis->rescale();m_customPlot->graph(0)->rescaleValueAxis(false, true);m_customPlot->graph(1)->rescaleValueAxis(false, true);m_customPlot->xAxis->setRange(m_customPlot->xAxis->range().upper,m_fixedLength, Qt::AlignRight);m_customPlot->replot(QCustomPlot::rpQueuedReplot);  /* 实现重绘 */
}
实时显示数据,通过定时器实现
m_timer = new QTimer();connect(m_timer, &QTimer::timeout, updateData);m_timer->start(OSCILLOSCOPE_UPDATE_MSEC);鼠标放在曲线上显示当前值,关联鼠标移动信号,映射坐标pixelToCoord
connect(m_customPlot, SIGNAL(mouseMove(QMouseEvent *)), this,SLOT(plotMouseMoveEvent(QMouseEvent *)));void OscilloscopeFrame::plotMouseMoveEvent(QMouseEvent *event)
{if ( Qt::ControlModifier == event->modifiers()){int x_pos = event->pos().x();int x_val = m_customPlot->xAxis->pixelToCoord(x_pos);float y = m_customPlot->graph(0)->data()->at(x_val)->value;QString strToolTip = QString("%1,%2").arg(x_val).arg(y);QToolTip::showText(cursor().pos(), strToolTip, m_customPlot);}
}三、完整源码
OscilloscopeFrame.h
#ifndef OSCILLOSCOPEFRAME_H
#define OSCILLOSCOPEFRAME_H#include <QFrame>
#include "oscilloscopelib_global.h"namespace Ui
{class OscilloscopeFrame;
}class QCustomPlot;class AbstractRobot;class OSCILLOSCOPELIBSHARED_EXPORT OscilloscopeFrame : public QFrame
{Q_OBJECTpublic:explicit OscilloscopeFrame(QWidget *parent = 0);~OscilloscopeFrame();void setFixedLength(double length);void addData(double key, double actVel, double prfVel);void installController(AbstractRobot *controller);private slots:void plotMouseMoveEvent(QMouseEvent *event);private:Ui::OscilloscopeFrame *ui;QCustomPlot *m_customPlot = nullptr;QTimer *m_timer = nullptr;double m_fixedLength;AbstractRobot *m_controller = nullptr;double m_actPos = 0;double m_count = 0;
};#endif // OSCILLOSCOPEFRAME_H
OscilloscopeFrame.cpp
#include "OscilloscopeFrame.h"
#include "qcustomplot.h"
#include "ui_OscilloscopeFrame.h"
#include <QtMath>
#include <QDebug>
#include <device/AbstractRobot.h>#define OSCILLOSCOPE_UPDATE_MSEC  60OscilloscopeFrame::OscilloscopeFrame(QWidget *parent) :QFrame(parent),ui(new Ui::OscilloscopeFrame)
{ui->setupUi(this);ui->spbStep->setValue(1);for(int i = 1; i <= 8; ++i){ui->cmbAxisId->addItem(QString::number(i));}m_customPlot = new QCustomPlot(this);m_customPlot->setObjectName(QLatin1String("customPlot"));ui->vlyPlot->addWidget(m_customPlot);m_customPlot->setBackground(QBrush(QColor("#474848")));m_customPlot->setInteractions(QCP::iRangeDrag | QCP::iRangeZoom |QCP::iSelectPlottables);  /* 可拖拽+可滚轮缩放 */m_customPlot->legend->setVisible(true);m_customPlot->addGraph();m_customPlot->graph(0)->setPen(QPen(Qt::green, 3));m_customPlot->graph(0)->setName(QStringLiteral("实际速度"));m_customPlot->addGraph();m_customPlot->graph(1)->setPen(QPen(Qt::yellow, 3));m_customPlot->graph(1)->setName(QStringLiteral("规划速度"));m_customPlot->axisRect()->setupFullAxesBox();m_customPlot->yAxis->setRange(0, 3.3);ui->btnPause2Continue->setCheckable(true);setFixedLength(100);/* 暂停/继续 */connect(ui->btnPause2Continue, &QPushButton::clicked, this, [ = ](){if(!m_timer){return;}bool isCheckable = ui->btnPause2Continue->isCheckable();if(isCheckable){m_timer->stop();ui->btnPause2Continue->setText(QStringLiteral("继续"));}else{m_timer->start(OSCILLOSCOPE_UPDATE_MSEC);ui->btnPause2Continue->setText(QStringLiteral("暂停"));}ui->btnPause2Continue->setCheckable(!isCheckable);});/* 左移 */connect(ui->btnLeftMove, &QPushButton::clicked, this, [ = ](){m_customPlot->xAxis->setRange(m_customPlot->xAxis->range().lower - ui->spbStep->value(),m_customPlot->xAxis->range().upper - ui->spbStep->value());m_customPlot->replot();});/* 右移 */connect(ui->btnRightMove, &QPushButton::clicked, this, [ = ](){m_customPlot->xAxis->setRange(m_customPlot->xAxis->range().lower  + ui->spbStep->value(),m_customPlot->xAxis->range().upper  + ui->spbStep->value());m_customPlot->replot();});/* 显示表格 */connect(ui->chkGrid, &QCheckBox::toggled, this, [ = ](bool checked){m_customPlot->xAxis->grid()->setVisible(checked);m_customPlot->yAxis->grid()->setVisible(checked);m_customPlot->replot();});auto updateData = [ & ](){if(m_controller){int axis = ui->cmbAxisId->currentText().toInt();T_AxisStatus status;int ec = m_controller->readAxisStatus(axis, &status);if(0 == ec){ui->lblActVel->setText(QString::number(status.dEncVel));ui->lblPrfVel->setText(QString::number(status.dPrfVel));ui->lblActPos->setText(QString::number(status.dEncPos));ui->lblPrfPos->setText(QString::number(status.dPrfPos));if(m_actPos != status.dEncPos){m_actPos = status.dEncPos;addData(m_count, status.dEncVel, status.dPrfVel);m_count ++;}}else{ui->lblActVel->setText("error " + QString::number(ec));ui->lblPrfVel->setText("error " + QString::number(ec));ui->lblActPos->setText("error " + QString::number(ec));ui->lblPrfPos->setText("error " + QString::number(ec));}}};m_timer = new QTimer();connect(m_timer, &QTimer::timeout, updateData);m_timer->start(OSCILLOSCOPE_UPDATE_MSEC);connect(m_customPlot, SIGNAL(mouseMove(QMouseEvent *)), this,SLOT(plotMouseMoveEvent(QMouseEvent *)));for(int i = 0; i < 500; i++){double x = qDegreesToRadians((double)i);addData(i, sin(x), cos(x));}
}OscilloscopeFrame::~OscilloscopeFrame()
{m_timer->stop();delete m_timer;m_timer = nullptr;delete ui;
}void OscilloscopeFrame::setFixedLength(double length)
{/* 显示固定长度 */m_fixedLength = length;
}void OscilloscopeFrame::addData(double key, double actVel, double prfVel)
{m_customPlot->graph(0)->addData(key, actVel);m_customPlot->graph(1)->addData(key, prfVel);m_customPlot->xAxis->rescale();m_customPlot->graph(0)->rescaleValueAxis(false, true);m_customPlot->graph(1)->rescaleValueAxis(false, true);m_customPlot->xAxis->setRange(m_customPlot->xAxis->range().upper,m_fixedLength, Qt::AlignRight);m_customPlot->replot(QCustomPlot::rpQueuedReplot);  /* 实现重绘 */
}void OscilloscopeFrame::installController(AbstractRobot *controller)
{m_controller = controller;
}void OscilloscopeFrame::plotMouseMoveEvent(QMouseEvent *event)
{if ( Qt::ControlModifier == event->modifiers()){int x_pos = event->pos().x();int x_val = m_customPlot->xAxis->pixelToCoord(x_pos);float y = m_customPlot->graph(0)->data()->at(x_val)->value;QString strToolTip = QString("%1,%2").arg(x_val).arg(y);QToolTip::showText(cursor().pos(), strToolTip, m_customPlot);}
}