linux相关操作
1 系统调用
通过strace直接看程序运行过程中的系统调用情况
 其中每一行为一个systemcall ,调用write系统调用将内容最终输出。

无论什么编程语言都必须通过系统调用向内核发起请求。
sar查看进程分别在用户模式和内核模式下的运行时间占比情况,
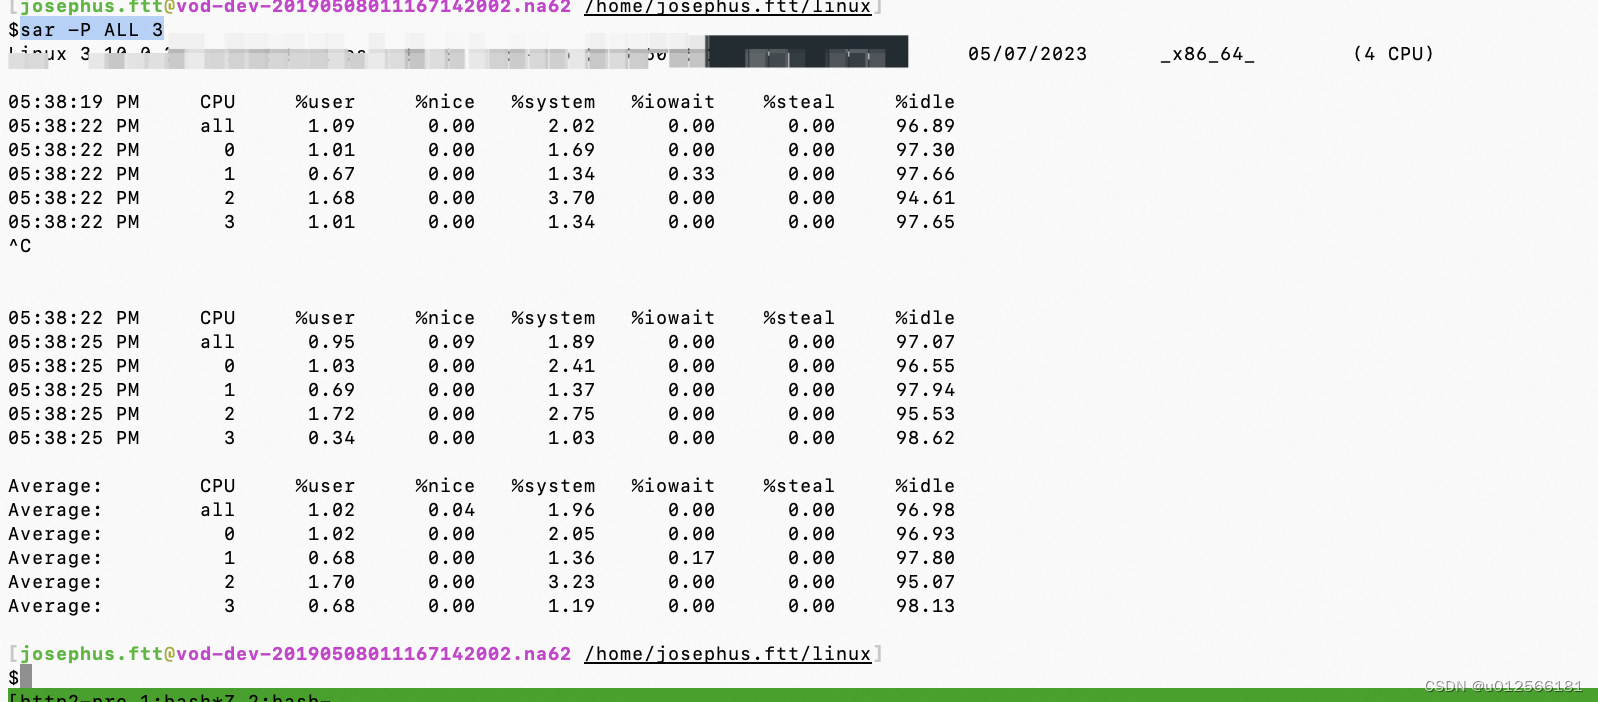 ALL显示全部的核。3表示每3s刷新一次。
user+nice是用户模式下的时间占比(区别见下面),system表示内核模式下的运行时间占比。
例子:运行一个不发任何系统调用单纯循环的程序通过sar观察它在各个模式下的占比情况
int main(void) {for (;;) {;}
}

可以看到在采集信息的这1s中用户进程loop始终运行在核1上。
然后尝试进行系统调用:
#include <sys/types.h>
#include <unistd.h>int main(void) {for (;;) {getppid();}
}
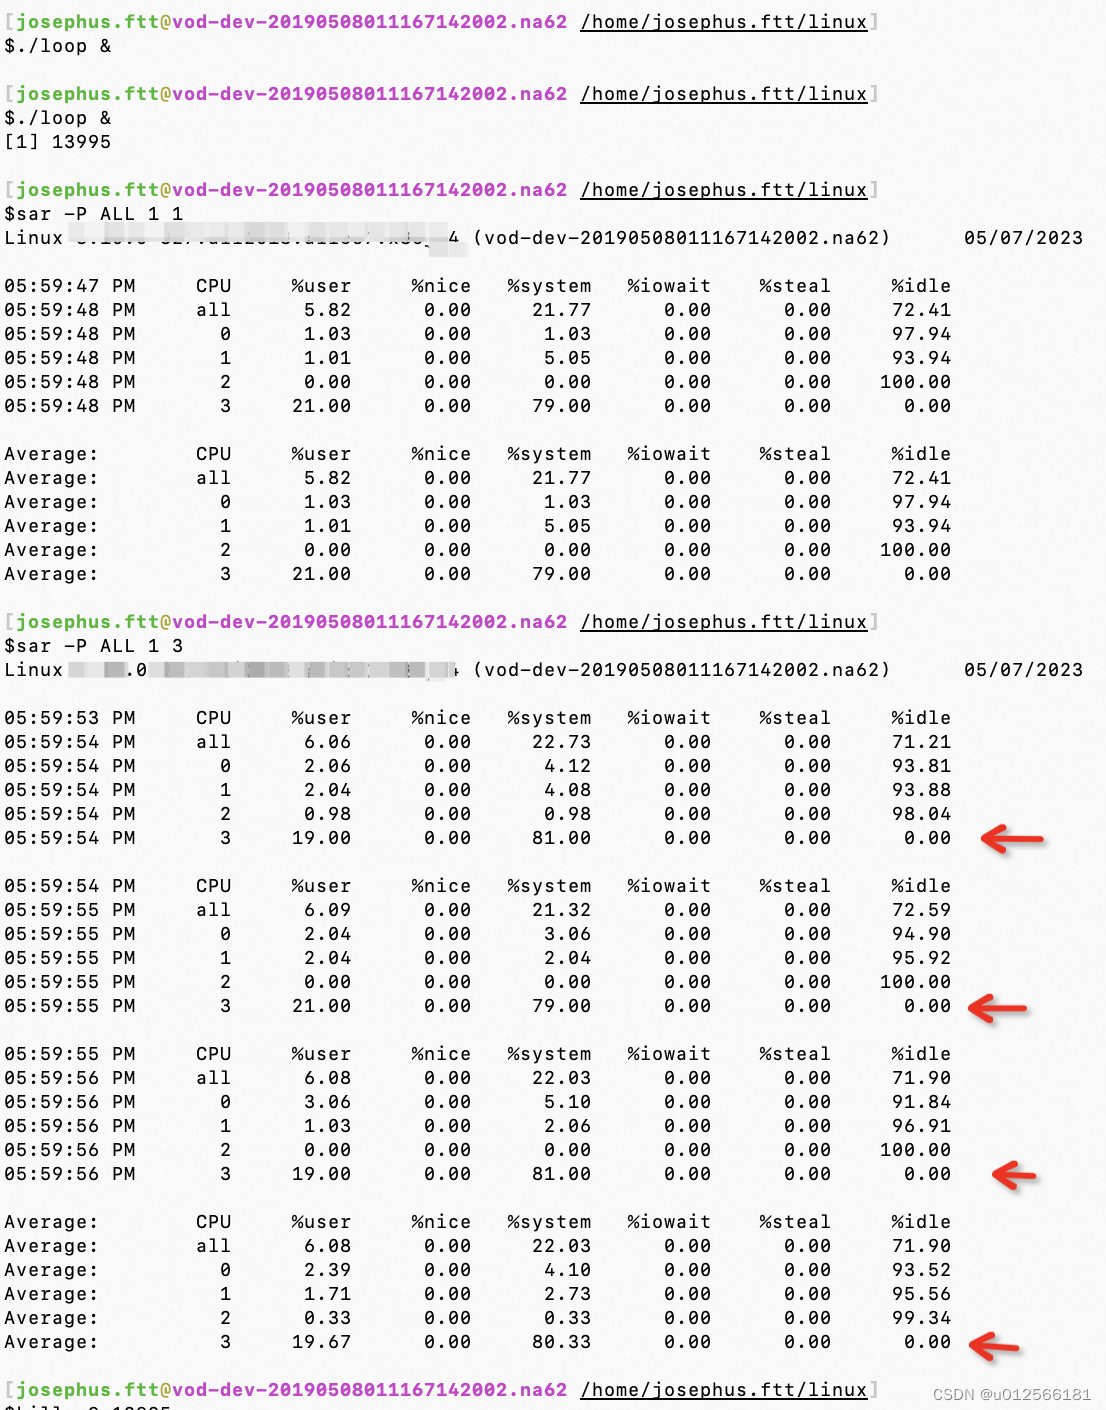
进程始终泡在核3上,用户太占比20%内核态占比80%,为何system不是100%?因为用于循环执行main函数内的getppid的循环处理也需要有运行时间,属于进程自身在用户太的运行。
虽然不能一概而论但当system高达几十时,大多是陷入了系统调用过多或者系统负载过高引起的。通过-T可以衡量每个系统调用的耗时。
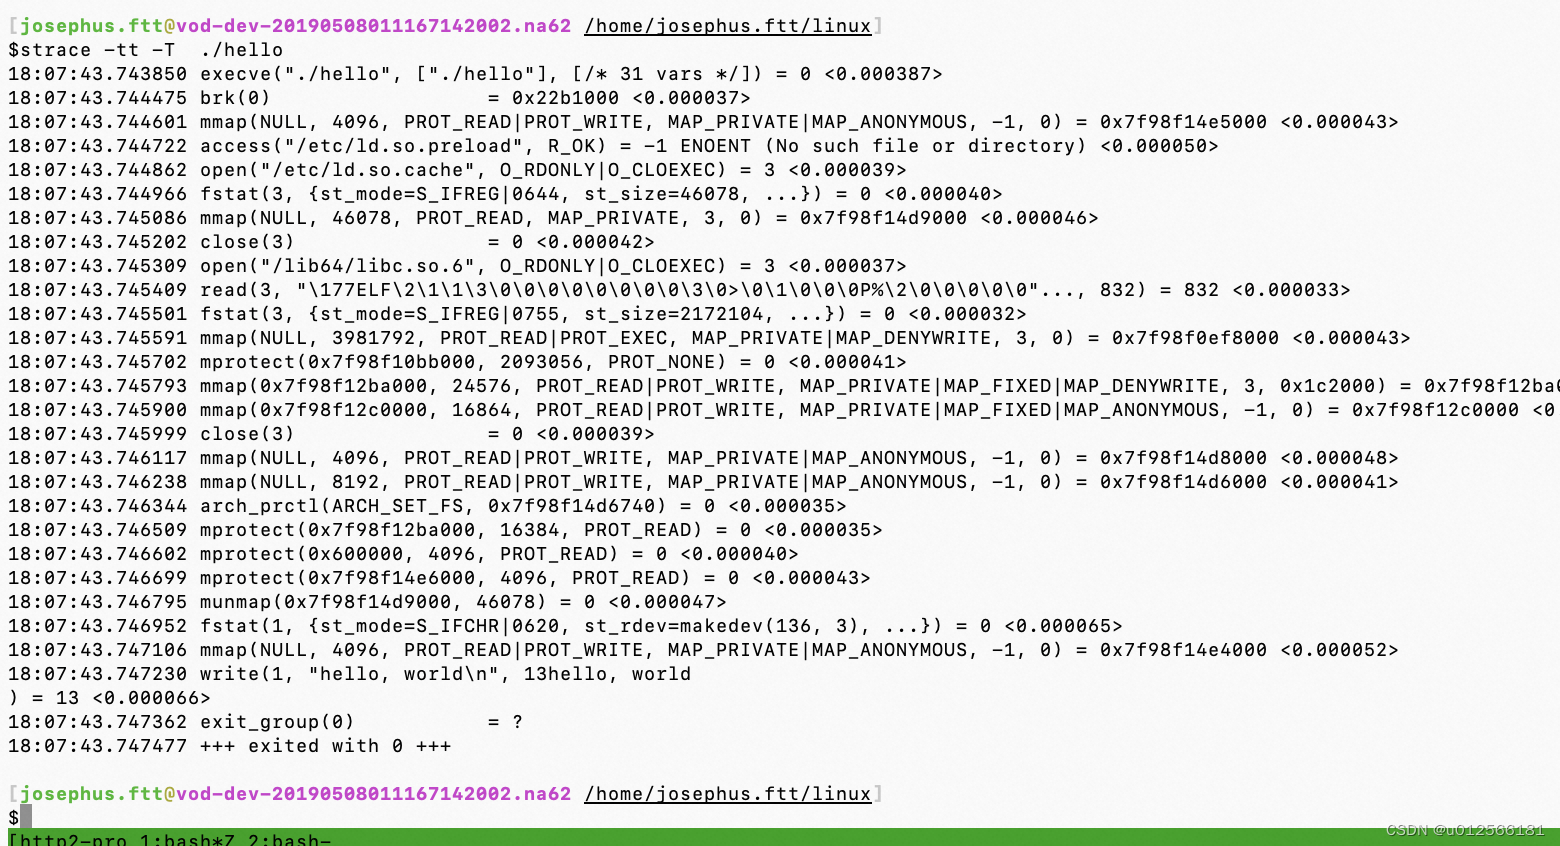
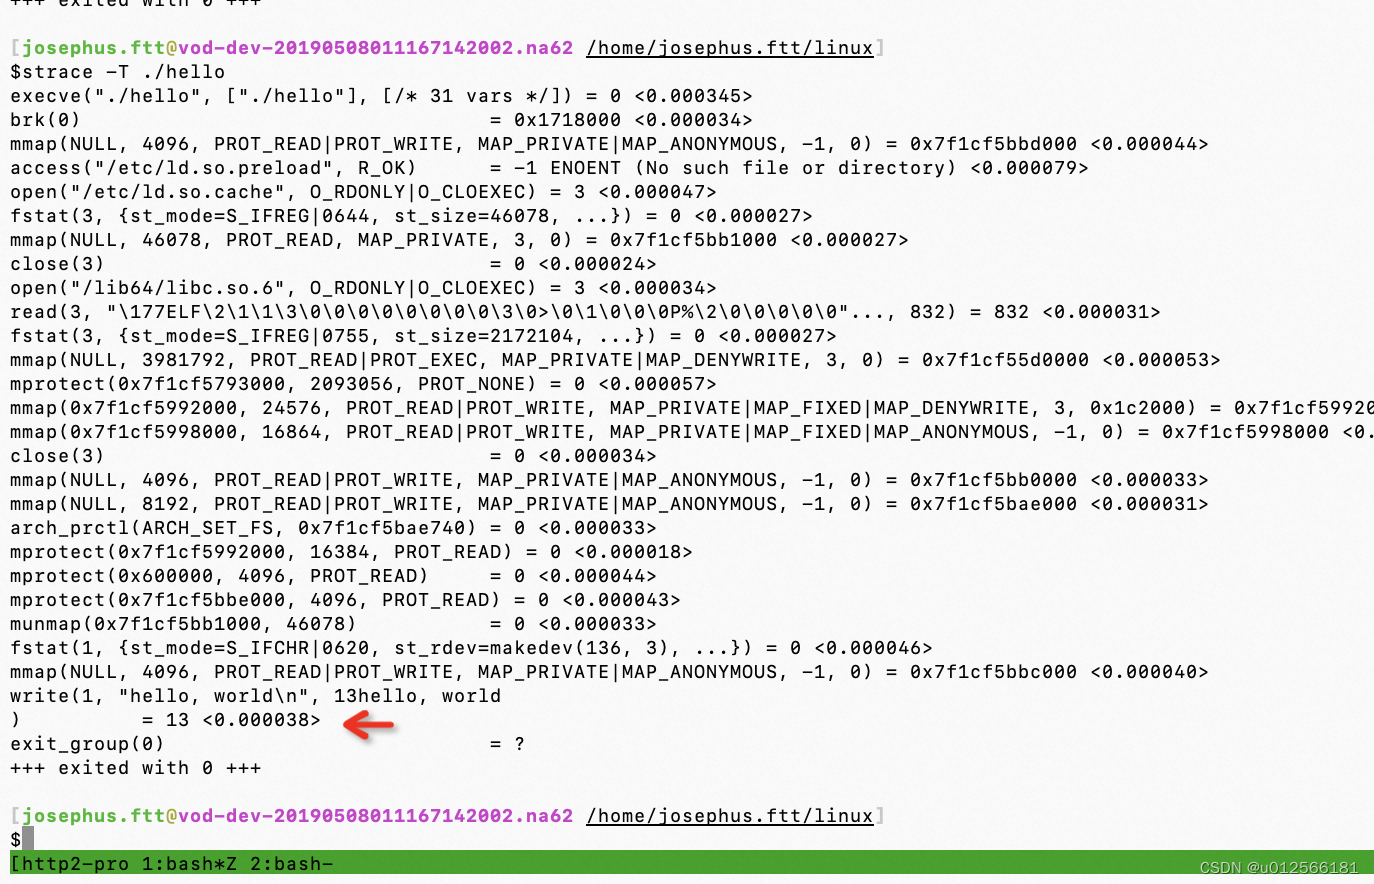 看到执行write系统调用消耗38微秒。此外加上-tt能显示发生的时刻:
需要注意的是,与常规的函数调用不同,系统调用不能被C语言之类的高级编程语言代码直接发起,而只能通过与系统架构紧密相连的汇编语言代码发起,例如在x86架构下 如下发起getppid系统调用:
mov $0x6e .%eax
syscall
(其实是通过将系统调用号传入,然后通过软中断80发起)
可以看到如果没有os的帮助程序员不得不根据系统架构图为每个系统调用编写对应的汇编语言然后再从高级语言中调用这些代码。这样一样时间增加了而且也无法移植到别的架构。
为了解决这一的问题 os提供了一系列被称为系统调用的包装函数的函数,用于在系统内部发起系统调用。各种架构都存在着对应的包装函数。而最为常见的就是C标准库。glibc(GUN项目提供的glibc作为c标准库使用)
所以用C语言编写的几乎所有程序都依赖glibc库。
可以通过ldd命令查看程序所依赖的库:
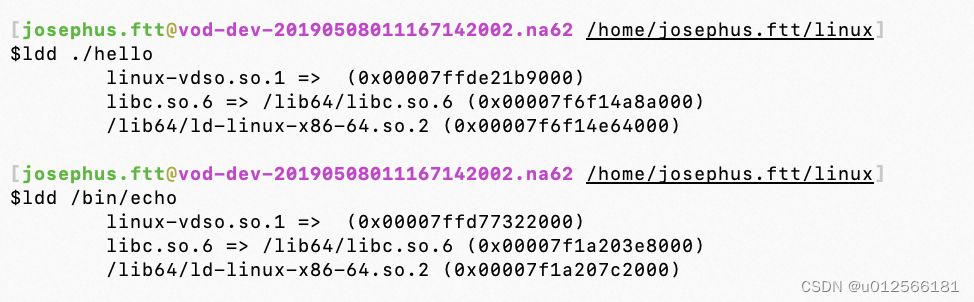
libc.so就是C标准库
而且python类似的语言 也依赖于libc
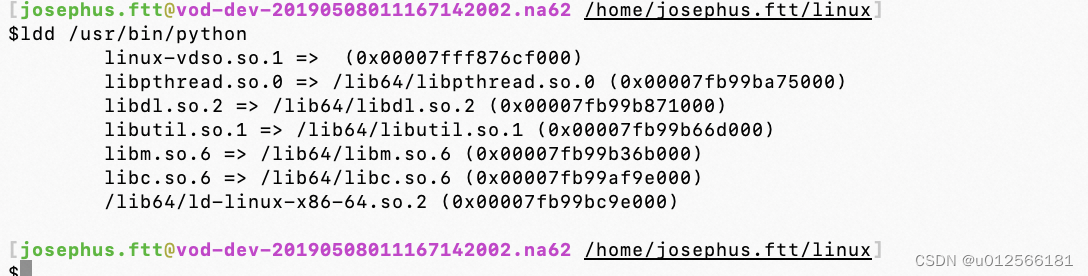
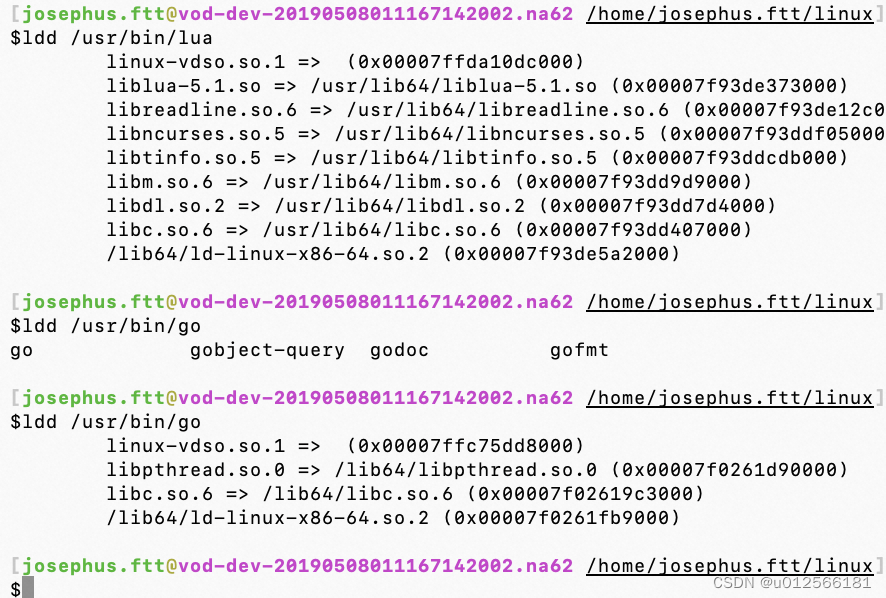
可以说在OS层面C语言依然发挥着巨大作用是一种不可或缺的语言。系统上的其他程序大部分也依赖libc库。
进程的调度实验
$cat sched.c
#include <sys/types.h>
#include <sys/wait.h>
#include <time.h>
#include <unistd.h>
#include <stdio.h>
#include <stdlib.h>
#include <string.h>
#include <err.h>#define NLOOP_FOR_ESTIMATION 1000000000UL
#define NSECS_PER_MSEC       1000000UL
#define NSECS_PER_SEC        1000000000ULstatic inline long diff_nsec(struct timespec before, struct timespec after)
{return ((after.tv_sec * NSECS_PER_SEC + after.tv_nsec) - (before.tv_sec * NSECS_PER_SEC + before.tv_nsec));
}static unsigned long loops_per_msec()
{struct timespec before, after;;clock_gettime(CLOCK_MONOTONIC, &before);unsigned long i;for (i = 0; i < NLOOP_FOR_ESTIMATION; i++);clock_gettime(CLOCK_MONOTONIC, &after);int ret;return NLOOP_FOR_ESTIMATION * NSECS_PER_MSEC / diff_nsec(before, after);
}static inline void load(unsigned long nloop)
{unsigned long i;for (i = 0; i < nloop; i++);
}static void child_fn(int id, struct timespec *buf, int nrecord, unsigned long nloop_per_resol, struct timespec start)
{int i;for (i = 0; i < nrecord; i++) {struct timespec ts;load(nloop_per_resol);clock_gettime(CLOCK_MONOTONIC, &ts);buf[i] = ts;}for (i = 0; i < nrecord; i++) {printf("%d\t%ld\t%d\n", id, diff_nsec(start, buf[i]) / NSECS_PER_MSEC, (i+1) * 100 / nrecord);}exit(EXIT_SUCCESS);
}static void parent_fn(int nproc)
{int i;for (i = 0; i < nproc; i++) {wait(NULL);}}static pid_t *pids;int main(int argc, char *argv[])
{int ret = EXIT_FAILURE;if (argc < 4) {fprintf(stderr, "usage: %s <nproc> <total[ms] > <resolution[ms] > \n", argv[0]);exit(EXIT_FAILURE);}int nproc = atoi(argv[1]);int total = atoi(argv[2]);int resol = atoi(argv[3]);if (nproc < 1) { fprintf(stderr, "<nproc> (%d) should be >= 1\n", nproc);exit(EXIT_FAILURE);}if (total < 1) {fprintf(stderr, "<total>(%d) should be >=1 \n", total);exit(EXIT_FAILURE);}if (resol < 1) {fprintf(stderr, "<resol>(%d) should be >=1 \n", resol);exit(EXIT_FAILURE);}int nrecord = total / resol;struct timespec  *logbuf = malloc(nrecord * sizeof(struct timespec));if (!logbuf) {err(EXIT_FAILURE, "malloc(logbuf) failed");}puts("estimating workload which takes just one milisecond");unsigned long nloop_per_resol = loops_per_msec() * resol;puts("end estimation");fflush(stdout);pids = malloc(nproc * sizeof(pid_t));if (pids == NULL) {warn("malloc (pids) failed");goto free_logbuf;}struct timespec start;clock_gettime(CLOCK_MONOTONIC, &start);int i, ncreated;for (i = 0, ncreated = 0; i < nproc; i++, ncreated++) {pids[i] = fork();if(pids[i] < 0) {goto wait_children;} else if (pids[i] == 0) {child_fn(i, logbuf, nrecord, nloop_per_resol, start);}}ret = EXIT_SUCCESS;wait_children:if (ret == EXIT_FAILURE)for (i = 0; i < ncreated; i++) {if (kill(pids[i], SIGINT) < 0) {warn("kill (%d) failed", pids[i]);}}for (i = 0; i < ncreated; i++) {if (wait(NULL) <0 )warn("wait() failed.");}free_pids:free(pids);free_logbuf:free(logbuf);exit(ret);}
其中loop_per_msec含义是:需要执行多少次计操作能够填满1ms的cpu时间(1s=1000ms)
这里在我的计算机上是:大约是50万次。所以1s其实对计算机来说是非常漫长的(可以执行5亿次操作)
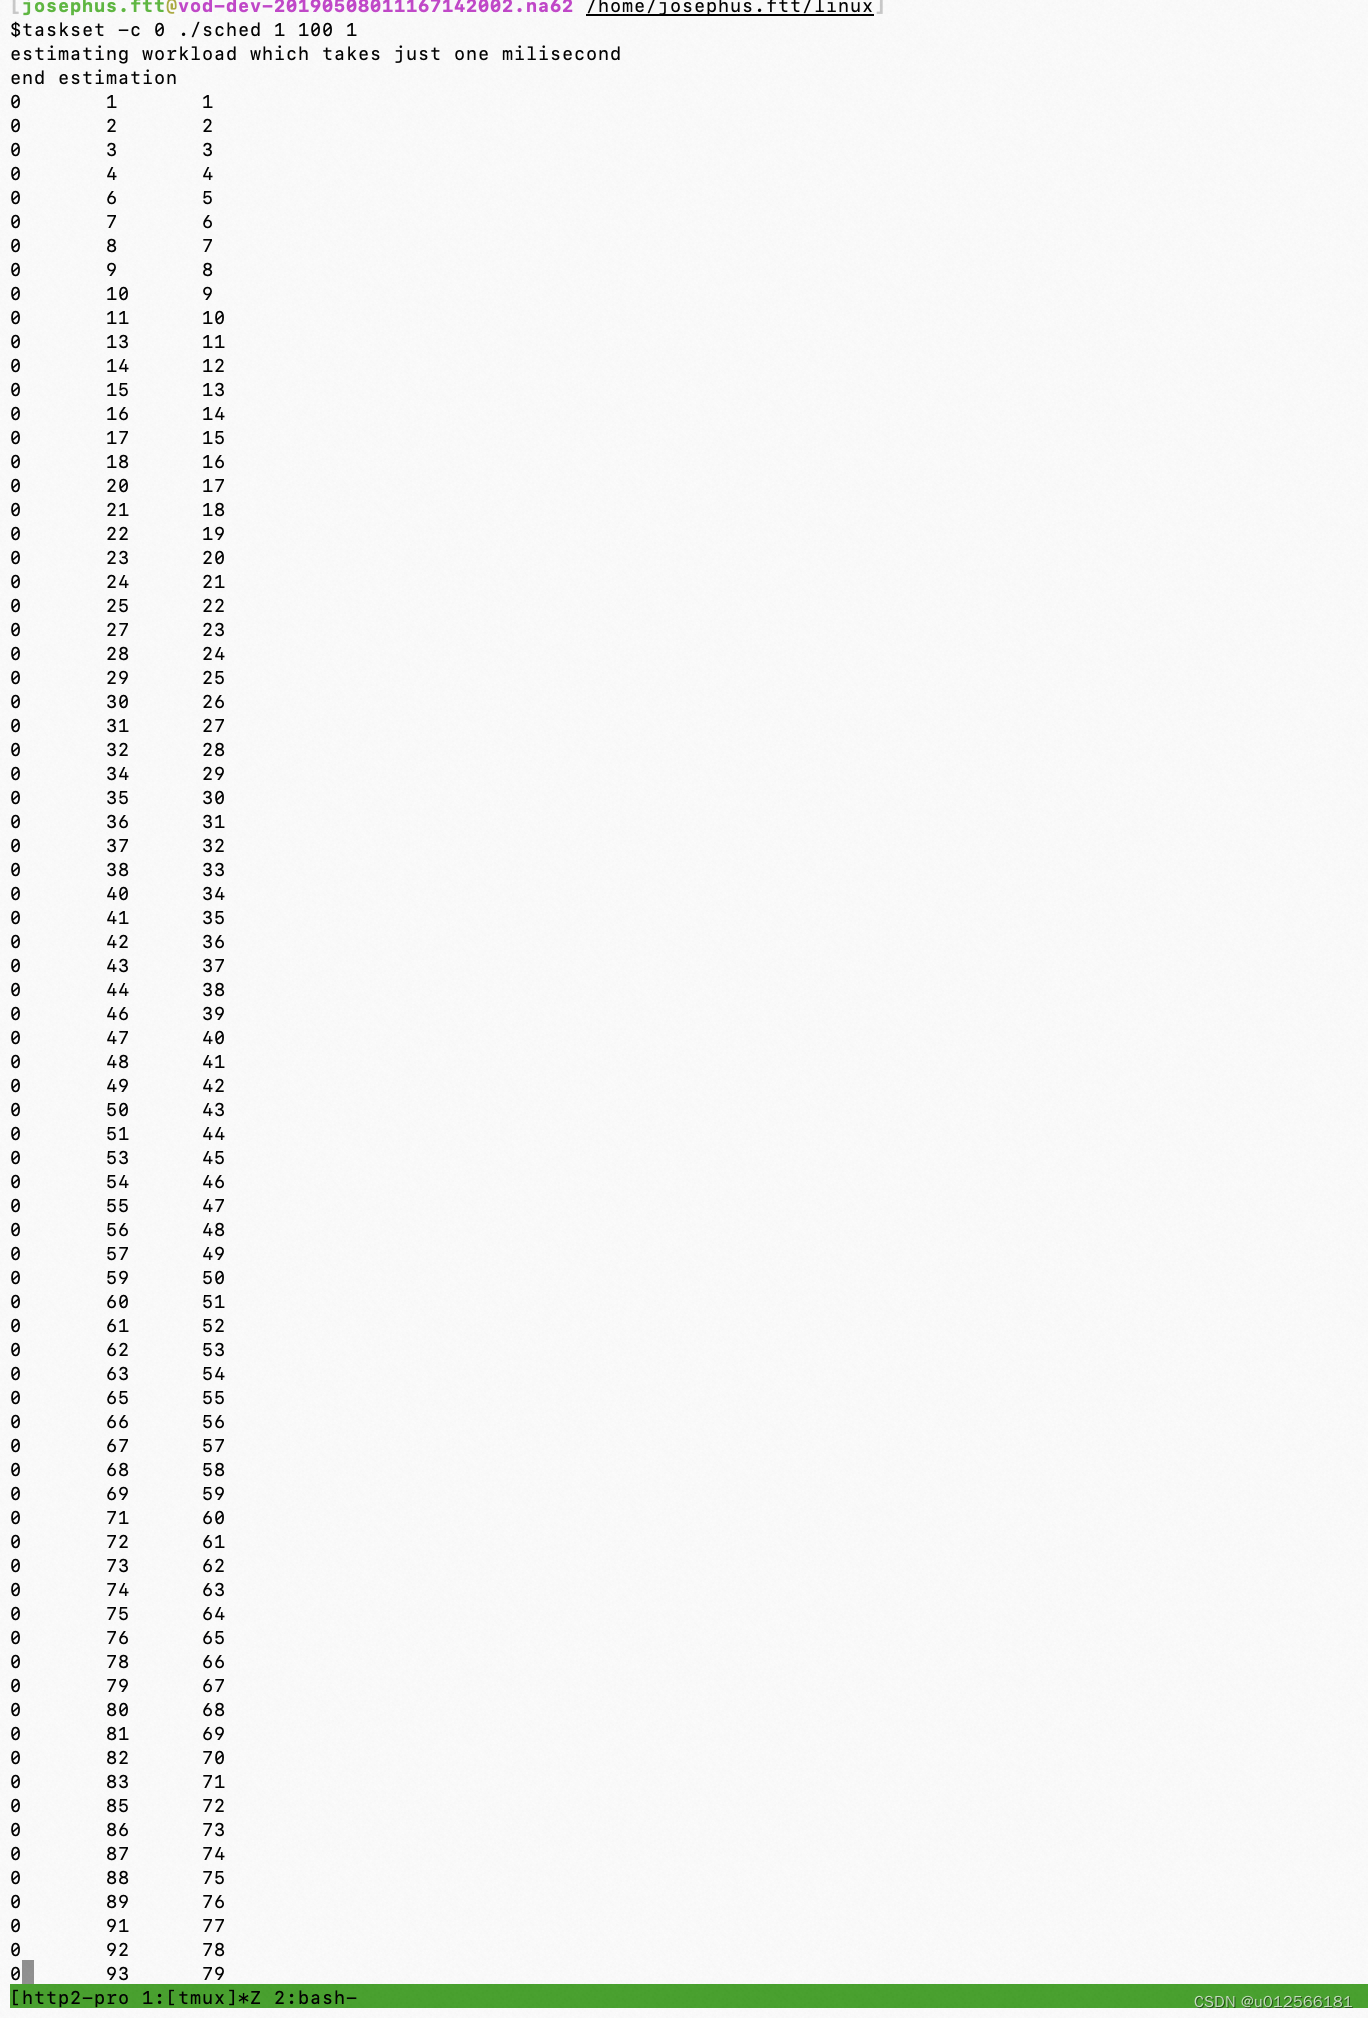
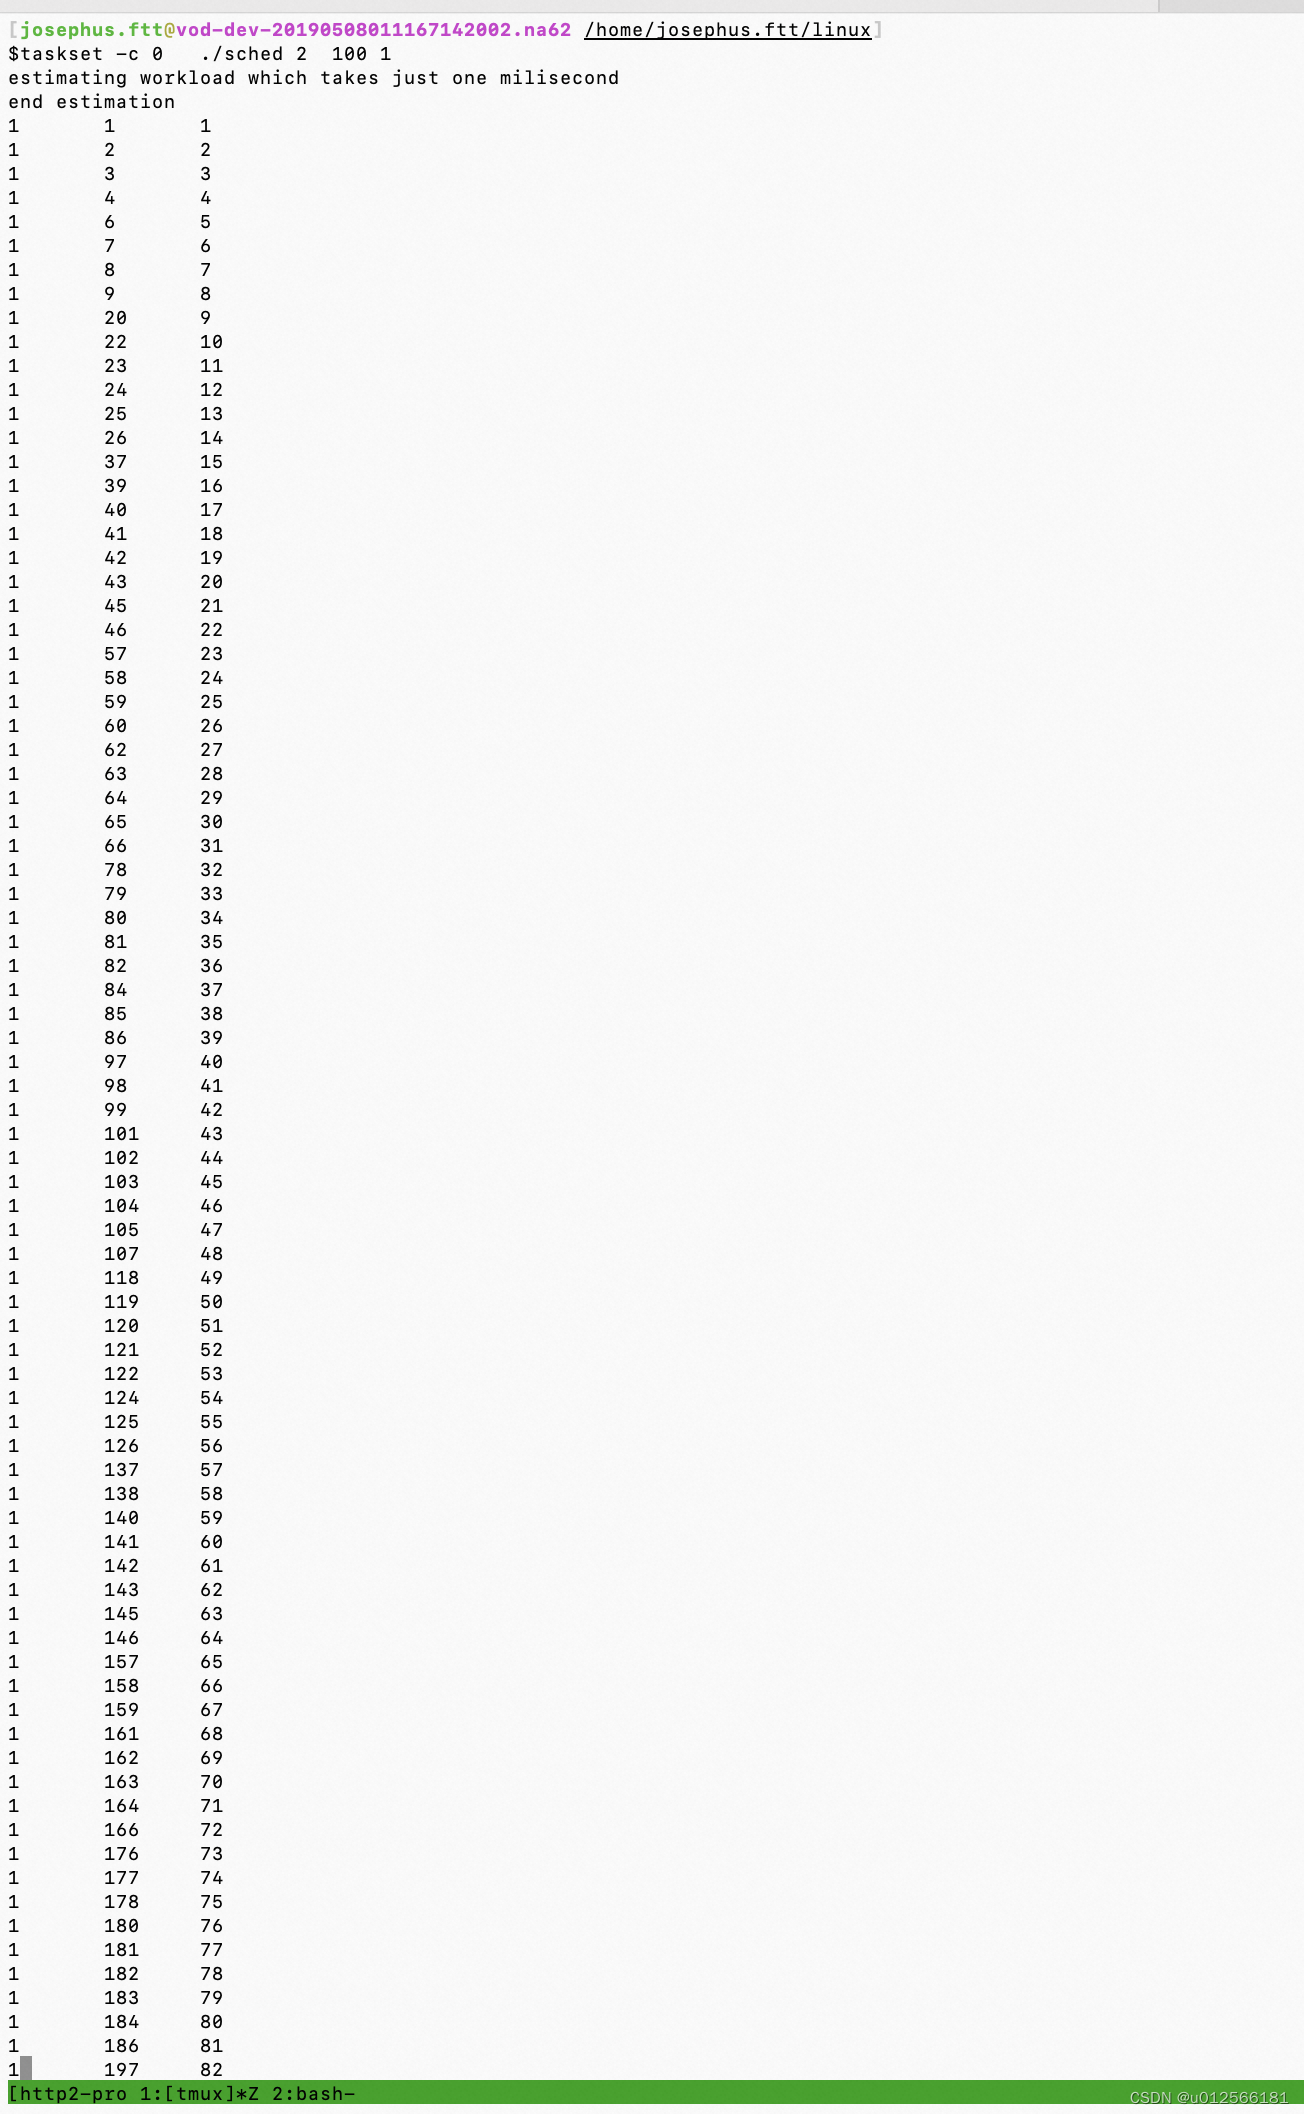
程序使用:用于可视化出进程分片时间:
其中 1 表示1个进程,100表示执行万100ms,1表示每隔1ms打点。
下面的打点数据解释:第一列表示进程号,第二列表示时间点,第三列表示进度。
另外由于在多核机器上会考虑到负载均衡的问题,这里通过taskset命令将进程运行固定在0核上,便于我们观察分析。
下面是2个进程的打点:
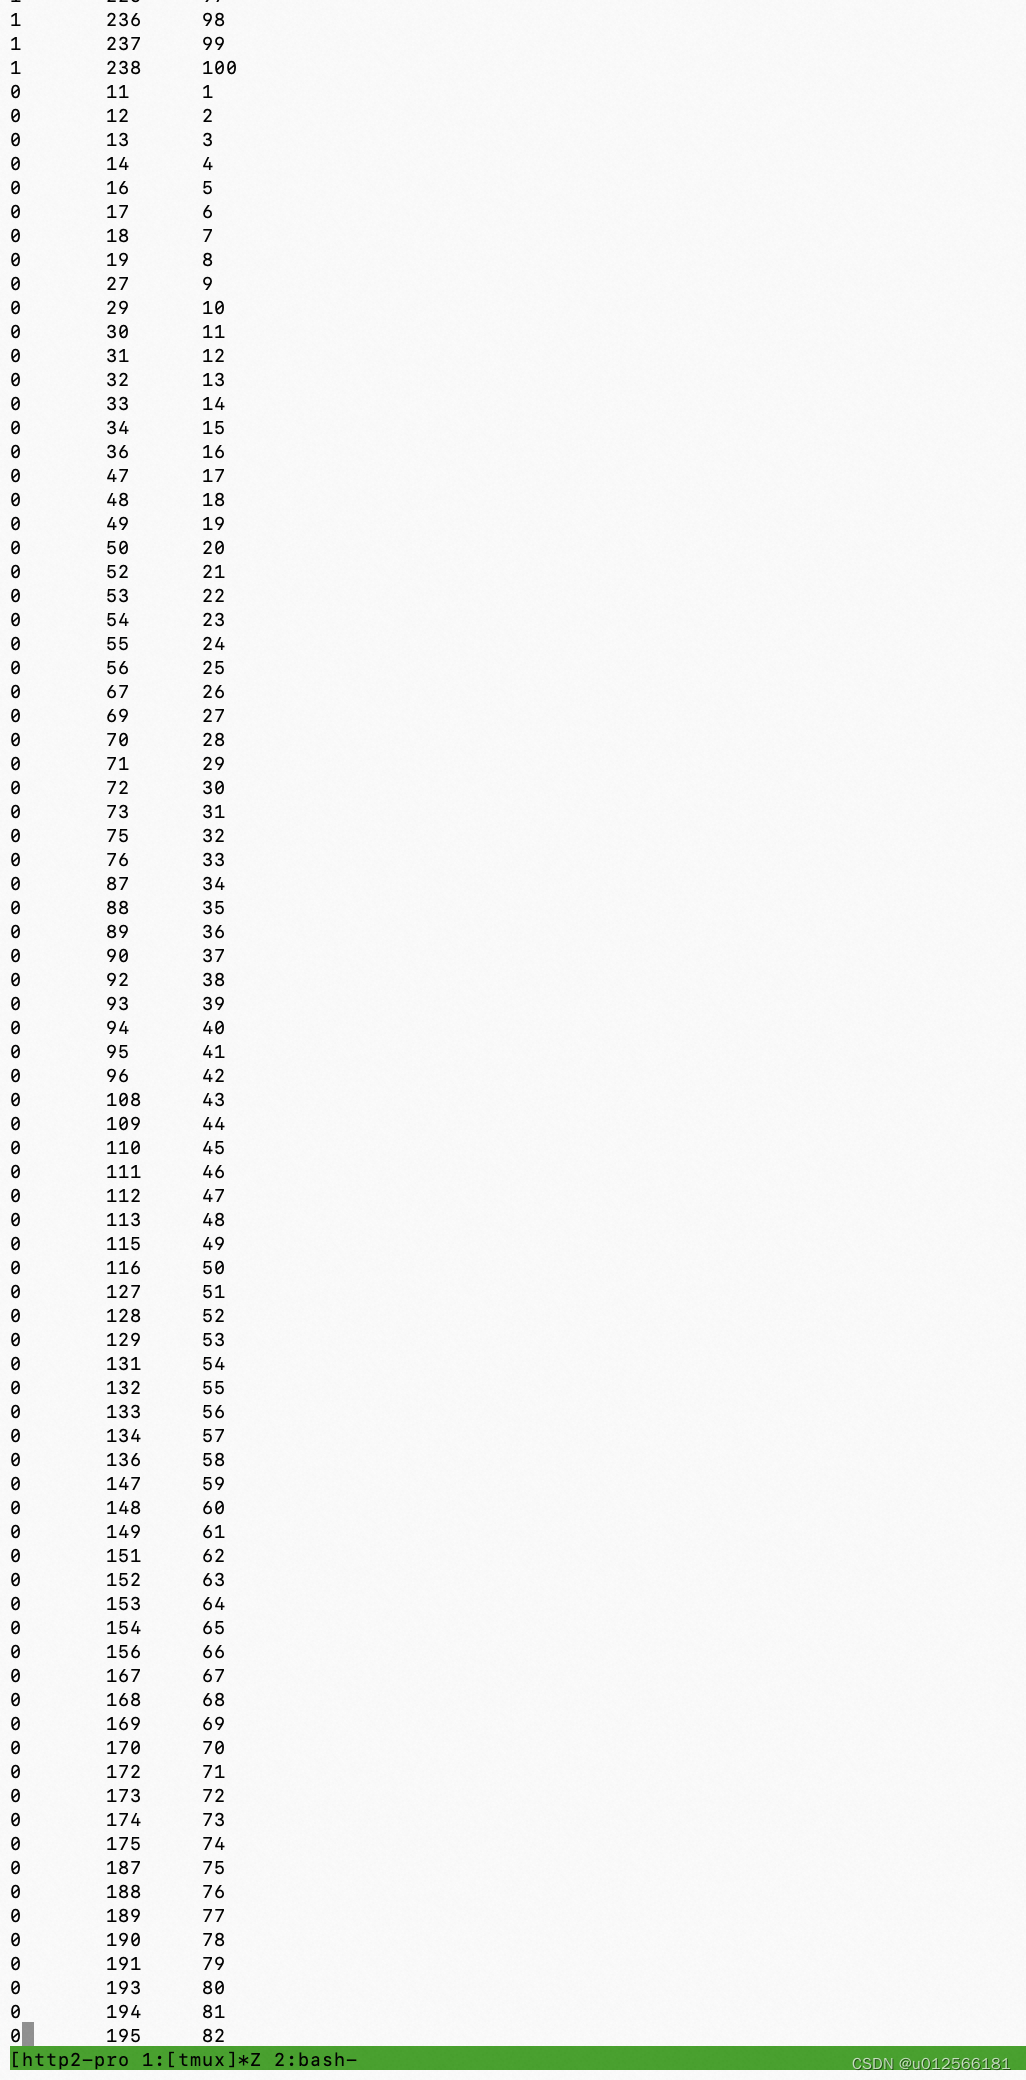
可以看出时间是交错的,四个进程的也是如此。
所以可以看出,在一个核上跑所有进程,实时展示的就是分片运行的。
time命令的输出:
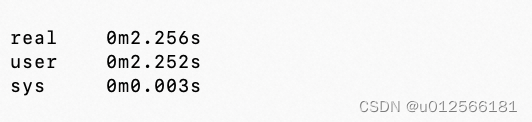
其中real表示的是 程序从开始到运行退出话费的时间, user+sys是程序(注意不是进程,是程序)在cpu上的时间,其中user表示用户态sys表示内核态(比如系统调用) 。
注意,一般情况下user+sys会比real小或者相等,但是也有部分情况会远大于real,这是因为,这个程序可能被好几个进程在运行,而且如果是多核场景,这些进程如果被分配到了多个cpu上并发运行,那么这些cpu时间加上就很可能会大于real时间了。