fastGEO v1.7.0 大更新,支持PCA、差异分析、火山图、热图、差异箱线图、去批次等分析
前言
之前一篇文章【fastGEO V1.6.1 这个版本强的可怕,GEO数据自动下载、探针注释、Shiny App】介绍了fastGEO用于GEO数据下载和探针注释的核心功能。
虽然是付费50获取安装包(刚开始是20),但也深受欢迎,说明这个R包的确好用。
尤其是我自己,用了开发的这个R包后做数据挖掘方便了太多太多。
需要的小伙伴可以直接联系我付费50获取,价格只会涨不会跌,购买后永久免费获取最新版本。
也收到了一些用户的反馈,希望加入一些分析功能,其实这些在之前的推文【fastGEO v1.01,快速下载GEO表达谱、差异分析、火山图、热图】也展示过,只不过还没有放在R包里。
所以这一次更新,把PCA、差异分析、火山图、热图、差异箱线图、去批次这些分析通通加到R包里,仅使用我的R包就可以快速完成这些流程。
更新展示
格式懒得改了,可以移步到Gitee里在浏览,或点击【阅读原文】,效果更佳:fastGEO安装和使用教程。
下游分析
get_GEO_group
- 根据样本信息提取并整理表达谱和分组信息
- 获取表达谱和分组信息后就可以做一系列的分析了
- 指定作为分组依据的临床信息表的列名, 及每个分组的匹配模式和分组名称即可
- 可指定两组或多组
obj = download_GEO("GSE18105", out_dir = "test/00_GEO_data_GSE18105")
Find local annotation file, will be used preferably!
INFO [2025-08-02 15:00:34] Step1: Download GEO data ...
INFO [2025-08-02 15:00:34] Querying dataset: GSE18105 ...- Use local curl- Found 1 GPL- Found 111 samples, 39 metas.- Writting sample_anno to test/00_GEO_data_GSE18105/GSE18105_sample_anno.csv - Normalize between arrays ...- Successed, file save to test/00_GEO_data_GSE18105/GSE18105_GPL570.RData.
INFO [2025-08-02 15:00:55] Step2: Annotate probe GPL570 ...
INFO [2025-08-02 15:00:55] Use built-in annotation file ...
- All porbes matched!
- All porbes annotated!
INFO [2025-08-02 15:00:55] Removing duplicated genes by method: max ...
INFO [2025-08-02 15:01:20] Done.
expM = obj$expM
sample_anno = obj$sample_anno
hd(expM)
dim: 22881 × 111
| GSM452552 | GSM452553 | GSM452554 | GSM452555 | GSM452556 | |
|---|---|---|---|---|---|
| <dbl> | <dbl> | <dbl> | <dbl> | <dbl> | |
| A1BG | 3.884167 | 3.805943 | 3.779392 | 3.961285 | 3.980595 |
| A1BG-AS1 | 4.755635 | 5.021991 | 4.992824 | 5.002680 | 4.811076 |
| A1CF | 7.603906 | 8.907048 | 8.035191 | 8.603941 | 7.788007 |
| A2M | 10.972595 | 7.664711 | 9.703405 | 9.684616 | 9.976007 |
| A2M-AS1 | 4.349903 | 4.127930 | 4.240315 | 4.537712 | 4.449675 |
hd(sample_anno)
dim: 111 × 39
| title | geo_accession | status | submission_date | last_update_date | |
|---|---|---|---|---|---|
| <chr> | <chr> | <chr> | <chr> | <chr> | |
| GSM452552 | patient 100, cancer, LCM | GSM452552 | Public on Feb 04 2010 | Sep 14 2009 | Aug 28 2018 |
| GSM452553 | patient 101, cancer, LCM | GSM452553 | Public on Feb 04 2010 | Sep 14 2009 | Aug 28 2018 |
| GSM452554 | patient 102, cancer, LCM | GSM452554 | Public on Feb 04 2010 | Sep 14 2009 | Aug 28 2018 |
| GSM452555 | patient 103, cancer, LCM | GSM452555 | Public on Feb 04 2010 | Sep 14 2009 | Aug 28 2018 |
| GSM452556 | patient 104, cancer, LCM | GSM452556 | Public on Feb 04 2010 | Sep 14 2009 | Aug 28 2018 |
table_GEO_clinical(obj$sample_anno)
$characteristics_ch1metastasis: metastasis metastasis: metastatic recurrence 26                                18 metastasis: none 67 $characteristics_ch1.1tissue: cancer, homogenized         tissue: cancer, LCM 17                          77
tissue: normal, homogenized 17
# 两组
group_list = get_GEO_group(obj, group_name = "characteristics_ch1.1", "cancer, homogenized" = "Cancer", "normal, homogenized" = "Normal")
group = group_list$group
table(group)
group
Cancer Normal 17     17
SID = group_list$SID
hd(SID)
dim: 34
- 'GSM452646'
- 'GSM452647'
- 'GSM452648'
- 'GSM452649'
- 'GSM452650'
expM = group_list$expM
hd(expM)
dim: 22881 × 34
| GSM452646 | GSM452647 | GSM452648 | GSM452649 | GSM452650 | |
|---|---|---|---|---|---|
| <dbl> | <dbl> | <dbl> | <dbl> | <dbl> | |
| A1BG | 4.218375 | 4.102014 | 4.080164 | 4.017133 | 3.958630 |
| A1BG-AS1 | 4.813436 | 4.965083 | 4.854558 | 4.685886 | 4.796381 |
| A1CF | 8.866299 | 7.978485 | 8.947088 | 9.373371 | 9.222967 |
| A2M | 6.513392 | 8.517808 | 11.518616 | 8.276835 | 7.645857 |
| A2M-AS1 | 3.880756 | 3.910804 | 5.114558 | 4.081589 | 3.817199 |
sample_anno = group_list$sample_anno
hd(sample_anno)
dim: 34 × 39
| title | geo_accession | status | submission_date | last_update_date | |
|---|---|---|---|---|---|
| <chr> | <chr> | <chr> | <chr> | <chr> | |
| GSM452646 | patient 006, cancer, homogenized | GSM452646 | Public on Feb 04 2010 | Sep 14 2009 | Aug 28 2018 |
| GSM452647 | patient 011, cancer, homogenized | GSM452647 | Public on Feb 04 2010 | Sep 14 2009 | Aug 28 2018 |
| GSM452648 | patient 024, cancer, homogenized | GSM452648 | Public on Feb 04 2010 | Sep 14 2009 | Aug 28 2018 |
| GSM452649 | patient 027, cancer, homogenized | GSM452649 | Public on Feb 04 2010 | Sep 14 2009 | Aug 28 2018 |
| GSM452650 | patient 028, cancer, homogenized | GSM452650 | Public on Feb 04 2010 | Sep 14 2009 | Aug 28 2018 |
# 多组
group_list = get_GEO_group(obj, group_name = "characteristics_ch1.1", "cancer, homogenized" = "Cancer", "normal, homogenized" = "Normal","cancer, LCM" = "Cancer_LCM")
table(group_list$group)
Cancer Cancer_LCM Normal
17 77 17
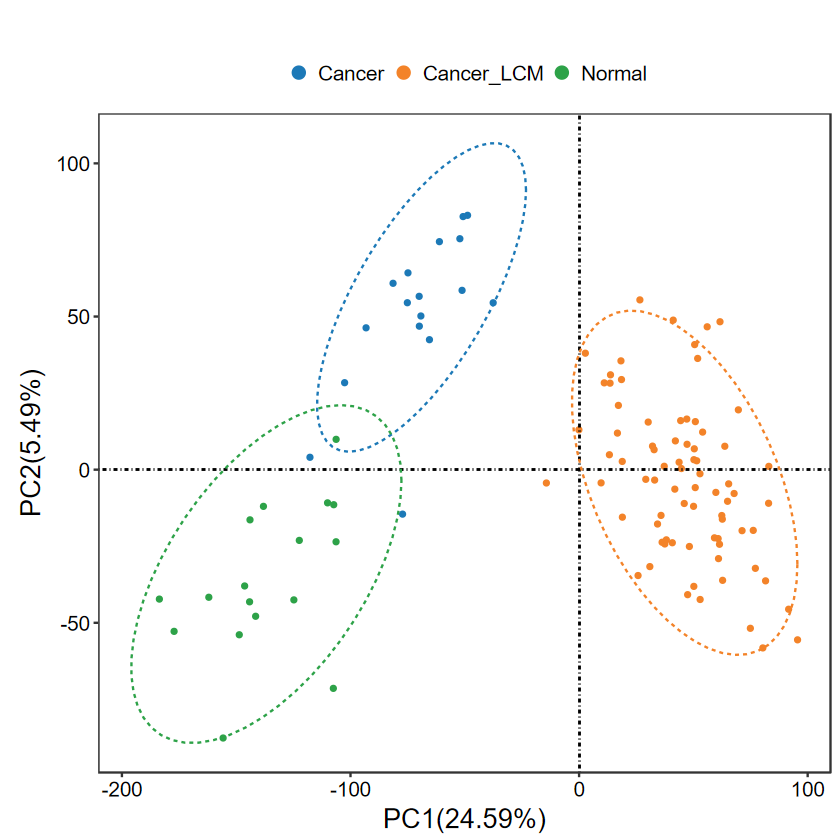
run_PCA
- 执行PCA分析并绘图
- 默认添加椭圆、默认不添加样本标签
- 可输出图片(PDF/PNG), 返回ggplot对象, 可自行修改
group = group_list$group
expM = group_list$expM
SID = group_list$SID
table(group)
groupCancer Cancer_LCM Normal 17 77 17
run_PCA(expM, group, out_name = "./test/00_GEO_data_GSE18105/01_PCA")
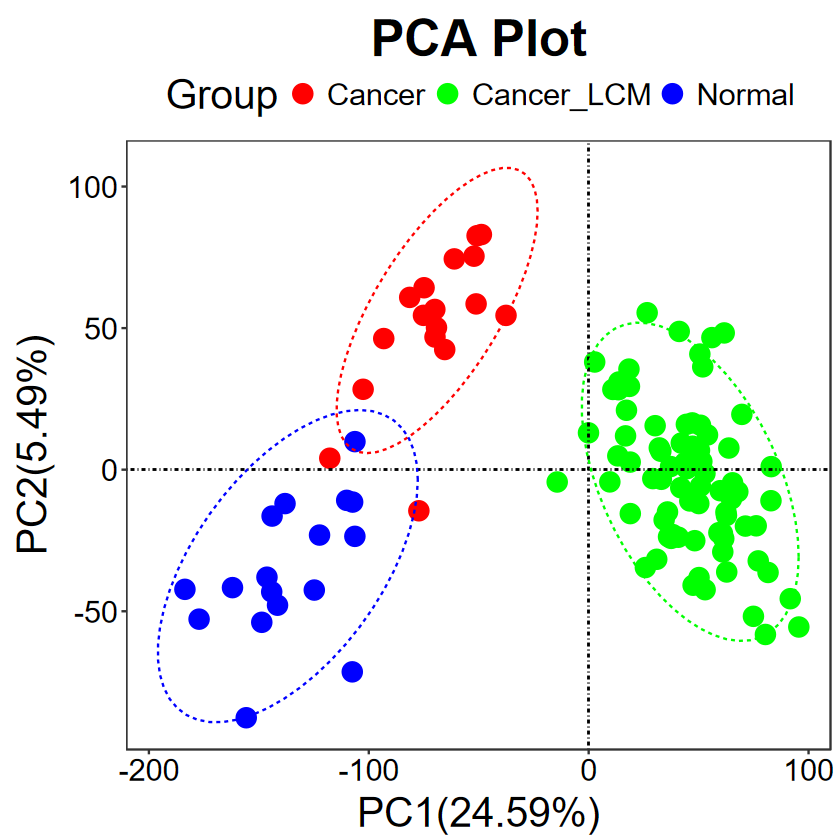
# 修改属性
run_PCA(expM, group, title = "PCA Plot", legend.title = "Group", text.size = 30, pt.size = 5, key.size = 5, color = c("red", "green", "blue"))
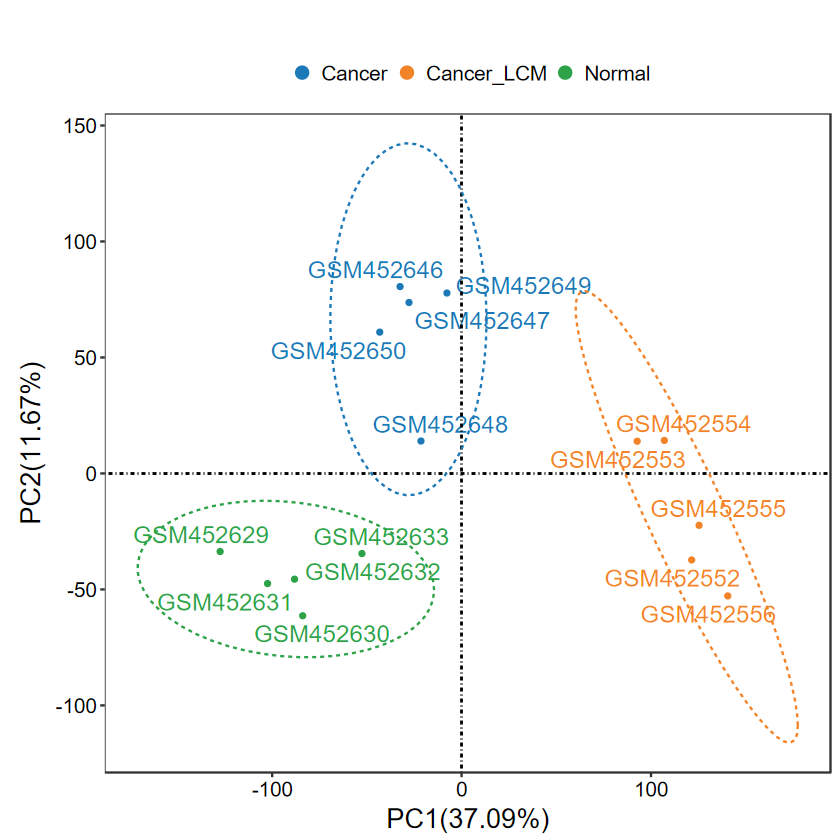
- 添加label, 适合样本较少的情况, 可以更清晰地展示离群样本名
- 这里每组只提取前5个样本展示
SID2 = unlist(lapply(group_list$SID_list, function(x) x[1:5]))
group2 = group[match(SID2, SID)]
expM2 = expM[, SID2]
table(group2)
group2Cancer Cancer_LCM Normal 5 5 5
run_PCA(expM2, group2, label = TRUE)
run_DEG_limma
- 快速进行limma差异分析, 适合标准化的芯片数据或高通量数据
- 可设置阈值, 默认 |log2FC| > 1, Padj < 0.05
- 可设置不使用P值矫正
- 可添加基因label, 可自定义基因
DEG_tb = run_DEG_limma(expM, group, Case = "Cancer", Control = "Normal", out_name = "./test/00_GEO_data_GSE18105/02_DEG")
Number of Up regulated genes: 1006
Number of Down regulated genes: 1096
Number of Not Change regulated genes: 20779
head(DEG_tb)
| logFC | AveExpr | t | P.Value | adj.P.Val | B | DEG | |
|---|---|---|---|---|---|---|---|
| <dbl> | <dbl> | <dbl> | <dbl> | <dbl> | <dbl> | <chr> | |
| FOXQ1 | 5.716354 | 8.777030 | 13.702008 | 2.117724e-15 | 8.075941e-12 | 24.97073 | Up |
| CLDN1 | 4.640807 | 8.502369 | 19.330354 | 6.543012e-20 | 1.497107e-15 | 34.74020 | Up |
| LGR5 | 4.485429 | 7.354803 | 10.223319 | 6.637827e-12 | 1.421583e-09 | 17.14899 | Up |
| KRT23 | 4.445303 | 6.613692 | 8.937107 | 1.917386e-10 | 1.589992e-08 | 13.84479 | Up |
| DPEP1 | 4.260363 | 8.240490 | 10.122520 | 8.572521e-12 | 1.662270e-09 | 16.89826 | Up |
| CEMIP | 4.147864 | 8.048877 | 12.218476 | 5.487202e-14 | 5.879765e-11 | 21.82719 | Up |
# 最低阈值
DEG_tb2 = run_DEG_limma(expM, group, Case = "Cancer", Control = "Normal", log2FC = 0.5, padj = FALSE, out_name = "./test/00_GEO_data_GSE18105/03_DEG")
Number of Up regulated genes: 2969
Number of Down regulated genes: 2724
Number of Not Change regulated genes: 17188
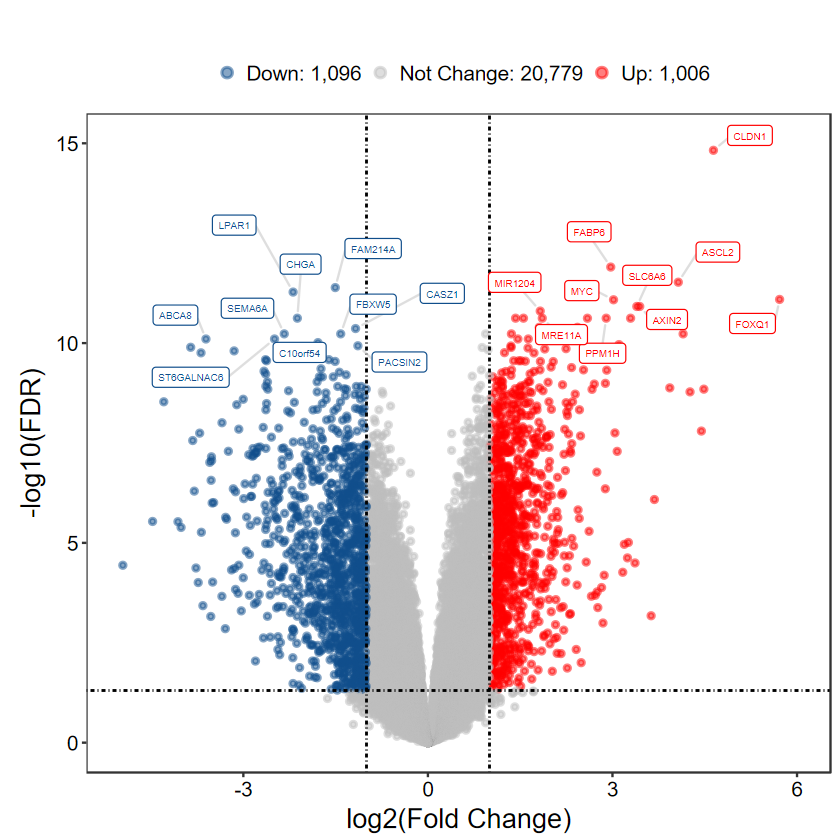
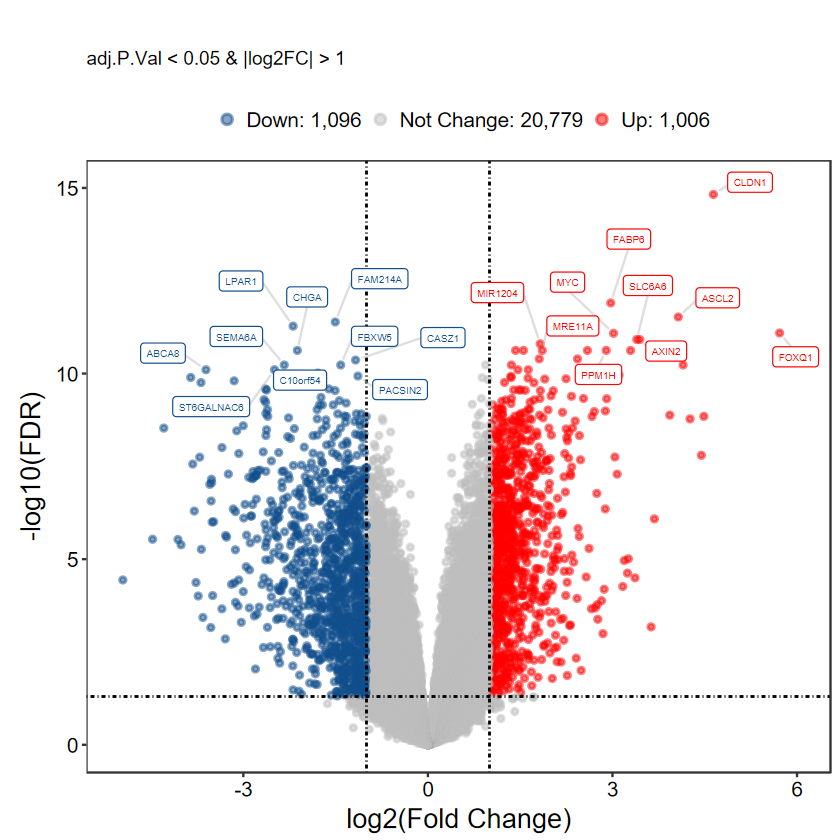
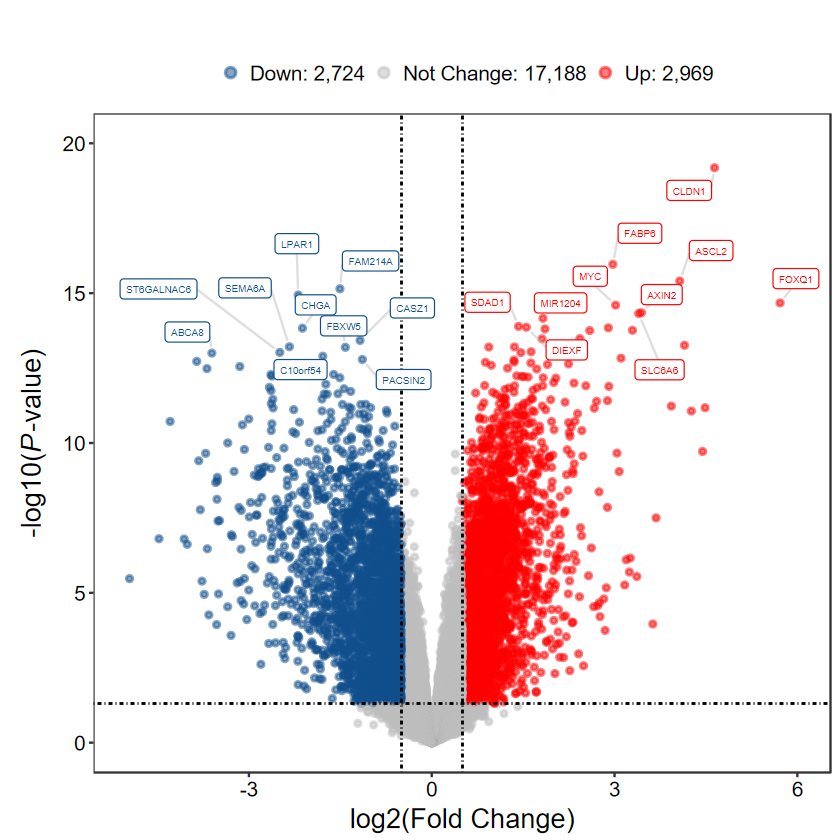
plot_volcano_limma
- 根据差异表格绘制火山图
group_list = get_GEO_group(obj, group_name = "characteristics_ch1.1", "cancer, homogenized" = "Cancer", "normal, homogenized" = "Normal","cancer, LCM" = "Cancer_LCM")
table(group_list$group)
Cancer Cancer_LCM Normal
17 77 17
group = group_list$group
expM = group_list$expM
SID = group_list$SID
table(group)
groupCancer Cancer_LCM Normal 17 77 17
DEG_tb = run_DEG_limma(expM, group, Case = "Cancer", Control = "Normal", out_name = "./test/00_GEO_data_GSE18105/02_DEG")
Number of Up regulated genes: 1006
Number of Down regulated genes: 1096
Number of Not Change regulated genes: 20779
plot_volcano_limma(DEG_tb, out_name = "./test/00_GEO_data_GSE18105/04_volcano")
[1m[22mScale for [32my[39m is already present.
Adding another scale for [32my[39m, which will replace the existing scale.
Warning message:
"[1m[22mDuplicated aesthetics after name standardisation: [32msegment.colour[39m"
# 显示阈值
plot_volcano_limma(DEG_tb, caption = TRUE)
[1m[22mScale for [32my[39m is already present.
Adding another scale for [32my[39m, which will replace the existing scale.
Warning message:
"[1m[22mDuplicated aesthetics after name standardisation: [32msegment.colour[39m"
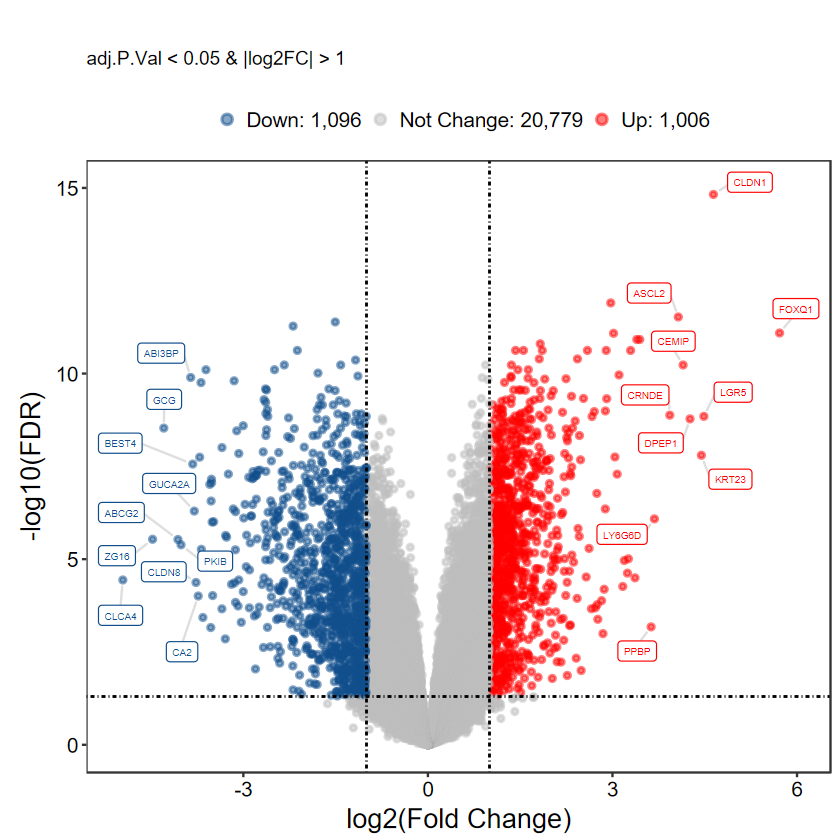
# 选择 top logFC 前10的基因进行显示
plot_volcano_limma(DEG_tb, caption = TRUE, method = "logFC")
[1m[22mScale for [32my[39m is already present.
Adding another scale for [32my[39m, which will replace the existing scale.
Warning message:
"[1m[22mDuplicated aesthetics after name standardisation: [32msegment.colour[39m"
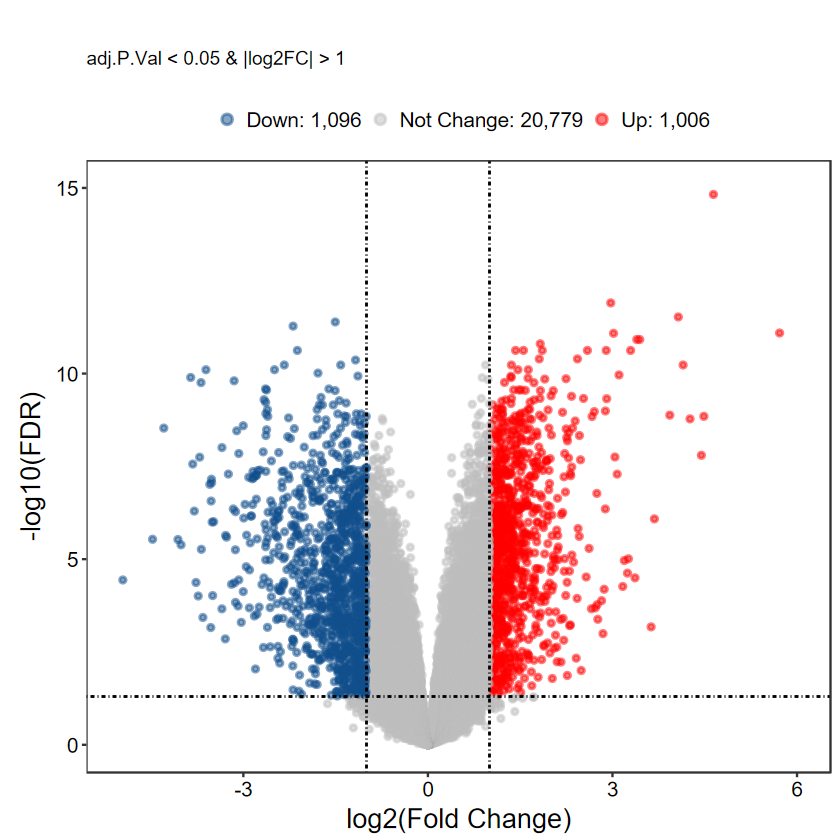
# 不显示基因名
plot_volcano_limma(DEG_tb, caption = TRUE, label = FALSE)
[1m[22mScale for [32my[39m is already present.
Adding another scale for [32my[39m, which will replace the existing scale.
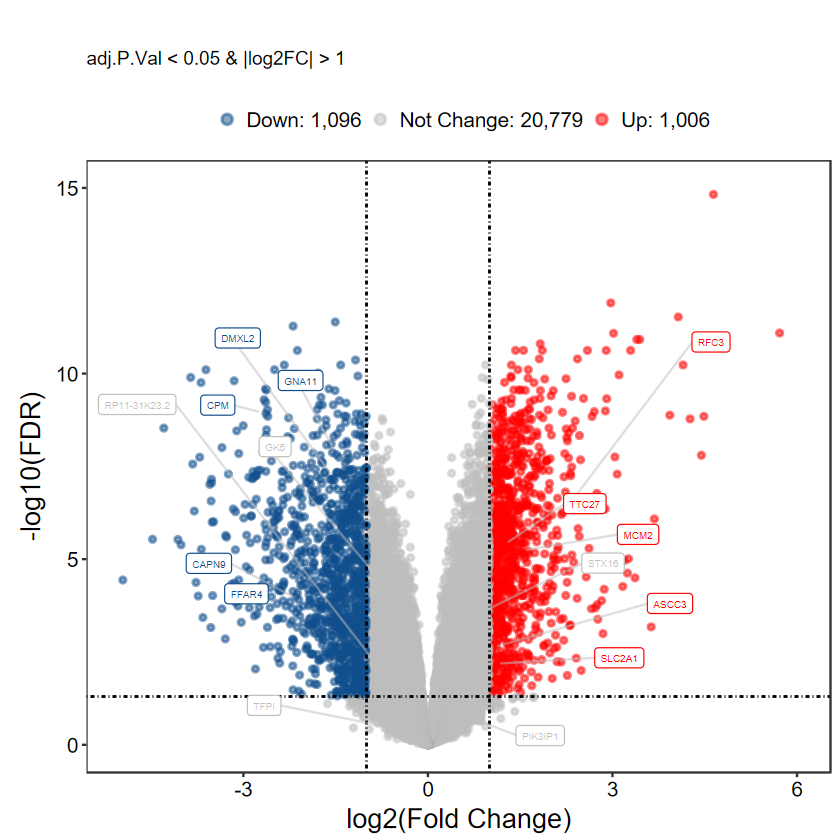
# 自定义label基因, 每组随机挑选5个
set.seed(1234)
gene_slect = as.character(aggregate(rownames(DEG_tb), by = list(DEG_tb$DEG), function(x) sample(x, 5))[, 2])
gene_slect
- 'CPM'
- 'STX16'
- 'TTC27'
- 'FFAR4'
- 'RP11-31K23.2'
- 'MCM2'
- 'GNA11'
- 'PIK3IP1'
- 'RFC3'
- 'CAPN9'
- 'TFPI'
- 'ASCC3'
- 'DMXL2'
- 'GK5'
- 'SLC2A1'
plot_volcano_limma(DEG_tb, caption = TRUE, label = gene_slect)
[1m[22mScale for [32my[39m is already present.
Adding another scale for [32my[39m, which will replace the existing scale.
Warning message:
"[1m[22mDuplicated aesthetics after name standardisation: [32msegment.colour[39m"
- 如果差异分析的阈值发生改变, 这里也要进行一样的设置
# 最低阈值
DEG_tb2 = run_DEG_limma(expM, group, Case = "Cancer", Control = "Normal", log2FC = 0.5, padj = FALSE, out_name = "./test/00_GEO_data_GSE18105/03_DEG")
Number of Up regulated genes: 2969
Number of Down regulated genes: 2724
Number of Not Change regulated genes: 17188
plot_volcano_limma(DEG_tb2, log2FC = 0.5, padj = FALSE)
[1m[22mScale for [32my[39m is already present.
Adding another scale for [32my[39m, which will replace the existing scale.
Warning message:
"[1m[22mDuplicated aesthetics after name standardisation: [32msegment.colour[39m"
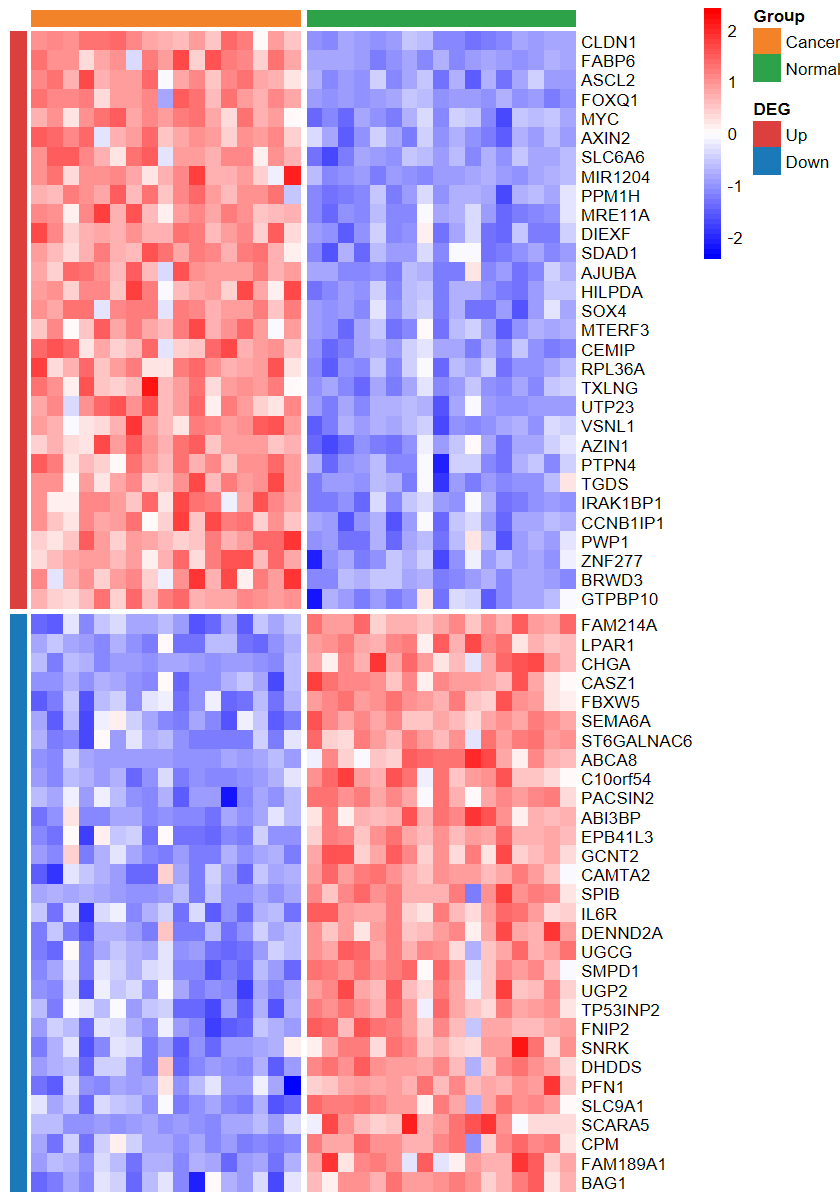
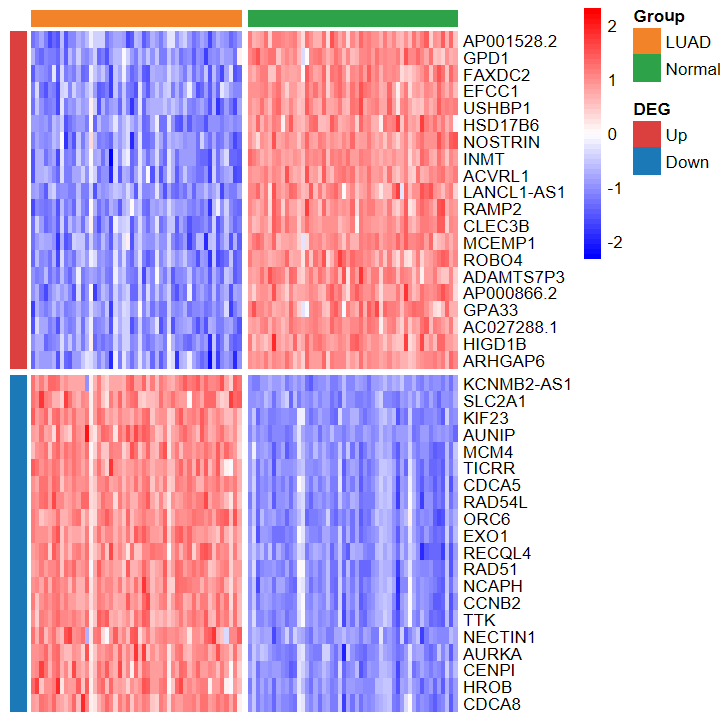
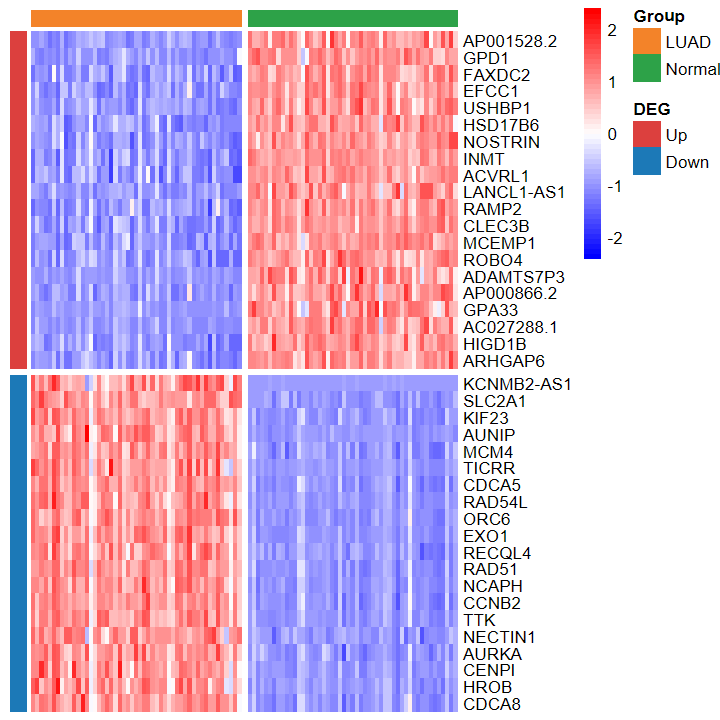
plot_heatmap_DEG
- 根据差异分析结果和表达谱绘制差异基因热图
# 仅支持输入两种分组
group2 = group[group != "Cancer_LCM"]
expM2 = expM[, group != "Cancer_LCM"]
table(group2)
group2
Cancer Normal 17     17
plot_heatmap_DEG(expM2, DEG_tb, group2, out_name = "./test/00_GEO_data_GSE18105/04_heatmap")
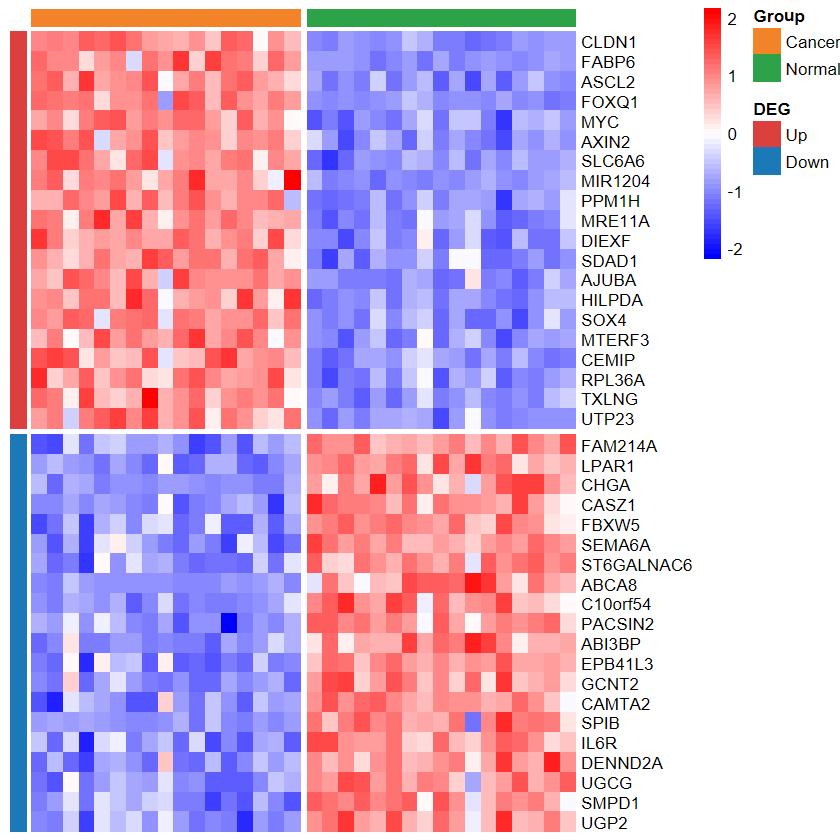
set_image(7, 10)
plot_heatmap_DEG(expM2, DEG_tb, group2, ntop = 30, w = 15)
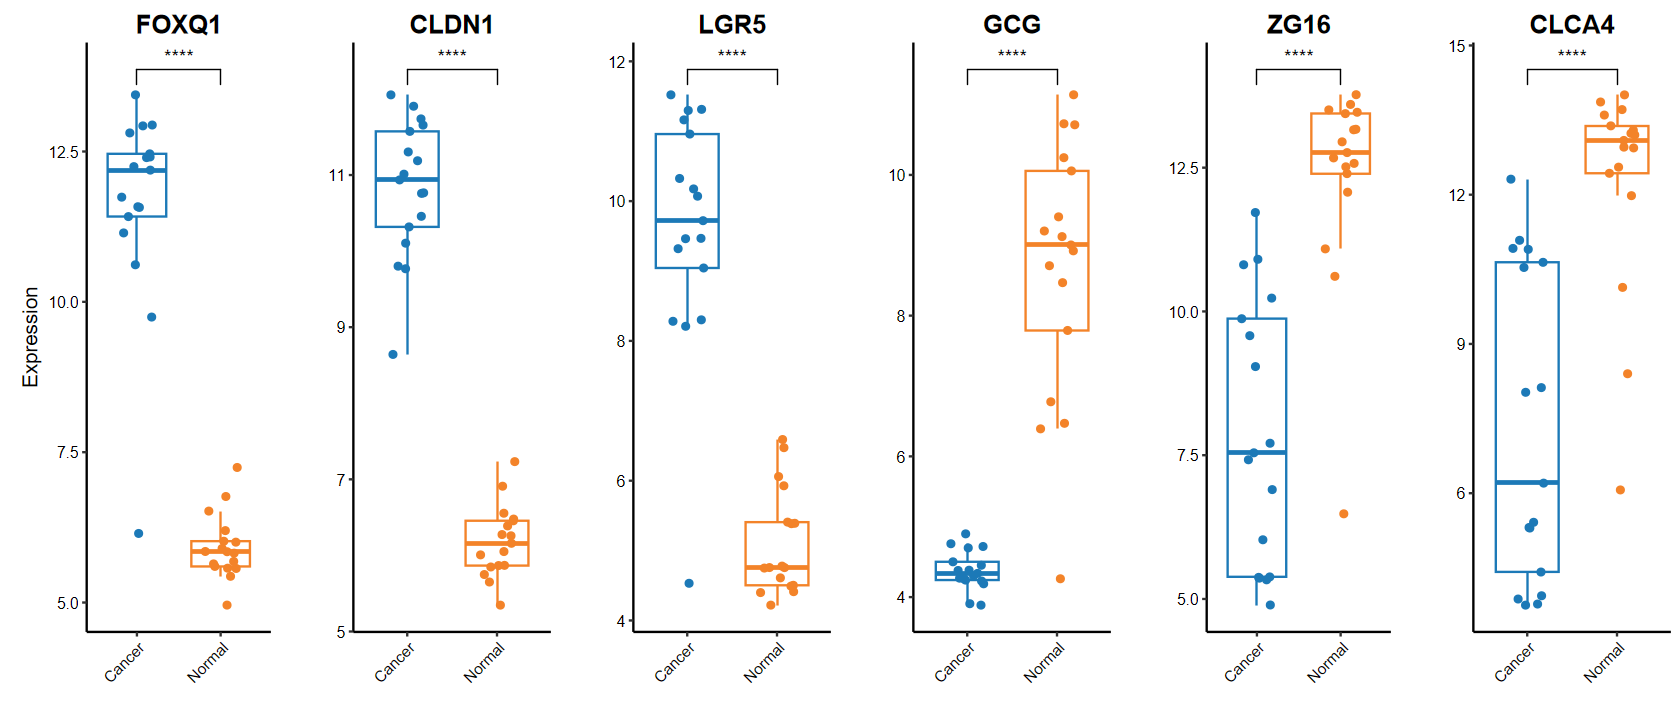
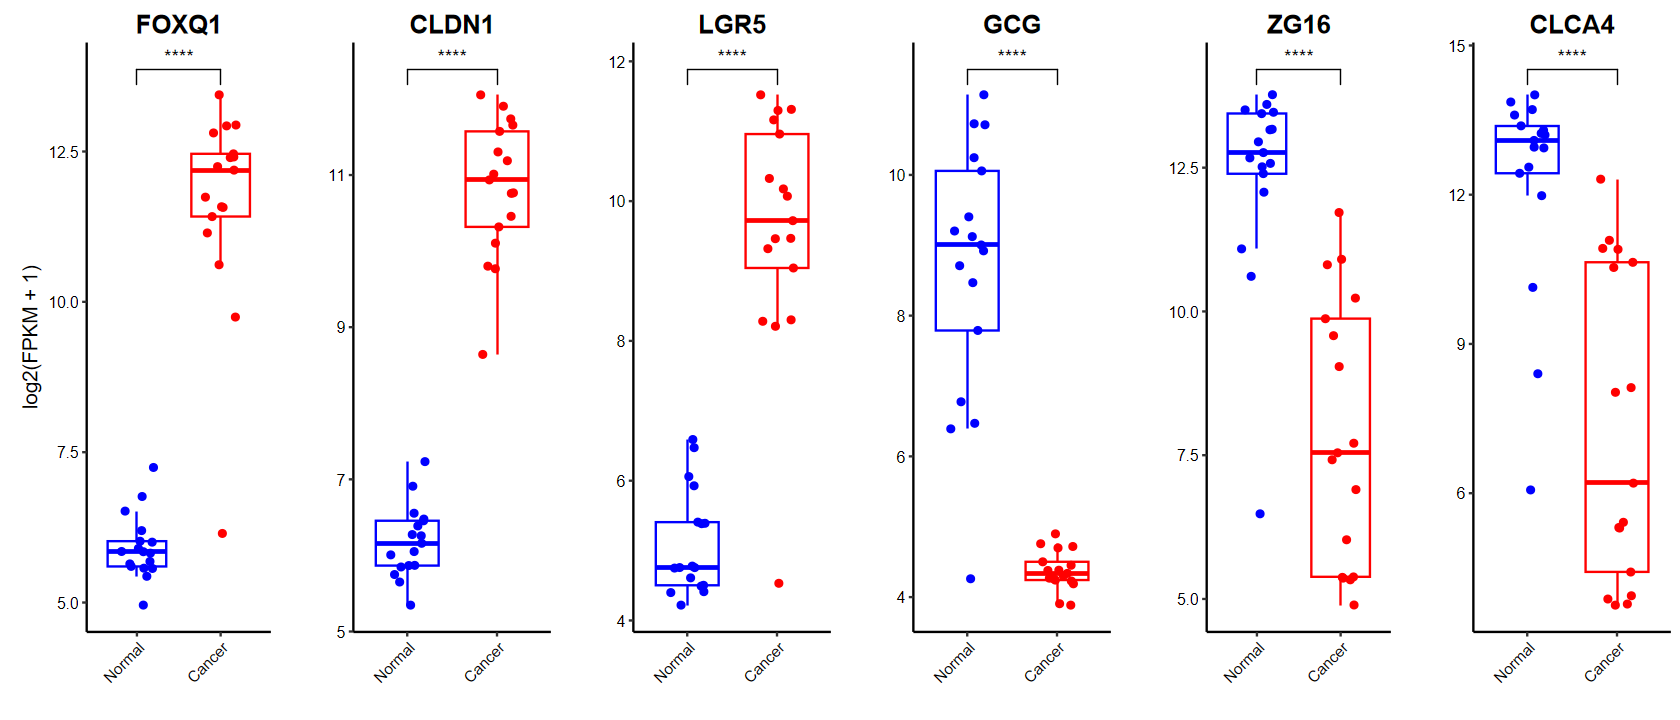
plot_boxplot
gene_select = c(head(rownames(DEG_tb), 3), tail(rownames(DEG_tb), 3))
gene_select
- 'FOXQ1'
- 'CLDN1'
- 'LGR5'
- 'GCG'
- 'ZG16'
- 'CLCA4'
source("W:/02_Study/R_build/build/fastGEO/functions/analysis.R")
set_image(14, 6)
plot_boxplot(expM2, group2, genes = gene_select,out_name = "./test/00_GEO_data_GSE18105/06_boxplot", w = 10, h = 5)
set_image(14, 6)
plot_boxplot(expM2, group2, genes = gene_select, breaks = c("Normal", "Cancer"), # 修改x轴顺序ylab = "log2(FPKM + 1)", # 修改y轴标题color = c("blue", "red"), # 修改颜色w = 10, h = 5)
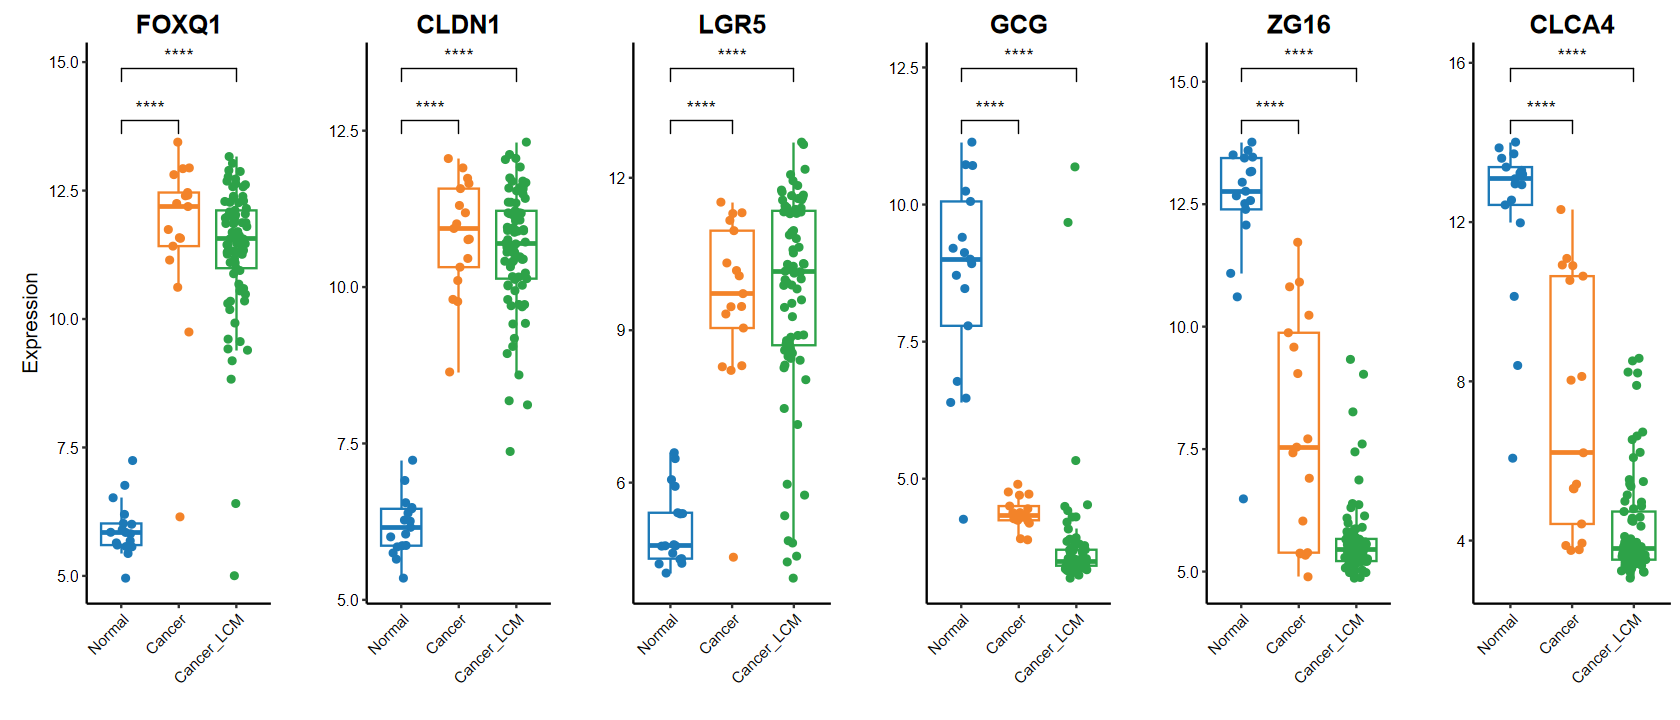
# 多组
set_image(14, 6)
plot_boxplot(expM, group, breaks = c("Normal", "Cancer", "Cancer_LCM"), # 修改x轴顺序comparisons = list(c("Cancer", "Normal"), c("Cancer_LCM", "Normal")), # 手动指定分组genes = gene_select)
run_DEG_deseq2
- 快速使用DESeq2进行差异分析, 适合count数据
- 有count数据优先使用DESeq2
load2("./test/TCGA/00_TCGA_data.RData")
Loading objects:expMexpM_FPKMgroupsample_anno
hd(expM)
dim: 59427 × 562
| TCGA-60-2712-01A-01R-0851-07 | TCGA-56-7221-01A-11R-2045-07 | TCGA-21-A5DI-01A-31R-A26W-07 | TCGA-43-7657-01A-31R-2125-07 | TCGA-94-7033-01A-11R-1949-07 | |
|---|---|---|---|---|---|
| <int> | <int> | <int> | <int> | <int> | |
| 5_8S_rRNA | 0 | 0 | 0 | 0 | 0 |
| 5S_rRNA | 0 | 0 | 0 | 4 | 4 |
| 7SK | 0 | 3 | 0 | 0 | 0 |
| A1BG | 7 | 1 | 0 | 6 | 5 |
| A1BG-AS1 | 81 | 34 | 31 | 41 | 24 |
table(group)
groupLUAD Normal 511 51
sum(group == "Normal")
51
# 取子集测试
set.seed(1234)
SID_tumor = sample(colnames(expM)[group == "LUAD"], sum(group == "Normal"))
expM2 = expM[, c(SID_tumor, colnames(expM)[group == "Normal"])]
group2 = group[match(colnames(expM2), colnames(expM))]
table(group2)
group2LUAD Normal 51 51
DEG_tb_count = run_DEG_deseq2(expM2, group2, Case = "LUAD", Control = "Normal", out_name = "./test/TCGA/TCGA_LUAD_DEG")
estimating size factorsestimating dispersionsgene-wise dispersion estimatesmean-dispersion relationshipfinal dispersion estimatesfitting model and testing-- replacing outliers and refitting for 3453 genes
-- DESeq argument 'minReplicatesForReplace' = 7
-- original counts are preserved in counts(dds)estimating dispersionsfitting model and testing
Number of Up regulated genes: 6032
Number of Down regulated genes: 11035
Number of Not Change regulated genes: 37154
count_to_exp
- 用于将count矩阵转为标准化的表达谱, 可用于绘制PCA、热图和箱线图等
- 不依赖于基因长度, 省去计算TPM/FPKM的麻烦
- 使用 DESeq2 的 VST 标准化方法
expM_vst = count_to_exp(expM2)
hd(expM_vst)
dim: 59427 × 102
| TCGA-58-A46K-01A-11R-A24H-07 | TCGA-68-A59J-01A-21R-A26W-07 | TCGA-66-2753-01A-01R-0980-07 | TCGA-77-8136-01A-11R-2247-07 | TCGA-46-3765-01A-01R-0980-07 | |
|---|---|---|---|---|---|
| <dbl> | <dbl> | <dbl> | <dbl> | <dbl> | |
| 5_8S_rRNA | 1.885298 | 1.885298 | 1.885298 | 1.885298 | 1.885298 |
| 5S_rRNA | 3.184227 | 1.885298 | 2.586642 | 1.885298 | 1.885298 |
| 7SK | 1.885298 | 1.885298 | 1.885298 | 1.885298 | 1.885298 |
| A1BG | 3.452268 | 3.881663 | 3.250346 | 4.269259 | 3.959024 |
| A1BG-AS1 | 5.402377 | 5.804480 | 5.639623 | 6.755954 | 5.297581 |
expM_FPKM2 = expM_FPKM[, colnames(expM2)]
hd(expM_FPKM2)
dim: 59427 × 102
| TCGA-58-A46K-01A-11R-A24H-07 | TCGA-68-A59J-01A-21R-A26W-07 | TCGA-66-2753-01A-01R-0980-07 | TCGA-77-8136-01A-11R-2247-07 | TCGA-46-3765-01A-01R-0980-07 | |
|---|---|---|---|---|---|
| <dbl> | <dbl> | <dbl> | <dbl> | <dbl> | |
| 5_8S_rRNA | 0.0000000 | 0.0000000 | 0.00000000 | 0.0000000 | 0.0000000 |
| 5S_rRNA | 1.7187452 | 0.0000000 | 0.63133714 | 0.0000000 | 0.0000000 |
| 7SK | 0.0000000 | 0.0000000 | 0.00000000 | 0.0000000 | 0.0000000 |
| A1BG | 0.1257833 | 0.1797658 | 0.08161232 | 0.2777468 | 0.1615653 |
| A1BG-AS1 | 0.8414901 | 0.9455328 | 0.87018715 | 1.5912964 | 0.5865966 |
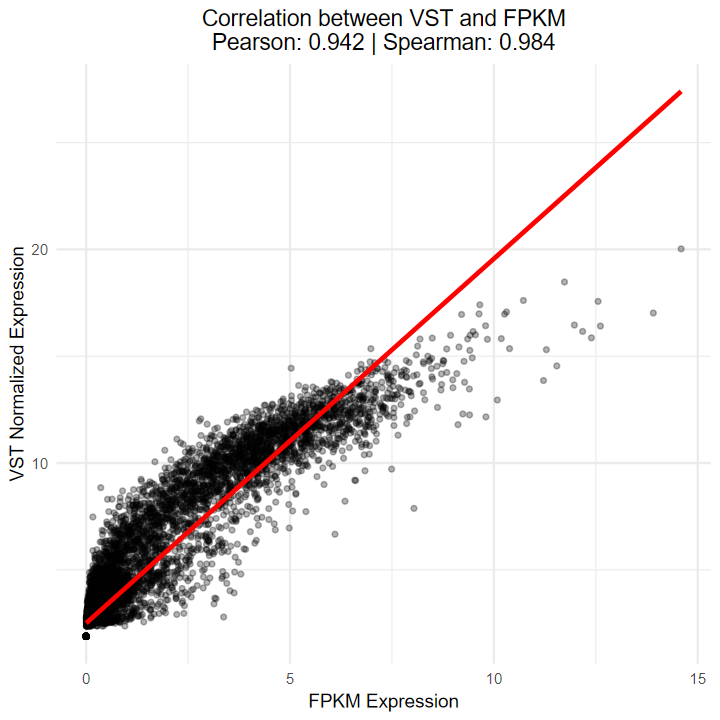
- 测试vst算法与TCGA官网提供的FPKM的相关性
- 结果显示Sperman相关性达到0.984, 说明相关性极高, 可以等价
# 加载必需的包(确保版本兼容)
if (!require("dplyr", quietly = TRUE)) {install.packages("dplyr")library(dplyr)
}
if (!require("ggplot2", quietly = TRUE)) {install.packages("ggplot2")library(ggplot2)
}# 确保两个矩阵的基因和样本匹配
common_genes <- intersect(rownames(expM_vst), rownames(expM_FPKM2))
common_samples <- intersect(colnames(expM_vst), colnames(expM_FPKM2))expM_vst_filtered <- expM_vst[common_genes, common_samples]
expM_FPKM_filtered <- expM_FPKM2[common_genes, common_samples]# 转换为长格式(不使用rownames_to_column)
# 处理VST数据:手动添加基因名列
vst_df <- as.data.frame(expM_vst_filtered)
vst_df$gene <- rownames(vst_df)  # 手动将行名转为gene列
vst_long <- tidyr::pivot_longer(vst_df, cols = -gene, names_to = "sample", values_to = "vst_value")# 处理FPKM数据:手动添加基因名列
fpkm_df <- as.data.frame(expM_FPKM_filtered)
fpkm_df$gene <- rownames(fpkm_df)  # 手动将行名转为gene列
fpkm_long <- tidyr::pivot_longer(fpkm_df, cols = -gene, names_to = "sample", values_to = "fpkm_value")# 合并数据
combined_data <- inner_join(vst_long, fpkm_long, by = c("gene", "sample"))# 计算相关性
cor_pearson <- cor(combined_data$vst_value, combined_data$fpkm_value, method = "pearson")
cor_spearman <- cor(combined_data$vst_value, combined_data$fpkm_value, method = "spearman")
hd(combined_data)
dim: 6061554 × 4
| gene | sample | vst_value | fpkm_value | |
|---|---|---|---|---|
| <chr> | <chr> | <dbl> | <dbl> | |
| 1 | 5_8S_rRNA | TCGA-58-A46K-01A-11R-A24H-07 | 1.885298 | 0 |
| 2 | 5_8S_rRNA | TCGA-68-A59J-01A-21R-A26W-07 | 1.885298 | 0 |
| 3 | 5_8S_rRNA | TCGA-66-2753-01A-01R-0980-07 | 1.885298 | 0 |
| 4 | 5_8S_rRNA | TCGA-77-8136-01A-11R-2247-07 | 1.885298 | 0 |
| 5 | 5_8S_rRNA | TCGA-46-3765-01A-01R-0980-07 | 1.885298 | 0 |
# 绘制散点图
set.seed(1234)
combined_data = data.frame(combined_data)
combined_data2 = combined_data[sample(1:nrow(combined_data), 10000), ]
# 计算相关性
cor_pearson <- cor(combined_data2$vst_value, combined_data2$fpkm_value, method = "pearson")
cor_spearman <- cor(combined_data2$vst_value, combined_data2$fpkm_value, method = "spearman")
ggplot(combined_data2, aes(x = fpkm_value, y = vst_value)) +geom_point(alpha = 0.3, size = 1) +geom_smooth(method = "lm", color = "red", se = FALSE) +labs(x = "FPKM Expression",y = "VST Normalized Expression",title = paste0("Correlation between VST and FPKM\n","Pearson: ", round(cor_pearson, 3), " | ","Spearman: ", round(cor_spearman, 3))) +theme_minimal() +theme(plot.title = element_text(hjust = 0.5))
[1m[22m`geom_smooth()` using formula = 'y ~ x'
- 绘制的热图也看不出差异
plot_heatmap_DEG(expM_vst, DEG_tb_count, group2)
plot_heatmap_DEG(expM_FPKM2, DEG_tb_count, group2)
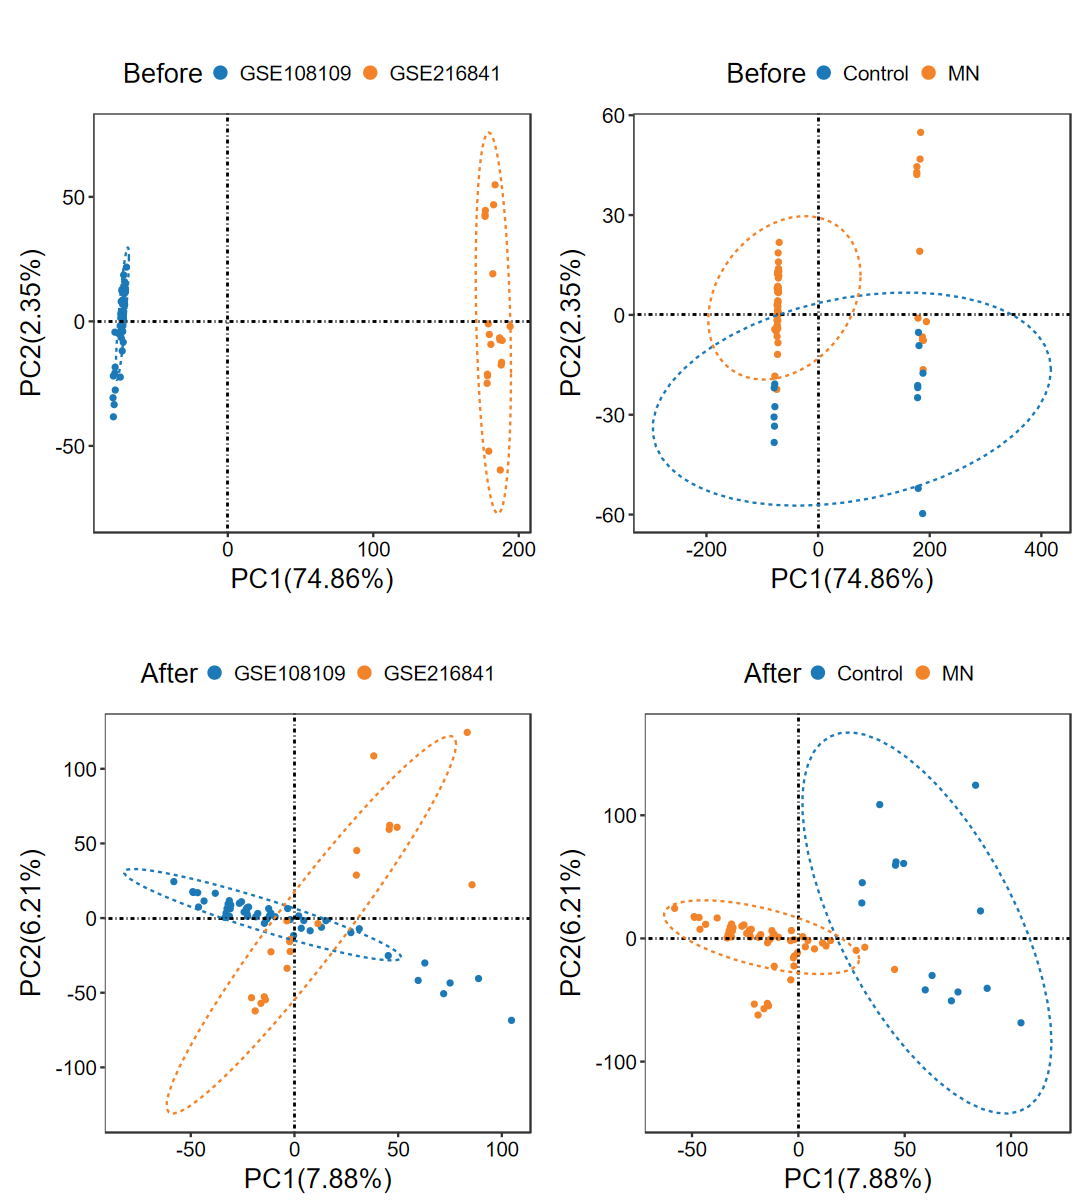
run_ComBat
- 去除多个数据集之间的批次效应, 并绘制去批次前后的PCA图
# 下载处理 GSE108109 芯片数据
obj = download_GEO("GSE108109", out_dir = "./test/run_ComBat")
INFO [2025-08-02 21:47:24] Step1: Download GEO data ...
INFO [2025-08-02 21:47:24] Querying dataset: GSE108109 ...- Use local curl- Found 1 GPL- Found 111 samples, 34 metas.- Writting sample_anno to ./test/run_ComBat/GSE108109_sample_anno.csv - Normalize between arrays ...- Successed, file save to ./test/run_ComBat/GSE108109_GPL19983.RData.
INFO [2025-08-02 21:47:35] Step2: Annotate probe GPL19983 ...
INFO [2025-08-02 21:47:36] Use built-in annotation file ...
- All porbes matched!
- Warnning: 732/25582 probes fail to annotated!
INFO [2025-08-02 21:47:36] Removing duplicated genes by method: max ...
INFO [2025-08-02 21:48:01] Done.
obj_list = get_GEO_group(obj, group_name = "source_name_ch1","Membranous Nephropathy" = "MN","Living donor" = "Control")
expM_GSE108109 = obj_list$expM
group_GSE108109 = obj_list$group
#下载处理 GSE216841 高通量
sample_anno = get_GEO_pheno("GSE216841")
INFO [2025-08-02 21:52:25] Querying dataset: GSE216841 ...- Use local curl- Found 1 GPL- Found 34 samples, 40 metas.- Writting sample_anno to 00_GEO_data/GSE216841_sample_anno.csv - Can't found expression profile, please seehttps://www.ncbi.nlm.nih.gov/geo/query/acc.cgi?acc=GSE216841 - Return sample annotation!
hd(sample_anno)
dim: 34 × 40
| title | geo_accession | status | submission_date | last_update_date | |
|---|---|---|---|---|---|
| <chr> | <chr> | <chr> | <chr> | <chr> | |
| GSM6696604 | Normal control 1 | GSM6696604 | Public on Jan 25 2023 | Oct 28 2022 | Jan 25 2023 |
| GSM6696605 | Normal control 2 | GSM6696605 | Public on Jan 25 2023 | Oct 28 2022 | Jan 25 2023 |
| GSM6696606 | Normal control 3 | GSM6696606 | Public on Jan 25 2023 | Oct 28 2022 | Jan 25 2023 |
| GSM6696607 | Normal control 4 | GSM6696607 | Public on Jan 25 2023 | Oct 28 2022 | Jan 25 2023 |
| GSM6696608 | Normal control 5 | GSM6696608 | Public on Jan 25 2023 | Oct 28 2022 | Jan 25 2023 |
expM_raw = read.faster("./test/run_ComBat/GSE216841_MNd_ncounts_annot.txt.gz")
hd(expM_raw)
dim: 20321 × 37
| ensembl_gene_id | hgnc_GRCh38p12 | description | N_CTRL1 | N_CTRL2 | |
|---|---|---|---|---|---|
| <chr> | <chr> | <chr> | <dbl> | <dbl> | |
| ENSG00000000003 | ENSG00000000003 | TSPAN6 | tetraspanin 6 [Source:HGNC Symbol;Acc:HGNC:11858] | 92.874228 | 309.359955 |
| ENSG00000000005 | ENSG00000000005 | TNMD | tenomodulin [Source:HGNC Symbol;Acc:HGNC:17757] | 1.020596 | 1.041616 |
| ENSG00000000419 | ENSG00000000419 | DPM1 | dolichyl-phosphate mannosyltransferase subunit 1, catalytic [Source:HGNC Symbol;Acc:HGNC:3005] | 255.148977 | 1.041616 |
| ENSG00000000457 | ENSG00000000457 | SCYL3 | SCY1 like pseudokinase 3 [Source:HGNC Symbol;Acc:HGNC:19285] | 373.538103 | 887.456841 |
| ENSG00000000460 | ENSG00000000460 | C1orf112 | chromosome 1 open reading frame 112 [Source:HGNC Symbol;Acc:HGNC:25565] | 110.224358 | 289.569251 |
countM = expM_raw[, -c(1:3)]
name_list = c("N_CTRL" = "Normal control", "MEMBR" = "Idiopathic membranous nephropathy", "MCD" = "Minimal change disease")
new_name = paste(name_list[paste0(gsub("[0-9]", "", colnames(countM)))], gsub("[A-Z_]", "", colnames(countM)))
colnames(countM) = sample_anno$geo_accession[match(new_name, sample_anno$title)]
countM = ceiling(countM)
countM = data.frame(SYMBOL = expM_raw$hgnc_GRCh38p12, countM)
countM = aggregate(. ~ SYMBOL, data = countM, function(x) x[which.max(x)])
countM = col2rownames(countM)
expM = count_to_exp(countM)
converting counts to integer mode
group = subString(sample_anno[colnames(countM), "title"], -1, " ", rev = TRUE, collapse = " ")
table(group)
group
Idiopathic membranous nephropathy            Minimal change disease 12                                14 Normal control 8
SID_MN = colnames(expM)[group == "Idiopathic membranous nephropathy"]
SID_Control = colnames(expM)[group == "Normal control"]
expM_GSE216841 = expM[, c(SID_MN, SID_Control)]
group_GSE216841 = rep_by_len(c("MN", "Control"), list(SID_MN, SID_Control))
expM_list = list2(expM_GSE108109, expM_GSE216841)
names(expM_list) = subString(names(expM_list), 2, "_")
names(expM_list)
- 'GSE108109'
- 'GSE216841'
group_merge = Reduce(c, sapply(paste0("group_", names(expM_list)), get))
table(group_merge)
group_merge
Control      MN 14      56
set_image(9, 10)
obj = run_ComBat(expM_list, group_merge, out_name = "./test/run_ComBat/01_Combat")
Warning message in MASS::cov.trob(data[, vars]):
"Probable convergence failure"
Warning message in MASS::cov.trob(data[, vars]):
"Probable convergence failure"
Warning message in MASS::cov.trob(data[, vars]):
"Probable convergence failure"
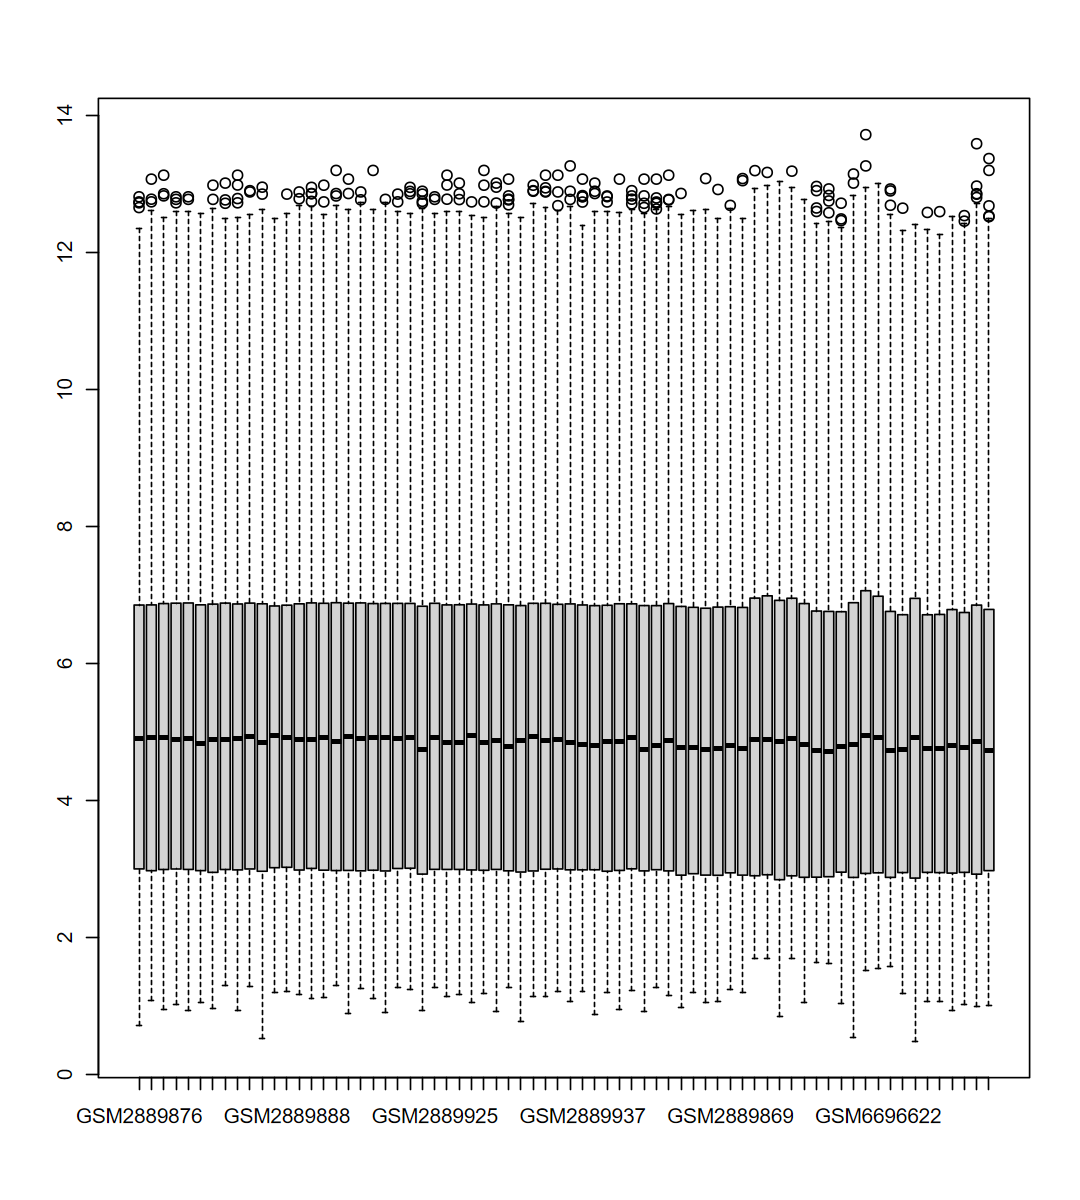
# 提取结果
expM = obj$expM
group = obj$group
boxplot(expM)
table(group)
group
Control      MN 14      56