GaussDB 数据库架构师修炼(十) 性能诊断常用视图
1 GaussDB 性能诊断视图概览
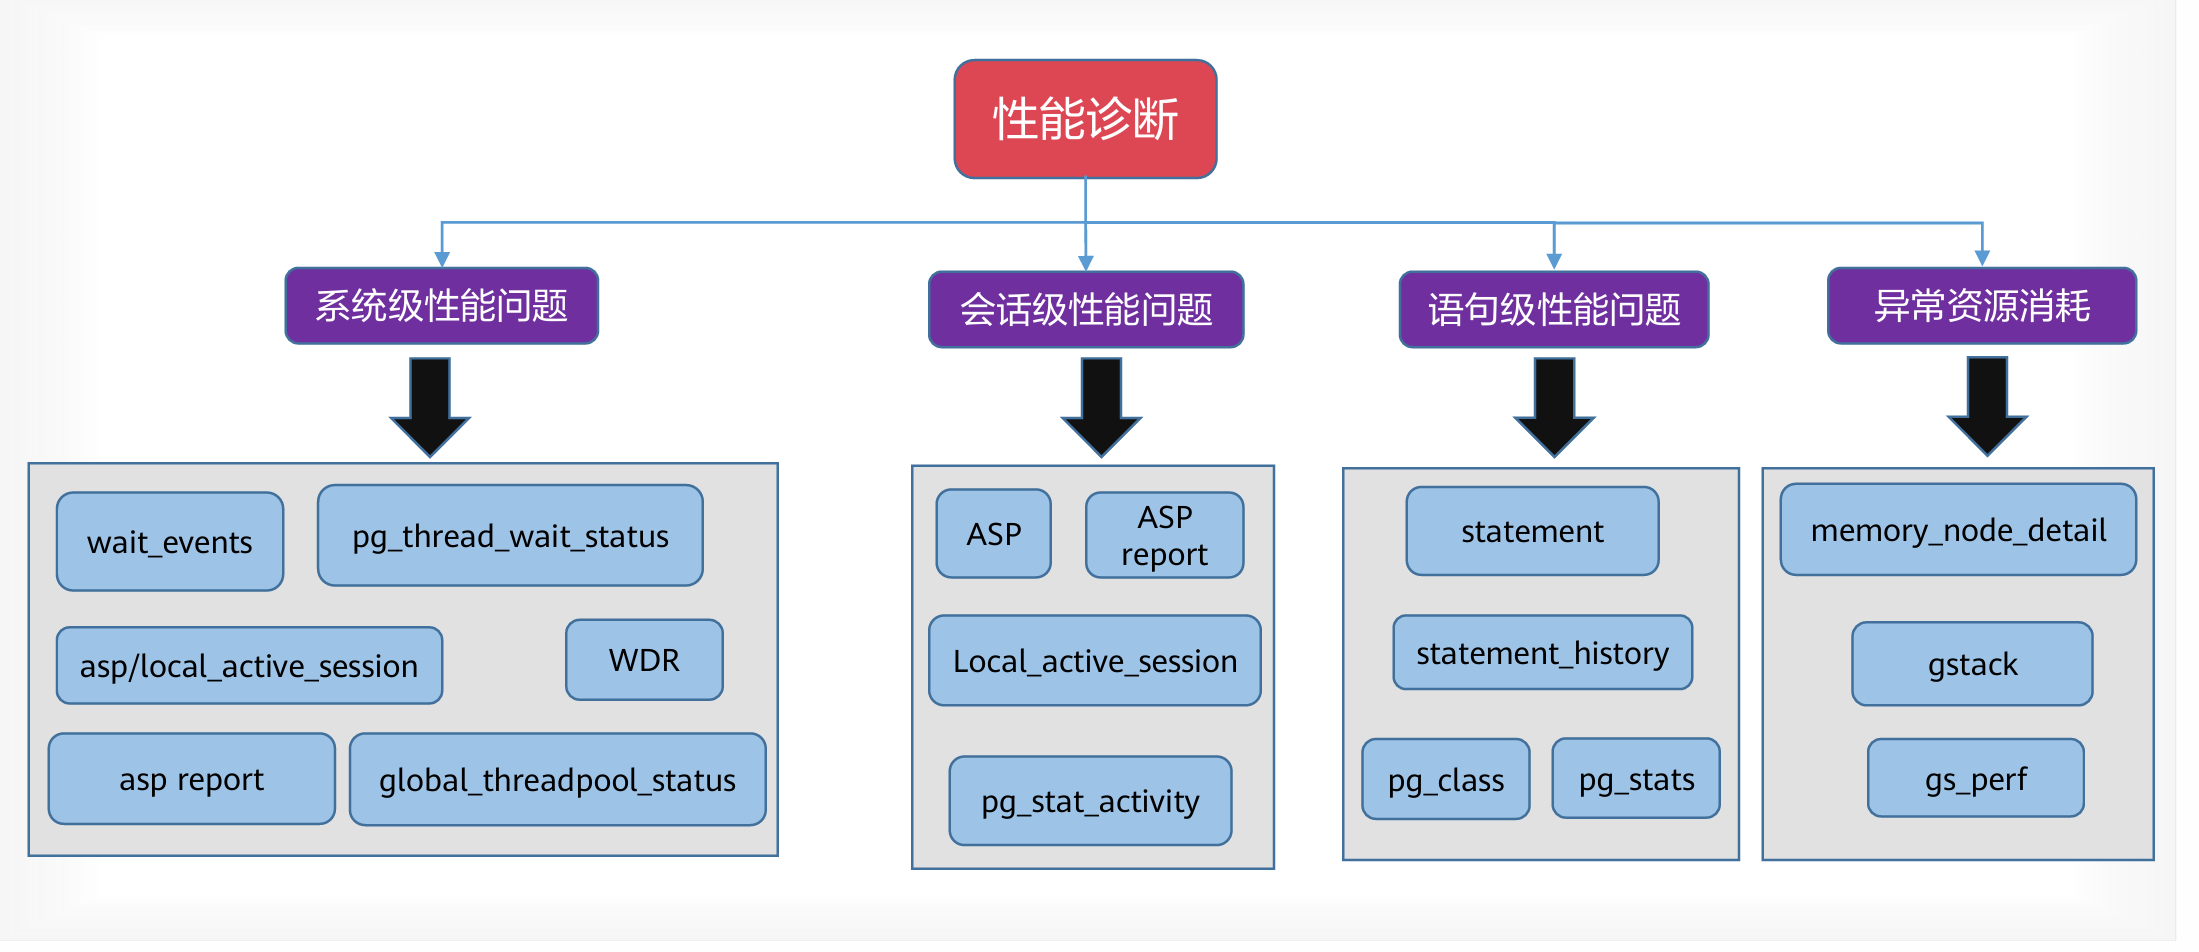
主要分为4类型,以下我们查一下每类型性能视图的详情:系统级性能、会话级性能、语句级性能、异常资源消耗
2 系统级性能视图使用
1)wait_events视图:WAIT_EVENTS显示当前节点wait event的相关统计信息,内存累积视图,重启数据丢失。
| 名称 | 类型 | 描述 |
|---|---|---|
| nodename | text | 节点名称。 |
| type | text | event类型。 |
| event | text | event名称。 |
| wait | bigint | 等待次数。 |
| failed_wait | bigint | 失败的等待次数。 |
| total_wait_time | bigint | 总等待时间(单位:微秒)。 |
| avg_wait_time | bigint | 平均等待时间(单位:微秒)。 |
| max_wait_time | bigint | 最大等待时间(单位:微秒)。 |
| min_wait_time | bigint | 最小等待时间(单位:微秒)。 |
| last_updated | timestamp with time zone | 最后一次更新该事件的时间。 |
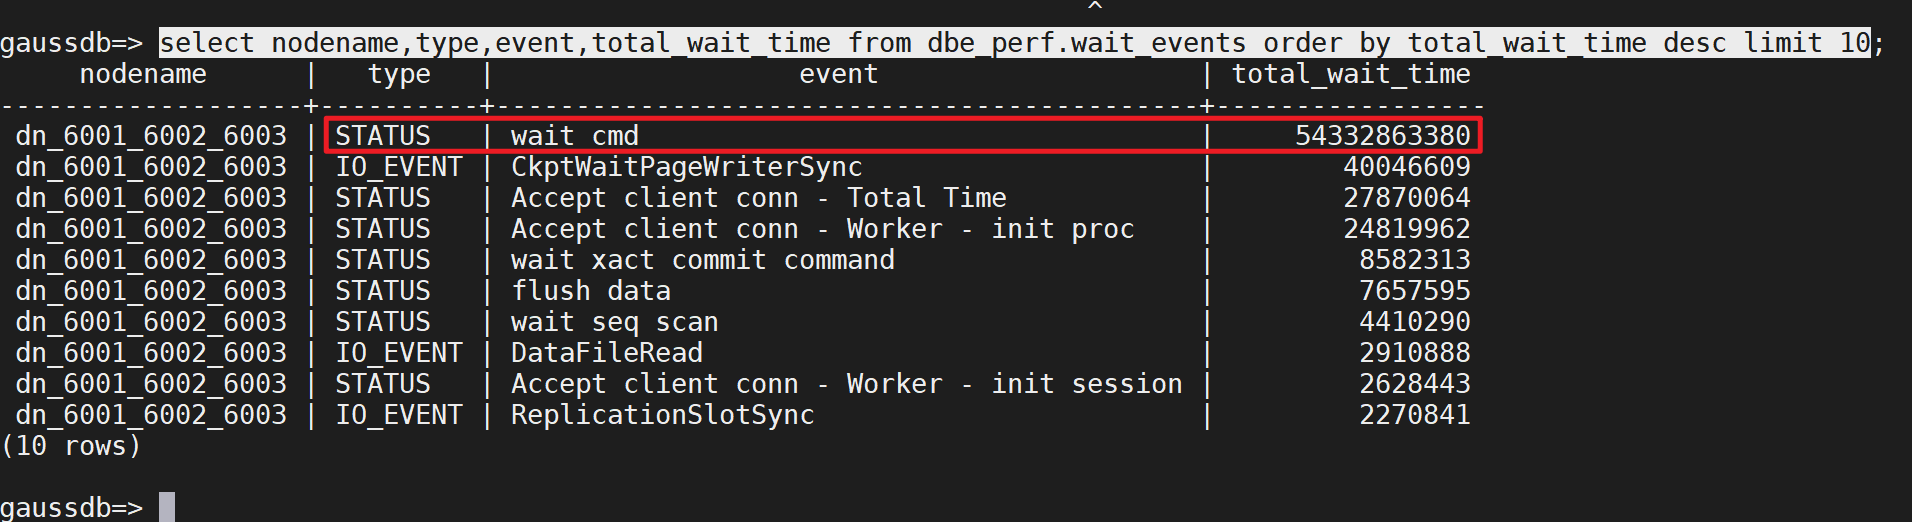
经常使用查消耗时最长的等待事件来分析根因:
select nodename,type,event,total_wait_time from dbe_perf.wait_events order by total_wait_time desc limit 10;结果:
2)pg_thread_wait_status视图
通过PG_THREAD_WAIT_STATUS视图可以检测当前实例中工作线程(backend thread)以及辅助线程(auxiliary thread)的阻塞等待情况。
| 名称 | 类型 | 描述 |
|---|---|---|
| node_name | text | 当前节点的名称。 |
| db_name | text | 数据库名称。 |
| thread_name | text | 线程名称。 |
| query_id | bigint | 查询ID,对应debug_query_id。 |
| tid | bigint | 当前线程的线程号。 |
| sessionid | bigint | 当前会话ID。 |
| lwtid | integer | 当前线程的轻量级线程号。 |
| psessionid | bigint | 父会话ID。 |
| tlevel | integer | streaming线程的层级。 |
| smpid | integer | 并行线程的ID。 |
| wait_status | text | 当前线程的等待状态。等待状态的详细信息请参见表2。 |
| wait_event | text | 如果wait_status是acquire lock、acquire lwlock、wait io三种类型,此列描述具体的锁、轻量级锁、IO的信息。否则是空。 |
| locktag | text | 当前线程正等待获取的锁的信息。 |
| lockmode | text | 当前线程正等待获取的锁的模式。包含表级锁、行级锁、页级锁下的各模式。 |
| block_sessionid | bigint | 阻塞当前线程获取锁的会话标识。 |
| global_sessionid | text | 全局会话ID。 |
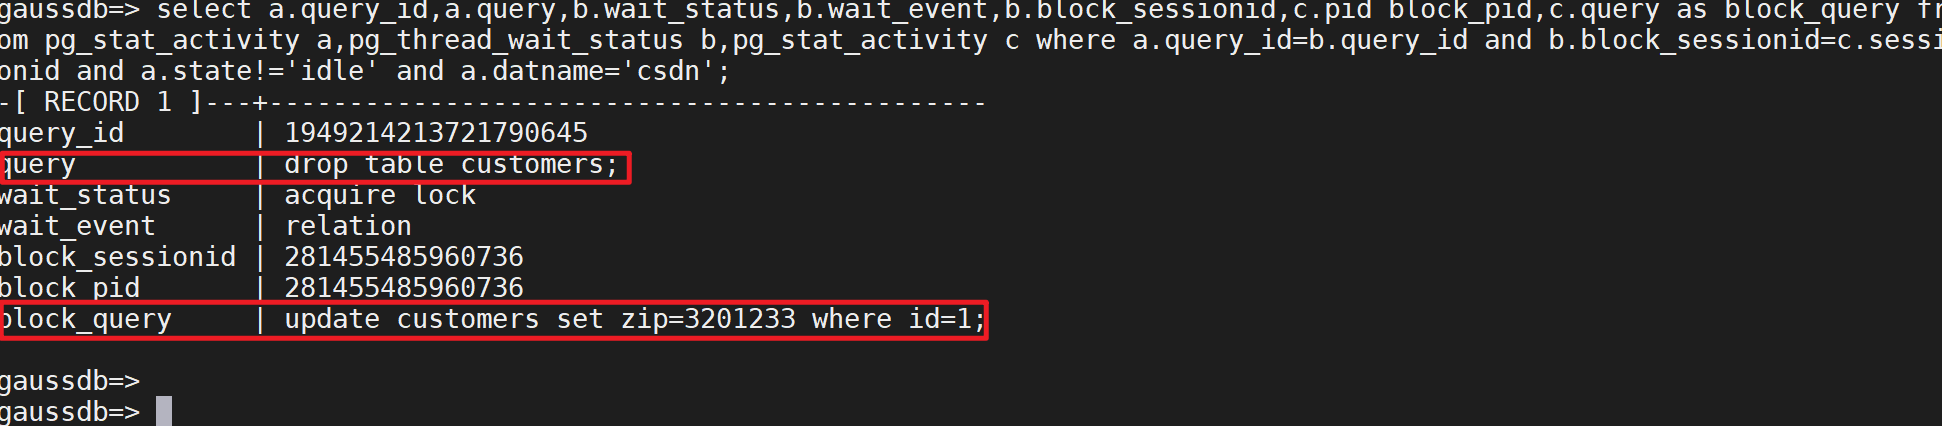
在系统性能诊断中经常与pg_stat_activity的sessionid关联,查询实时锁等待:
select a.query_id,a.query,b.wait_status,b.wait_event,b.block_sessionid,c.pid block_pid,c.query as block_query
from pg_stat_activity a,pg_thread_wait_status b,pg_stat_activity c
where a.query_id=b.query_id
and b.block_sessionid=c.sessionid
and a.state!='idle'
and a.datname='$database';
设置一个事务场景产生ddl锁。
结果:
3)历史等待事件查询: dbe_perf. local_active_session(保留10万条)、 gs_asp(保留 2天)
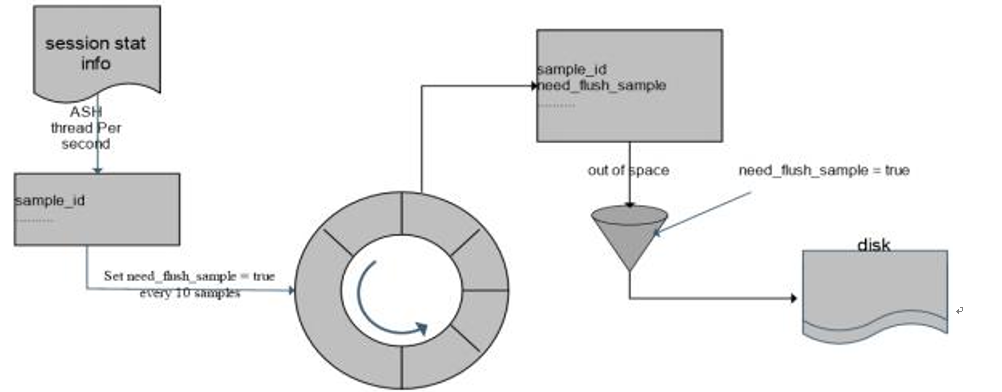
LOCAL_ACTIVE_SESSION视图显示本节点上的ACTIVE SESSION PROFILE内存中的样本
| 名称 | 类型 | 描述 |
|---|---|---|
| sampleid | bigint | 采样ID。 |
| sample_time | timestamp with time zone | 采样的时间。 |
| need_flush_sample | boolean | 该样本是否需要刷新到磁盘。 |
| databaseid | oid | 数据库ID |
| thread_id | bigint | 线程的ID。 |
| sessionid | bigint | 会话的ID。 |
| start_time | timestamp with time zone | 会话的启动时间。 |
| event | text | 具体的事件名称。 |
| lwtid | integer | 当前线程的轻量级线程号。 |
| psessionid | bigint | streaming线程的父线程。 |
| tlevel | integer | streaming线程的层级。与执行计划的层级(id)相对应。 |
| smpid | integer | smp执行模式下并行线程的并行编号。 |
| userid | oid | session用户的id。 |
| application_name | text | 应用的名称。 |
| client_addr | inet | client端的地址。 |
| client_hostname | text | client端的名称。 |
| client_port | integer | 客户端用于与后端通讯的TCP端口号。 |
| query_id | bigint | debug query id。 |
| unique_query_id | bigint | unique query id。 |
| user_id | oid | unique query的key中的user_id。 |
| cn_id | integer | cn id,在DN上表示下发该unique sql的节点id,unique query的key中的cn_id。 |
| unique_query | text | 规范化后的UniqueSQL文本串。 |
| locktag | text | 会话等待锁信息,可通过locktag_decode解析。 |
| lockmode | text | 会话等待锁模式。 |
| block_sessionid | bigint | 如果会话正在等待锁,阻塞该会话获取锁的会话标识。 |
| final_block_sessionid | bigint | 表示源头阻塞会话id。 |
| wait_status | text | 描述event列的更多详细信息。 |
| global_sessionid | text | 全局会话ID |
| xact_start_time | timestamp with time zone | 事务开始时间。 |
| query_start_time | timestamp with time zone | 语句开始执行时间。 |
| state | text | 当前语句状态。 可能取值为:active, idle in transaction, fastpath function call, idle in transaction (aborted), disabled, retrying。 |
查询数据库2H内的等待事件
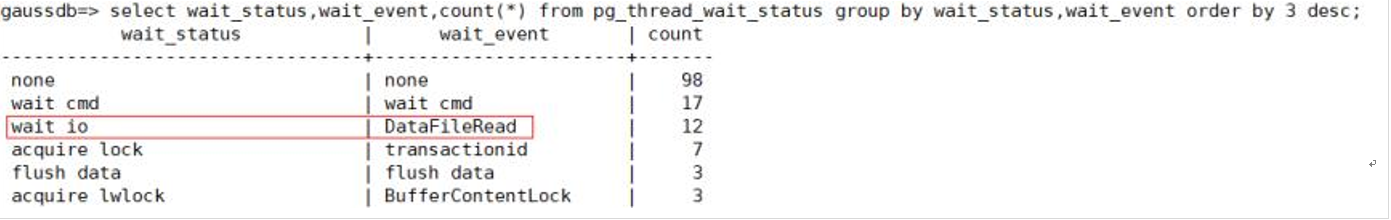
select wait_status,event,count (*)  from dbe_perf.local_active_session where sample_time  between '2025-07-29
20:30:00'  and '2025-07-29 20:50:00'  group  by wait_status,event  order  by 3 desc;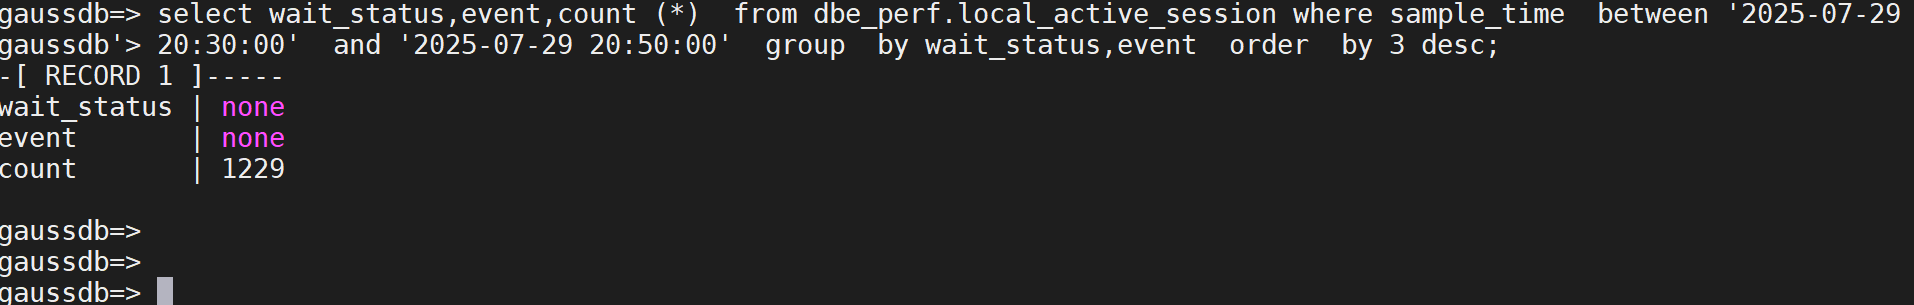
通过占比较高的等待事件,帮助判断数据库性能存在瓶颈的点。客户在做性能压测,如下图,查看数据库的等待事件可以发现数据库读取磁盘数据页面的IO 类等待事件较多。需要排查数据库需要大量从磁盘读数据是否正常,比如是否存在大量消耗IO高的SQL语句。或者数据库节点磁盘本身IO能力是否存在性能
问题。
3 会话级性能视图使用
- Active Session Profile ( local_active_session 、gs_asp):保存活跃会话概要信息,通过采样实例活跃会话的状态信息,低成本复现过去一段时间的系统活动。主要包含会话基本信息,会话事务,语句,等待事件, 会话状态( active 、idle等),当前正阻塞在哪个事件上,正在等待哪个 锁,或被哪个会话阻塞。
- Local_active_session的默认采样频率是1s,内存视图;ASP的默认采样 比例是1/10,持久化在存储。
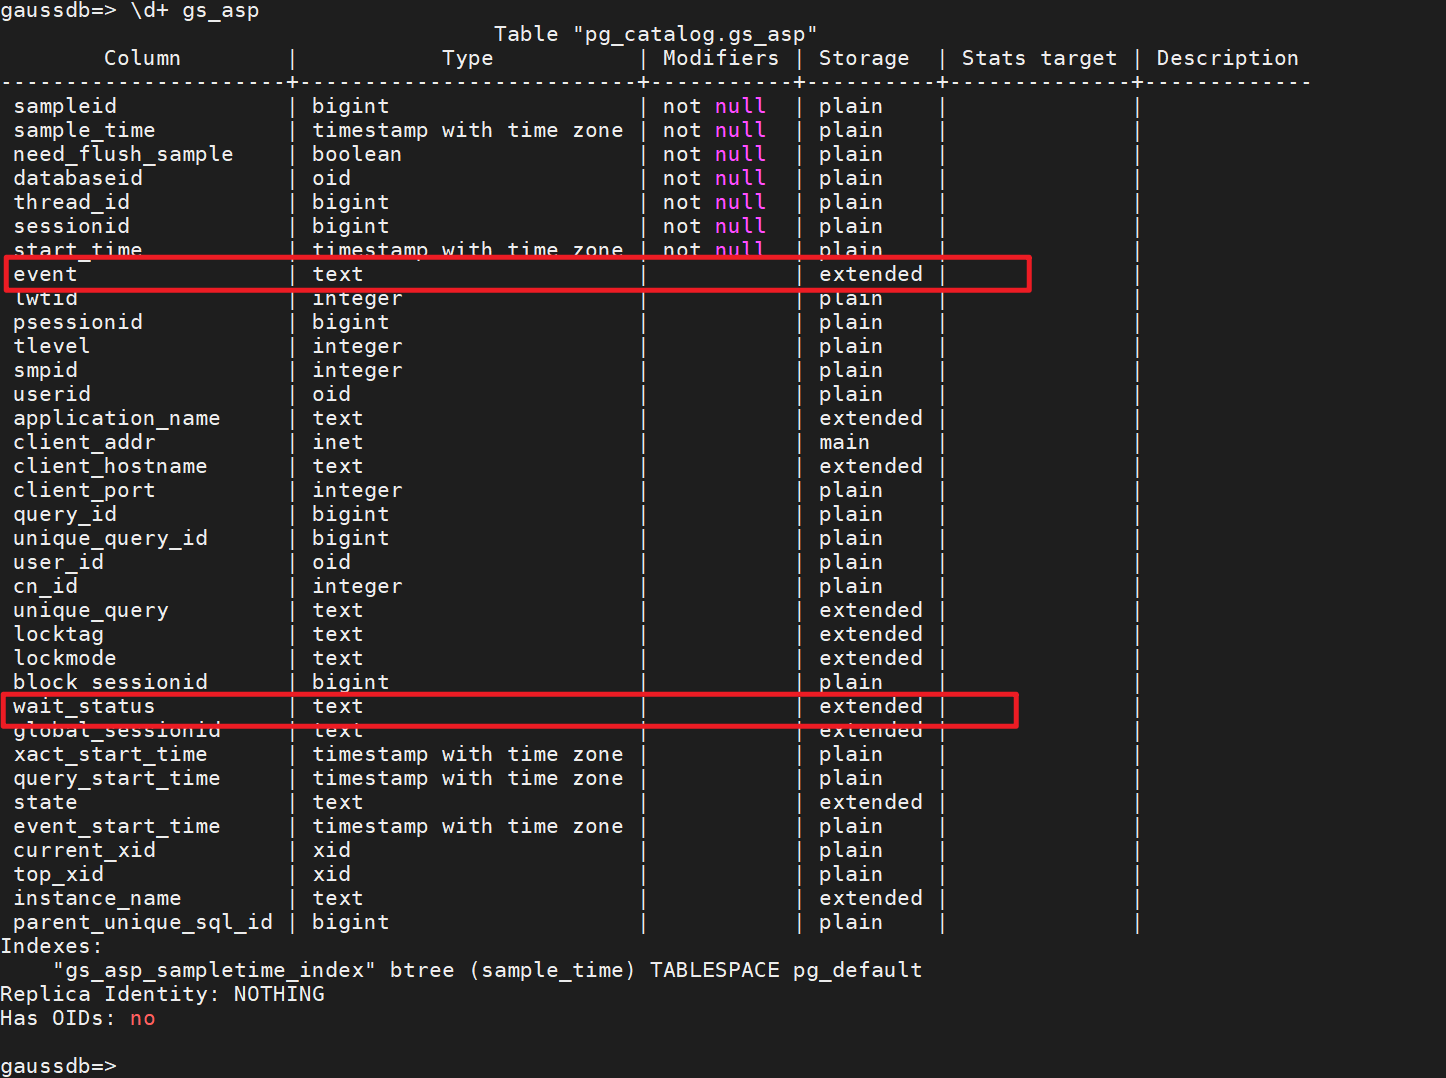
1) gs_asp视图
GS_ASP显示被持久化的ACTIVE SESSION PROFILE样本
| 名称 | 类型 | 描述 |
|---|---|---|
| sampleid | bigint | 采样ID。 |
| sample_time | timestamp with time zone | 采样的时间。 |
| need_flush_sample | boolean | 该样本是否需要刷新到磁盘。
|
| databaseid | oid | 数据库ID。 |
| thread_id | bigint | 线程的ID。 |
| sessionid | bigint | 会话的ID。 |
| start_time | timestamp with time zone | 会话的启动时间。 |
| event | text | 具体的事件名称。 |
| lwtid | integer | 当前线程的轻量级线程号。 |
| psessionid | bigint | streaming线程的父线程。 |
| tlevel | integer | streaming线程的层级。与执行计划的层级(id)相对应。 |
| smpid | integer | smp执行模式下并行线程的并行编号。 |
| userid | oid | session用户的id。 |
| application_name | text | 应用的名字。 |
| client_addr | inet | client端的地址。 |
| client_hostname | text | client端的名字。 |
| client_port | integer | 客户端用于与后端通讯的TCP端口号。 |
| query_id | bigint | debug query id。 |
| unique_query_id | bigint | unique query id。 |
| user_id | oid | unique query的key中的user_id。 |
| cn_id | integer | 表示该unique sql来自哪个CN节点。unique query的key中的cn_id。 |
| unique_query | text | -规范化后的Unique SQL文本串。 |
| locktag | text | 会话等待锁信息,可通过locktag_decode解析。 |
| lockmode | text | 会话等待锁模式:
|
| block_sessionid | bigint | 如果会话正在等待锁,阻塞该会话获取锁的会话标识。 |
| wait_status | text | 描述event列的更多详细信息。 |
| global_sessionid | text | 全局会话ID。 |
| xact_start_time | timestamp with time zone | 事务开始时间。 |
| query_start_time | timestamp with time zone | 语句开始执行时间。 |
| state | text | 当前语句状态。 可能取值为:active、idle in transaction、fastpath function call、idle in transaction (aborted)、disabled、retrying。 |
可以通过视图获取如下信息:
 最近用户session最耗资源的的事件
 最近执行时间/执行次数最多的是哪些SQL
 最近阻塞其他session最多的session
 最近比较占资源的session/SQL把资源都消耗在哪些event上
 最近最耗资源的用户的信息
2)实时会话视图
pg ( pgxc)_stat_activity:获取实时系统活跃会话列表,包括会话基本信息、会话事务、语句、等待状态、会话状态( active 、idle等)。用于分析当前系统活跃用户的活动信息,比如从语句的开始时间判断当前事务的执行时长,当前数 据库正在执行哪些SQL语句,是否存在大事务,会话所处的运行状态等等:
| 名称 | 类型 | 描述 |
|---|---|---|
| datid | oid | 用户会话在后台连接到的数据库OID。 |
| datname | name | 用户会话在后台连接到的数据库名称。 |
| pid | bigint | 后台线程ID。 |
| sessionid | bigint | 会话ID。 |
| usesysid | oid | 登录该后台的用户OID。 |
| usename | name | 登录该后台的用户名。 |
| application_name | text | 连接到该后台的应用名。 |
| client_addr | inet | 连接到该后台的客户端的IP地址。 如果此字段是null,表明通过服务器机器上Unix套接字连接客户端,或是内部进程,如AutoVacuum。 |
| client_hostname | text | 客户端的主机名,该字段通过client_addr的反向DNS查找获取。该字段只有在启动log_hostname且使用IP连接时才非空。 |
| client_port | integer | 客户端用于与后台通讯的TCP端口号,如果使用Unix套接字,则为-1。 |
| backend_start | timestamp with time zone | 客户端连接服务器时,该过程开始的时间。 |
| xact_start | timestamp with time zone | 启动当前事务的时间。如果没有事务是活跃的,则为null。如果当前查询是首个事务,则该列等同于query_start列。 |
| query_start | timestamp with time zone | 开始当前活跃查询的时间。如果state的值不是active,则该值是上一个查询的开始时间。如果是存储过程、函数、package,则查询的是第一个查询时间,不会随着存储过程内语句运行而改变。 |
| state_change | timestamp with time zone | 上次状态改变的时间。 |
| waiting | boolean | 如果后台当前正等待锁则为true。 |
| enqueue | text | 该字段不支持。 |
| state | text | 该后台当前总体状态。取值范围:
|
| resource_pool | name | 用户使用的资源池。 |
| query_id | bigint | 查询语句的ID。 |
| query | text | 该后台的最新查询。如果state状态是active(活跃的),此字段显示当前正在执行的查询。所有其他情况表示上一个查询。 |
| connection_info | text | JSON格式字符串,记录当前连接数据库的驱动类型、驱动版本号、当前驱动的部署路径、进程属主用户等信息。 |
| unique_sql_id | bigint | 语句的unique sql id。 |
| trace_id | text | 驱动传入的trace id,与应用的一次请求相关联。 |
| top_xid | xid | 事务的顶层事务号。 |
| current_xid | xid | 事务的当前事务号。 |
| xlog_quantity | bigint | 事务当前使用的XLOG量,单位为字节。 |
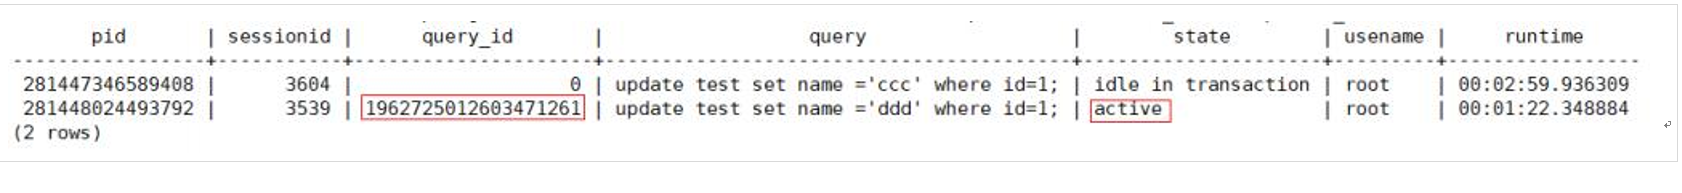
查询当前数据库中存在的长事务
select  pid, sessionid, substring(query,0,100) as query, state, usename, now()-xact_start as runtime
from pg_stat_activity
where state!='idle' and datname in('csdn')
and usename in  ('csdn')
and extract(epoch from current_timestamp-xact_start)/60 > 1 ;
以上执行结果:
4 语句级性能视图使用
1)STATEMENT/SUMMARY_STATEMENT:
DDL ,DML( select ,insert ,update ,delete ),DCL语句的分布比率,帮助建立负载特征模型,预警负载异常变动。 语句级别(归一化SQL,模板SQL)的响应时间,执行次数,行活动,软硬解析比,时间模型,网络开销,排序性能(时间,内存,溢出),执行器HASH性 能(时间,内存,溢出)。据此可以识别热点语句,定位语句性能瓶颈,建立语句性能基线,以低成本预警语句性能变化。
2)常见性能指标分析:
total_elapse_time/n_calls:SQL平均执行时间。
plan_time/n_hard_parse占比高,SQL过多使用硬解析,可能应用逻辑未使用PBE。
n_tuples_returned:顺序扫描的行数,该指标大表示语句未正确使用索引。
n_tuples_fetched/n_tuples_returned:异常扫描行,排查SQL逻辑,或者是否表的死元组过多。
n_blocks_fetched:过多逻辑读,排查SQL逻辑和执行计划是否可优化。
n_blocks_fetched-n_blocks_hit:异常SQL磁盘读,排查SQL逻辑和数据库的buffer是否足够。
data_io_time:异常SQL IO耗时。
sort_time/sort_spill_count:排序的耗时,以及排序操作落盘的次数,判断语句排序的性能是否正常。
3) STATEMENT视图结构
获得当前节点的执行语句(归一化SQL)的信息。数据库主节点上可以看到此数据库主节点接收到的归一化的SQL的全量统计信息(包含数据库节点);数据库节点上仅可看到归一化的SQL的此节点执行的统计信息。
| 名称 | 类型 | 描述 |
|---|---|---|
| node_name | name | 数据库进程名称。 |
| node_id | integer | 节点的ID。 |
| user_name | name | 用户名称。 |
| user_id | oid | 用户OID。 |
| unique_sql_id | bigint | 归一化的SQL ID。 |
| query | text | 归一化的SQL。 备注:长度受track_activity_query_size控制。 |
| n_calls | bigint | 调用次数。 |
| min_elapse_time | bigint | SQL在内核内的最小运行时间(单位:微秒)。 |
| max_elapse_time | bigint | SQL在内核内的最大运行时间(单位:微秒)。 |
| total_elapse_time | bigint | SQL在内核内的总运行时间(单位:微秒)。 |
| n_returned_rows | bigint | SELECT返回的结果集行数。 |
| n_tuples_fetched | bigint | 随机扫描行。 |
| n_tuples_returned | bigint | 顺序扫描行。 |
| n_tuples_inserted | bigint | 插入行。 |
| n_tuples_updated | bigint | 更新行。 |
| n_tuples_deleted | bigint | 删除行。 |
| n_blocks_fetched | bigint | buffer的块访问次数。 |
| n_blocks_hit | bigint | buffer的块命中次数。 |
| n_soft_parse | bigint | 软解析次数,n_soft_parse + n_hard_parse可能大于n_calls,因为子查询未计入n_calls。 |
| n_hard_parse | bigint | 硬解析次数,n_soft_parse + n_hard_parse可能大于n_calls,因为子查询未计入n_calls。 |
| db_time | bigint | 有效的DB时间花费,多线程将累加(单位:微秒)。 |
| cpu_time | bigint | CPU时间(单位:微秒)。 |
| execution_time | bigint | 执行器内执行时间(单位:微秒)。 |
| parse_time | bigint | SQL解析时间(单位:微秒)。 |
| plan_time | bigint | SQL生成计划时间(单位:微秒)。 |
| rewrite_time | bigint | SQL重写时间(单位:微秒)。 |
| pl_execution_time | bigint | plpgsql上的执行时间(单位:微秒)。 |
| pl_compilation_time | bigint | plpgsql上的编译时间(单位:微秒)。 |
| data_io_time | bigint | IO上的时间花费(单位:微秒)。 |
| net_send_info | text | 通过物理连接发送消息的网络状态,包含时间(微秒)、调用次数、吞吐量(字节)。单机模式下不支持该字段。 |
| net_recv_info | text | 通过物理连接接收消息的网络状态,包含时间(微秒)、调用次数、吞吐量(字节)。单机模式下不支持该字段。 |
| net_stream_send_info | text | 通过逻辑连接发送消息的网络状态,包含时间(微秒)、调用次数、吞吐量(字节)。单机模式下不支持该字段。 |
| net_stream_recv_info | text | 通过逻辑连接接收消息的网络状态,包含时间(微秒)、调用次数、吞吐量(字节)。单机模式下不支持该字段。 |
| last_updated | timestamp with time zone | 最后一次更新该语句的时间。 |
| sort_count | bigint | 排序执行的次数。 |
| sort_time | bigint | 排序执行的时间(单位:微秒)。 |
| sort_mem_used | bigint | 排序过程中使用的work memory大小(单位:KB)。 |
| sort_spill_count | bigint | 排序过程中,若发生落盘,写文件的次数。 |
| sort_spill_size | bigint | 排序过程中,若发生落盘,使用的文件大小(单位:KB)。 |
| hash_count | bigint | hash执行的次数。 |
| hash_time | bigint | hash执行的时间(单位:微秒)。 |
| hash_mem_used | bigint | hash过程中使用的work memory大小(单位:KB)。 |
| hash_spill_count | bigint | hash过程中,若发生落盘,写文件的次数。 |
| hash_spill_size | bigint | hash过程中,若发生落盘,使用的文件大小(单位:KB)。 |
| parent_unique_sql_id | bigint | 父语句的unique_sql_id,非存储过程子语句该值为0。 |
步骤1:查询数据库中平均耗时高的业务SQL语句
select  unique_sql_id,n_calls,total_elapse_time/n_calls/1000  avg_time,total_elapse_time from dbe_perf.statement t
where   n_calls>100 order  by 3 desc limit 10;
步骤2:查询出的TOP SQL的语句的信息,结合数据库的归一化 视图可以分析该SQL语句的执行情况
select * from dbe_perf.statement where unique_sql_id=2415628201;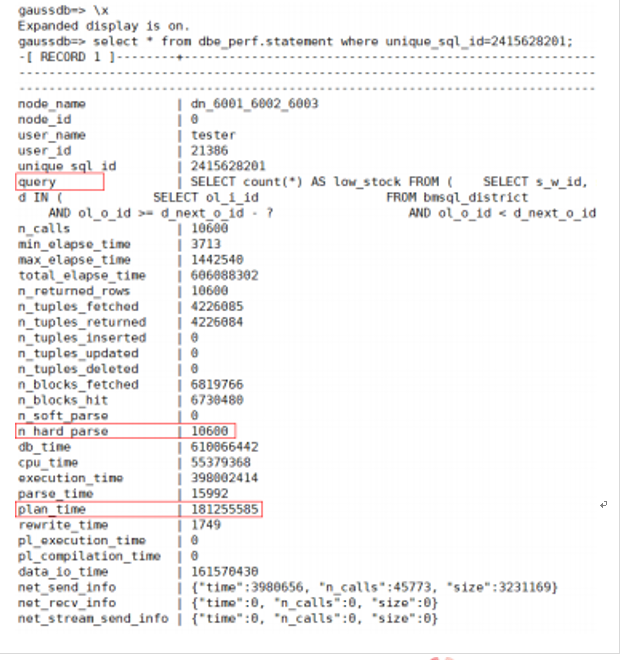
以上结果:
可以看到该SQL语句在数据库中全部是硬解析 ( n_soft_parse次数为0)。
l进一步分析该SQL的时间消耗情况, plan_time占比很高,由此可以 定位到本次业务性能问题的根因。
通常SQL大量硬解析,是因为业务SQL没有使用PBE模式,需要应用 优化代码逻辑。
4) Full(Slow) SQL
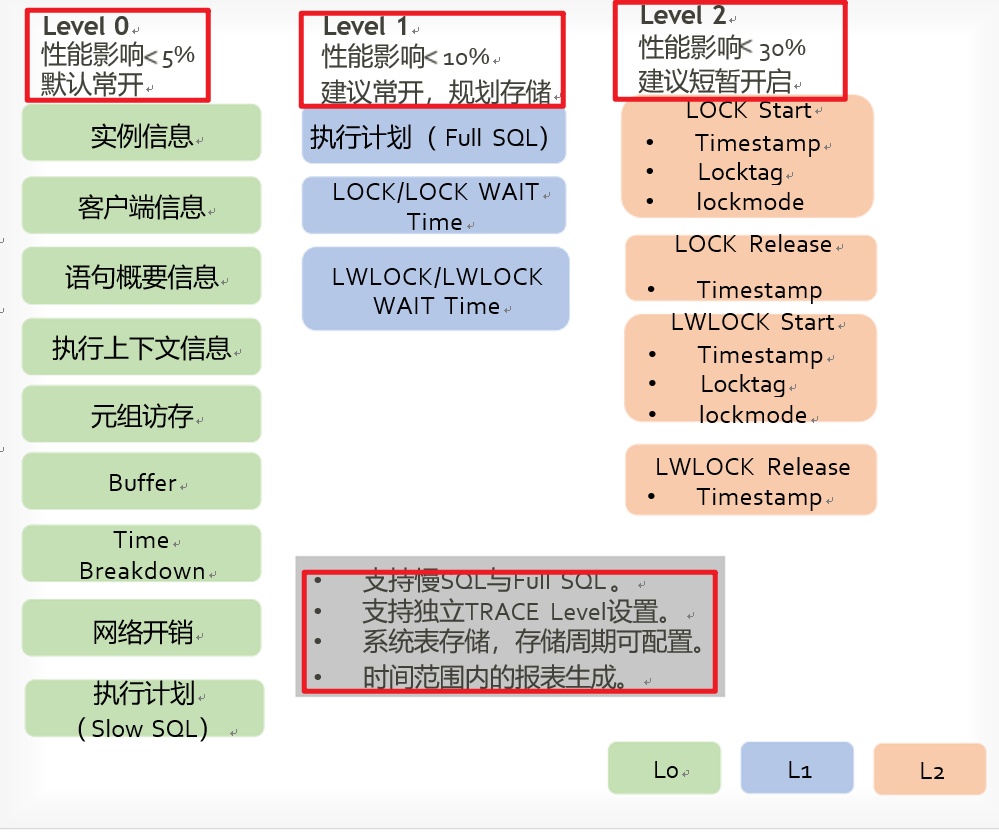
- statement_history视图,记录全量SQL信息,分为L0 、L1 、 L2三个等级,相比于statement视图,还额外提供了详细加放锁信息,可以诊断到单语句级别的性能波动。该视图默认只记录执行时间超过阈值(3秒) 的SQL信息。通过全量SQL,可以得到整个系统所有语句的执行流水以及 他们的详细性能数据(持久化的) 。
statement_history视图说明
获得当前节点的执行语句的信息。查询系统表必须具有sysadmin权限。只可在系统库中查询到结果,用户库中无法查询。
对于此系统表查询有如下约束:
- 必须在postgres库内查询,其它库中不存数据。
- 此系统表受track_stmt_stat_level控制,默认为"OFF,L0",第一部分控制Full SQL,第二部分控制Slow SQL,具体字段记录级别见下表。考虑性能影响,更改该参数的值时建议通过set方式设置,使该参数仅对当前会话生效。
- 对于Slow SQL,当track_stmt_stat_level的值为非OFF时,且SQL执行时间超过log_min_duration_statement,会记录为慢SQL。
| 名称 | 类型 | 描述 | 记录级别 |
|---|---|---|---|
| db_name | name | 数据库名称。 | L0 |
| schema_name | name | schema名称。 | L0 |
| origin_node | integer | 节点名称。 | L0 |
| user_name | name | 用户名。 | L0 |
| application_name | text | 用户发起的请求的应用程序名称。 | L0 |
| client_addr | text | 用户发起的请求的客户端地址。 | L0 |
| client_port | integer | 用户发起的请求的客户端端口。 | L0 |
| unique_query_id | bigint | 归一化SQL ID。 | L0 |
| debug_query_id | bigint | 唯一SQL ID。部分语句存在不唯一的情况,如Parse报文、DCL和TCL等语句的debug_query_id值为0。 | L0 |
| query | text | 归一化SQL(仅在CN上有值),track_stmt_parameter参数开启时,显示完整SQL。 | L0 |
| start_time | timestamp with time zone | 语句启动的时间。 | L0 |
| finish_time | timestamp with time zone | 语句结束的时间。 | L0 |
| slow_sql_threshold | bigint | 语句执行时慢SQL的标准。 | L0 |
| transaction_id | bigint | 事务ID。 | L0 |
| thread_id | bigint | 执行线程ID。 | L0 |
| session_id | bigint | 用户session id。 | L0 |
| n_soft_parse | bigint | 软解析次数, n_soft_parse + n_hard_parse可能大于n_calls, 因为子查询未计入n_calls。 | L0 |
| n_hard_parse | bigint | 硬解析次数, n_soft_parse + n_hard_parse可能大于n_calls, 因为子查询未计入n_calls。 | L0 |
| query_plan | text | 语句执行计划。对于Slow SQL的query_plan,execution_time大于slow_sql_threshold时记录,发生死锁等场景query_plan有可能为空。 | L0 |
| n_returned_rows | bigint | SELECT返回的结果集行数。 | L0 |
| n_tuples_fetched | bigint | 随机扫描行。 | L0 |
| n_tuples_returned | bigint | 顺序扫描行。 | L0 |
| n_tuples_inserted | bigint | 插入行。 | L0 |
| n_tuples_updated | bigint | 更新行。 | L0 |
| n_tuples_deleted | bigint | 删除行。 | L0 |
| n_blocks_fetched | bigint | buffer的块访问次数。 | L0 |
| n_blocks_hit | bigint | buffer的块命中次数。 | L0 |
| db_time | bigint | 有效的DB时间花费,多线程将累加(单位:微秒)。 | L0 |
| cpu_time | bigint | CPU时间(单位:微秒)。 | L0 |
| execution_time | bigint | 执行器内执行时间(单位:微秒)。 | L0 |
| parse_time | bigint | SQL解析时间(单位:微秒)。 | L0 |
| plan_time | bigint | SQL生成计划时间(单位:微秒)。 | L0 |
| rewrite_time | bigint | SQL重写时间(单位:微秒)。 | L0 |
| pl_execution_time | bigint | plpgsql上的执行时间(单位:微秒)。 | L0 |
| pl_compilation_time | bigint | plpgsql上的编译时间(单位:微秒)。 | L0 |
| data_io_time | bigint | IO上的时间花费(单位:微秒)。 | L0 |
| net_send_info | text | 通过物理连接发送消息的网络状态,包含时间(微秒)、调用次数、吞吐量(字节)。在分布式数据库中,CN与CN、CN与客户端以及CN与DN之间都是通过物理连接进行通信,通过该字段可以分析SQL在分布式系统下的网络开销。例如:{"time":xxx, "n_calls":xxx, "size":xxx}。 | L0 |
| net_recv_info | text | 通过物理连接接收消息的网络状态,包含时间(微秒)、调用次数、吞吐量(字节)。在分布式数据库中,CN与CN、CN与客户端以及CN与DN之间都是通过物理连接进行通信,通过该字段可以分析SQL在分布式系统下的网络开销。例如:{"time":xxx, "n_calls":xxx, "size":xxx}。 | L0 |
| net_stream_send_info | text | 通过逻辑连接发送消息的网络状态,包含时间(微秒)、调用次数、吞吐量(字节)。在分布式数据库中,不同分片的DN之间通过逻辑连接进行通信,通过该字段可以分析SQL在分布式系统下的网络开销。例如:{"time":xxx, "n_calls":xxx, "size":xxx}。 | L0 |
| net_stream_recv_info | text | 通过逻辑连接接收消息的网络状态,包含时间(微秒)、调用次数、吞吐量(字节)。在分布式数据库中,不同分片的DN之间通过逻辑连接进行通信,通过该字段可以分析SQL在分布式系统下的网络开销。例如:{"time":xxx, "n_calls":xxx, "size":xxx}。 | L0 |
| lock_count | bigint | 加锁次数。 | L0 |
| lock_time | bigint | 加锁耗时。 | L1 |
| lock_wait_count | bigint | 加锁等待次数。 | L0 |
| lock_wait_time | bigint | 加锁等待耗时。 | L1 |
| lock_max_count | bigint | 最大持锁数量。 | L0 |
| lwlock_count | bigint | 轻量级加锁次数(预留)。 | L0 |
| lwlock_wait_count | bigint | 轻量级等锁次数。 | L0 |
| lwlock_time | bigint | 轻量级加锁时间(预留)。 | L1 |
| lwlock_wait_time | bigint | 轻量级等锁时间。 | L1 |
| details | bytea | 等待事件和语句锁事件的列表。 记录级别的值>=L0时,开始记录等待事件的列表。显示当前节点wait event的相关统计信息。内核中关键的事件信息见表2、表3、表4和表5,或从视图wait_event_info中查看系统中所有的事件列表。关于每种事务锁对业务的影响程度,请参考LOCK语法小节的详细描述。 记录级别的值是L2时,开始记录语句锁事件的列表。该列表按时间顺序记录事件。记录的数量受参数track_stmt_details_size的影响。 该字段为二进制,需要借助解析函数pg_catalog.statement_detail_decode读取,见(表9)。 事件包括:
| L0/L2 |
| is_slow_sql | boolean | 该SQL是否为slow SQL。
| L0 |
| trace_id | text | 驱动传入的trace id,与应用的一次请求相关联。 | L0 |
| advise | text | 可能导致该SQL为slow SQL的风险信息。 | L0 |
| parent_unique_sql_id | bigint | 当前语句的外层SQL的归一化SQL ID,对于存储过程内执行的语句,该值为调用存储过程语句的归一化SQL ID,存储过程外的语句该值为0。 | L0 |
经常使用查询慢SQL:
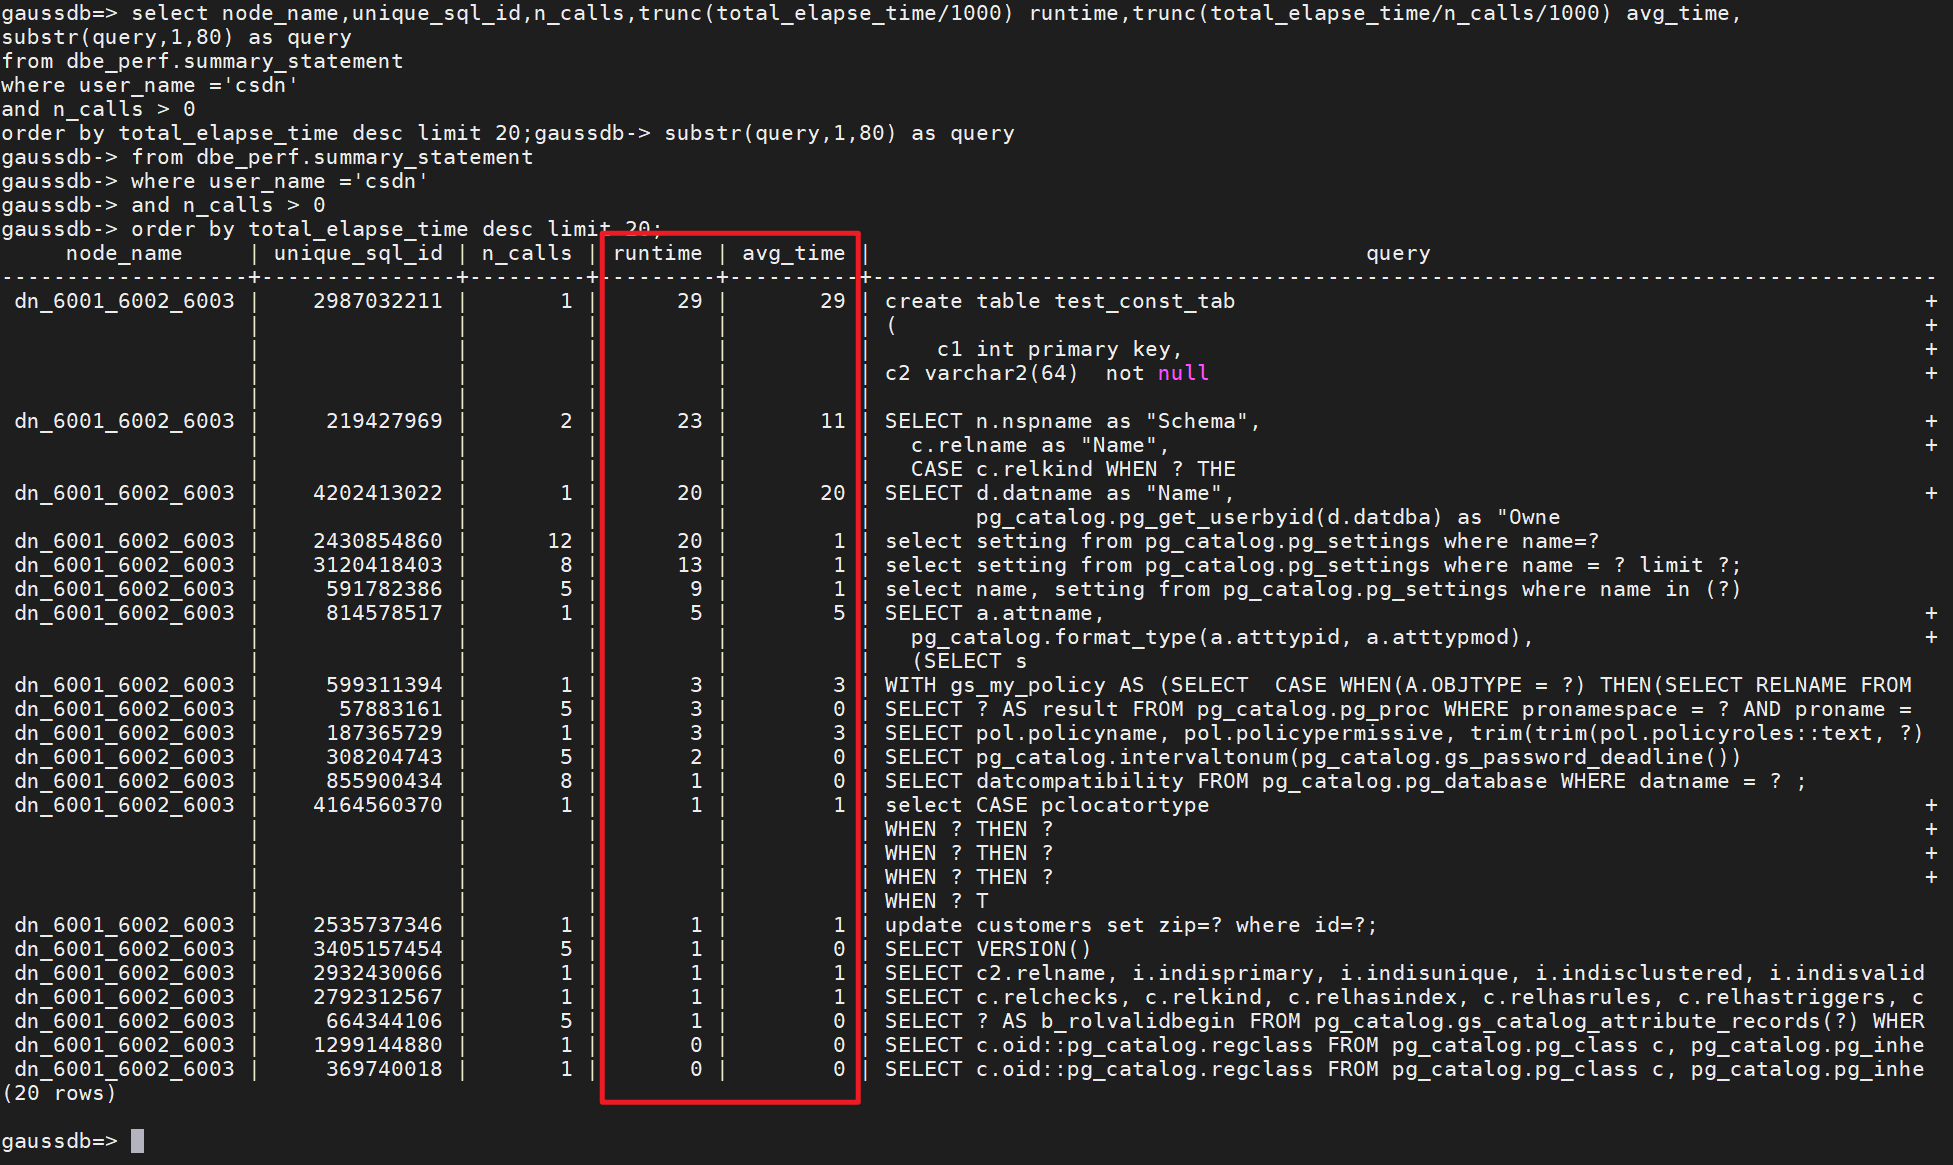
select node_name,unique_sql_id,n_calls,trunc(total_elapse_time/1000) runtime,trunc(total_elapse_time/n_calls/1000) avg_time,
substr(query,1,80) as query
from dbe_perf.summary_statement
where user_name ='csdn'
and n_calls > 0
order by total_elapse_time desc limit 20;
结果:
可以通过相应的接口查询数据库的FULL SQL/SLOW SQL信 息
获取集群内指定时间段的 Full SQL信息:
dbe_perf.get_global_full_sql_by_timestamp('开始时间','结束时 间,);
获取指定时间段的Slow SQL信息:
dbe_perf.get_global_slow_sql_by_timestamp('开始时间','结束 时间,);5 批注
GaussDB提供了丰富的性能诊断视图,系统级、会话、语句级的帮助我们去排查性能问题根因,在实际的SQL性能调优中灵活地使用这些性能视图提高调优能力。