GDB调试命令学习
GDB是什么
调试程序
程序中出现语法错误可以借助编译器解决,但逻辑错误则只能靠自己解决,
所谓调试(Debug)就是让代码一步步慢慢执行,跟踪程序的运行过程。比如,可以让程序stop在某行,查看下当前所有变量的值,或者内存中的数据,也可以让程序一次执行单步,或者多步语句,看看程序到底执行了哪些代码。
GDB支持多种编程语言编写的程序,包括C,C++,Object-C等,实现功能:
a)程序启动时,可以按照我们自定义的要求运行程序,例如设置参数和环境变量;
b)可使被调程序在指定代码处暂停运行,并查看当前程序的运行状态(例如当前变量的值,函数的执行结果等),即支持断点调试
c)程序执行过程中,可以改变某个变量的值,还可以改变代码执行顺序,从而尝试修改程序中出现的逻辑错误
一,安装
终端里输入以下指令:
apt-get update
apt-get install gdb
查看GDB版本
输入gdb -v 如果显示处gdb版本,表明安装成功
二,GDB的用法
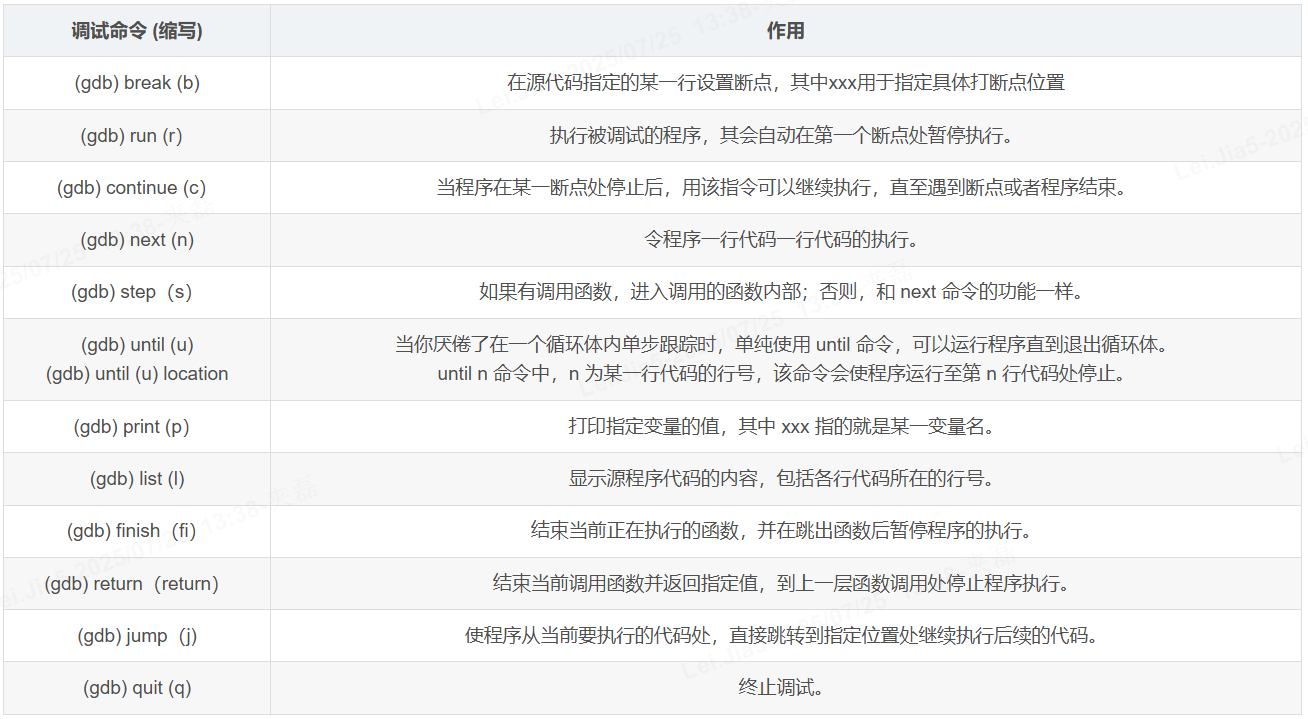
常用调试命令
GDB的主要功能就是监控程序的执行流程。这也就意味着,只有当源程序文件编译为可执行文件并执行时,并且该文件中必须包含必要的调试信息(比如各行代码所在的行号、包含程序中所有变量名称的列表(又称为符号表)等),GDB才会派上用场。
所以在编译时需要使用 gcc/g++ -g 选项编译源文件,才可生成满足 GDB 要求的可执行文件
三,举例说明
$ ls
main.cpp//Step1,编译时需要使用 gcc/g++ -g 选项编译源文件main.cpp 成 test
$ g++ -g -o test main.cpp
$ ls
main.cpp  test//Step2,启动gdb进行调试
$ gdb test         <-- 启动gdb进行调试
GNU gdb (GDB) Red Hat Enterprise Linux 7.6.1-94.el7
Copyright (C) 2013 Free Software Foundation, Inc.
License GPLv3+: GNU GPL version 3 or later <http://gnu.org/licenses/gpl.html>
This is free software: you are free to change and redistribute it.
There is NO WARRANTY, to the extent permitted by law.  Type "show copying"
and "show warranty" for details.
This GDB was configured as "x86_64-redhat-linux-gnu".
For bug reporting instructions, please see:
<http://www.gnu.org/software/gdb/bugs/>...
Reading symbols from /home/zhuyong/project/linux/blog/gdb/test...done.
(gdb)//gdb启动时会默认打印一堆免责条款,通过添加 --silent(或者 -q、--quiet)选项,可将这部分信息屏蔽掉。
//Step2,启动gdb进行调试
$ gdb test -q      <-- 启动gdb进行调试
Reading symbols from /home/zhudi/project/linux/blog/gdb/test...done.//Step3, (gdb) list (l) 即显示带行号的源代码
(gdb) l            <-- 显示带行号的源代码
1	#include <iostream>
2	using namespace std;
3
4	int main() {
5	    int sum = 0;
6	    int n = 1;
7	    while (n <= 100) {
8	        sum += n;
9	        n++;
10	    }
(gdb)              <-- 默认情况下,l 选项只显示 10 行源代码,如果查看后续代码,按 Enter 回车键即可
11	    cout << "sum = " << sum << endl;
12
13	    return 0;
14	}
15//Step4,(gdb) break (b) 在第7行打断点
(gdb) b 7          <-- 在第7行源代码处打断点
Breakpoint 1 at 0x4008d3: file main.cpp, line 7.//Step5,(gdb) run (r)执行被调试的程序,其会自动在第一个断点处暂停执行。
(gdb) r            <-- 运行程序,遇到断点停止
Starting program: /home/zhudi/project/linux/blog/gdb/testBreakpoint 1, main () at main.cpp:7
7	    while (n <= 100) {
Missing separate debuginfos, use: debuginfo-install glibc-2.17-307.el7.1.x86_64 libgcc-4.8.5-39.el7.x86_64 libstdc++-4.8.5-39.el7.x86_64//Step6 (gdb) print (p) 打印查看指定变量的值
(gdb) print n      <-- 查看代码中变量 n 的值
$1 = 1             <-- 当前 n 的值为 1,$1 表示该变量 表示该变量所在存储区的名称//Step7,重复第4步骤
(gdb) b 13
Breakpoint 2 at 0x40090e: file main.cpp, line 13.//Step8,(gdb) next (n)
(gdb) n            <-- 单步执行程序
8	        sum += n;//Step9,(gdb) next (n)
(gdb) n            <-- 单步执行程序
9	        n++;//Step10,(gdb) continue (c)
(gdb) c            <-- 继续执行程序
Continuing.
sum = 5050Breakpoint 2, main () at main.cpp:13
13	    return 0;//Step11,(gdb) print (p) 打印查看指定变量的值
(gdb) print sum     <-- 查看 sum 的值
$2 = 5050           <-- 当前 sum 的值为 5050//Step12,(gdb) quit (q)
(gdb) q             <-- 退出调试
A debugging session is active.Inferior 1 [process 8449] will be killed.Quit anyway? (y or n) y     <-- 确认是否退出调试,y 为退出,n 为不退出