OpenLayers 快速入门(二)Layer 对象
看过的知识不等于学会。唯有用心总结、系统记录,并通过温故知新反复实践,才能真正掌握一二
作为一名摸爬滚打三年的前端开发,开源社区给了我饭碗,我也将所学的知识体系回馈给大家,助你少走弯路!
OpenLayers、Leaflet 快速入门 ,每周保持更新 2 个案例
Cesium 快速入门,每周保持更新 4 个案例
OpenLayers 快速入门(一)Map对象
OpenLayers 快速入门(二)Layer 对象
OpenLayers 快速入门(三)Source 对象补充
OpenLayers 快速入门(四)View 对象
OpenLayers 快速入门(五)Controls 对象
OpenLayers 快速入门(六)Interaction 对象
OpenLayers 快速入门(七)矢量数据
OpenLayers 快速入门(八)事件系统
OpenLayers 快速入门(九)Extent 介绍
OpenLayers 快速入门(十)常用 API 补充
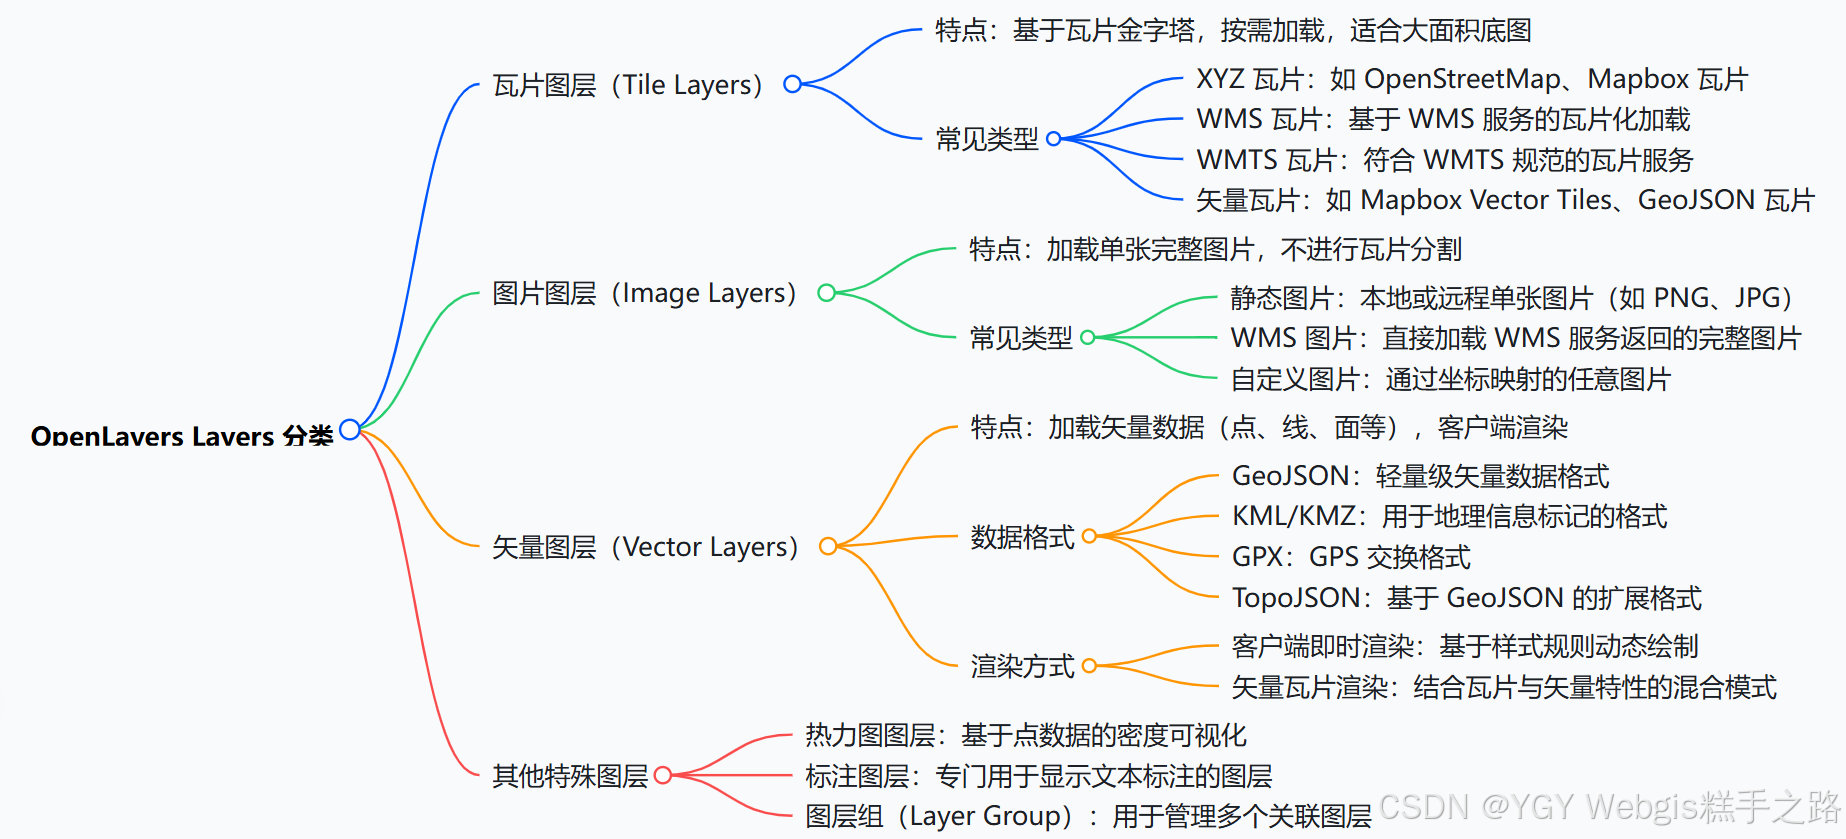
Layer 对象
OpenLayers 的图层系统负责数据渲染与可视化,是地图内容组织的核心单元。不同图层类型处理不同数据格式,配合 Source 和 Style 实现灵活的地图呈现。
核心概念:
- 每个图层必须绑定一个数据源(Source)
- 图层渲染顺序由
zIndex控制(值越大越靠上)- 可通过
minZoom/maxZoom控制可见缩放级别
图层类型速查
| 图层类型 | 类名 | 用途描述 |
|---|---|---|
| TileLayer (重要) | ol/layer/Tile | 加载瓦片地图(OSM/高德等) |
| VectorLayer (重要) | ol/layer/Vector | 渲染矢量要素(点/线/面) |
| ImageLayer | ol/layer/Image | 加载单张图片或 WMS 服务 |
| VectorTileLayer | ol/layer/VectorTile | 加载矢量瓦片(Mapbox 等) |
| HeatmapLayer | ol/layer/Heatmap | 热力图可视化 |
| GroupLayer | ol/layer/Group | 图层组管理 |
核心公共属性
| 属性名 | 类型 | 默认值 | 描述 |
|---|---|---|---|
source | ol.source.* | undefined | 必需,图层数据源 |
opacity | number | 1 | 透明度(0-1) |
visible | boolean | true | 是否可见 |
extent | Array<number> | undefined | 渲染范围 [minx, miny, maxx, maxy] |
zIndex | number | 0 | 图层叠放顺序(值大的在上层) |
minResolution | number | undefined | 最小分辨率(小于此值不显示) |
maxResolution | number | undefined | 最大分辨率(大于此值不显示) |
minZoom | number | undefined | 最小缩放级别(小于此级别不显示) |
maxZoom | number | undefined | 最大缩放级别(大于此级别不显示) |
className | string | 'ol-layer' | 图层容器的 CSS 类名 |
properties | Object | {} | 自定义属性(存储业务数据) |
核心公共方法
| 方法签名 | 返回值 | 描述 |
|---|---|---|
getOpacity() | number | 获取当前透明度 |
setOpacity(opacity) | void | 设置透明度(0-1) |
getVisible() | boolean | 获取可见状态 |
setVisible(visible) | void | 设置可见性 |
getExtent() | Array | 获取渲染范围 |
setExtent(extent) | void | 设置渲染范围 |
getZIndex() | number | 获取 zIndex 值 |
setZIndex(zIndex) | void | 设置 zIndex 值 |
getMinResolution() | number | 获取最小分辨率 |
setMinResolution(res) | void | 设置最小分辨率 |
getMaxResolution() | number | 获取最大分辨率 |
setMaxResolution(res) | void | 设置最大分辨率 |
getSource() | Source | 获取数据源实例 |
setSource(source) | void | 更换数据源 |
getProperties() | Object | 获取所有自定义属性 |
set(key, value) | void | 设置单个自定义属性 |
get(key) | any | 获取自定义属性值 |
const layer = new ol.layer.Tile({source: new ol.source.OSM(), // 数据源opacity: 0.5, // 透明度visible: false, // 可见性extent: [-180, -90, 180, 90], // 渲染范围zIndex: 100, // 叠加顺序minResolution: 0.00001, // 最小分辨率maxResolution: 0.0001, // 最大分辨率minZoom: 0, // 最小缩放级别maxZoom: 20, // 最大缩放级别className: "my-tile-layer", // CSS 类名properties: {id: "base-map",customProperty: "custom value",}, // 自定义属性
});
// 读取自定义属性
layer.get("id"); // 'base-map'layer.getProperties(); // {id: 'base-map', customProperty: 'custom value'}layer.getOpacity(); // 0.5layer.getVisible(); // true
1. TileLayer - 瓦片图层
用于加载预切片的栅格地图服务(如 OSM、高德、天地图)。
特有属性
| 属性名 | 类型 | 默认值 | 描述 |
|---|---|---|---|
preload | number | 0 | 预加载瓦片层级数,0 表示不预加载 |
background | string | undefined | 背景色(瓦片间隙) |
TileSource - 数据源
瓦片图层数据源(Tile Source)负责提供瓦片地图的原始数据,定义了瓦片的获取方式、格式和加载策略。它是瓦片图层(TileLayer)的核心组成部分。
| 类型 | 类名 | 描述 | 引入路径 |
|---|---|---|---|
| OSM | ol/source/OSM | OpenStreetMap 瓦片 | import OSM from 'ol/source/OSM' |
| XYZ | ol/source/XYZ | 标准 XYZ 格式瓦片 | import XYZ from 'ol/source/XYZ' |
| WMTS | ol/source/WMTS | OGC WMTS 服务 | import WMTS from 'ol/source/WMTS' |
| WMS | ol/source/TileWMS | OGC WMS 服务(瓦片版) | import TileWMS from 'ol/source/TileWMS' |
OSM
// 加载 OpenStreetMap 瓦片
import TileLayer from "ol/layer/Tile";
import OSM from "ol/source/OSM";const tileLayer = new TileLayer({source: new OSM({attributions: "© OpenStreetMap contributors",maxZoom: 19,}),opacity: 1, // 不透明度,0~1visible: true, // 是否可见zIndex: 0, // 图层顺序
});
XYZ
// 加载高德地图
import TileLayer from "ol/layer/Tile";
import XYZ from "ol/source/XYZ";const tileLayer = new TileLayer({source: new XYZ({url: "https://webrd04.is.autonavi.com/appmaptile?lang=zh_cn&size=1&scale=1&style=7&x={x}&y={y}&z={z}",}),opacity: 1, // 不透明度,0~1visible: true, // 是否可见zIndex: 0, // 图层顺序
});
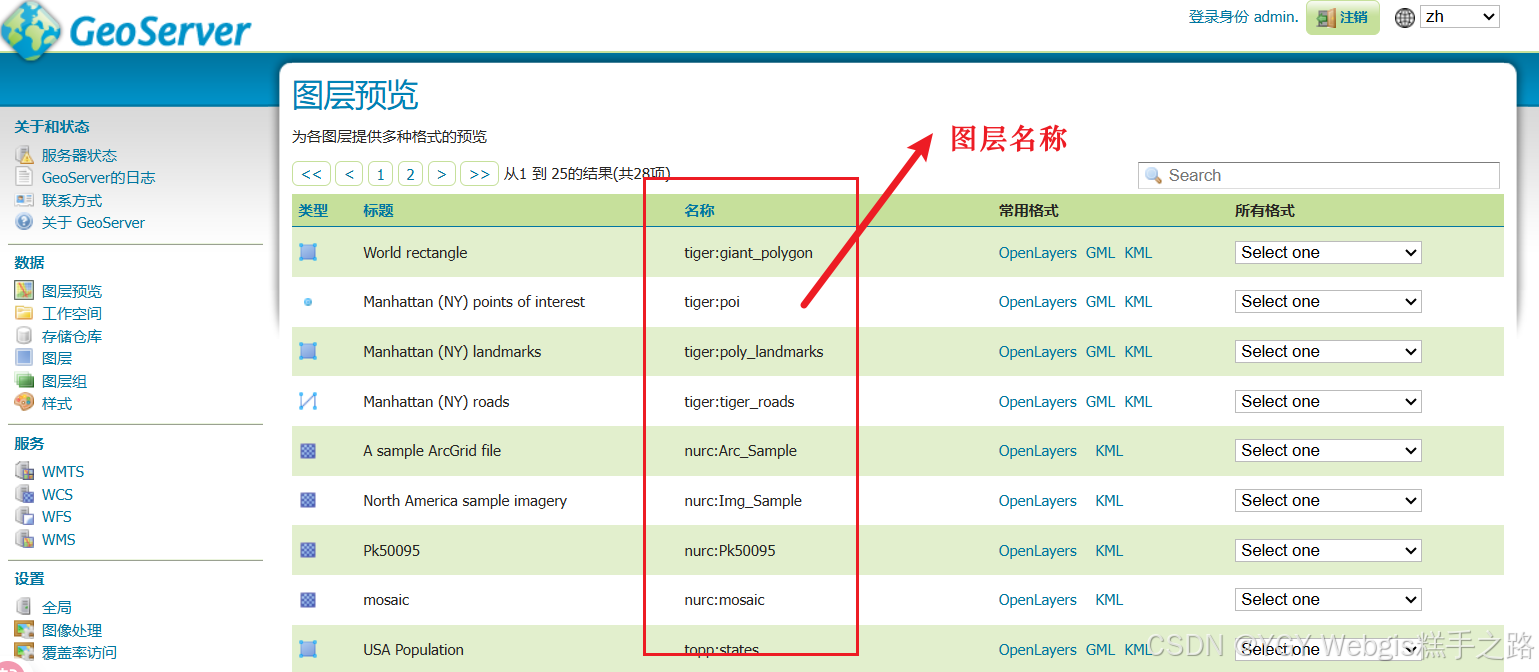
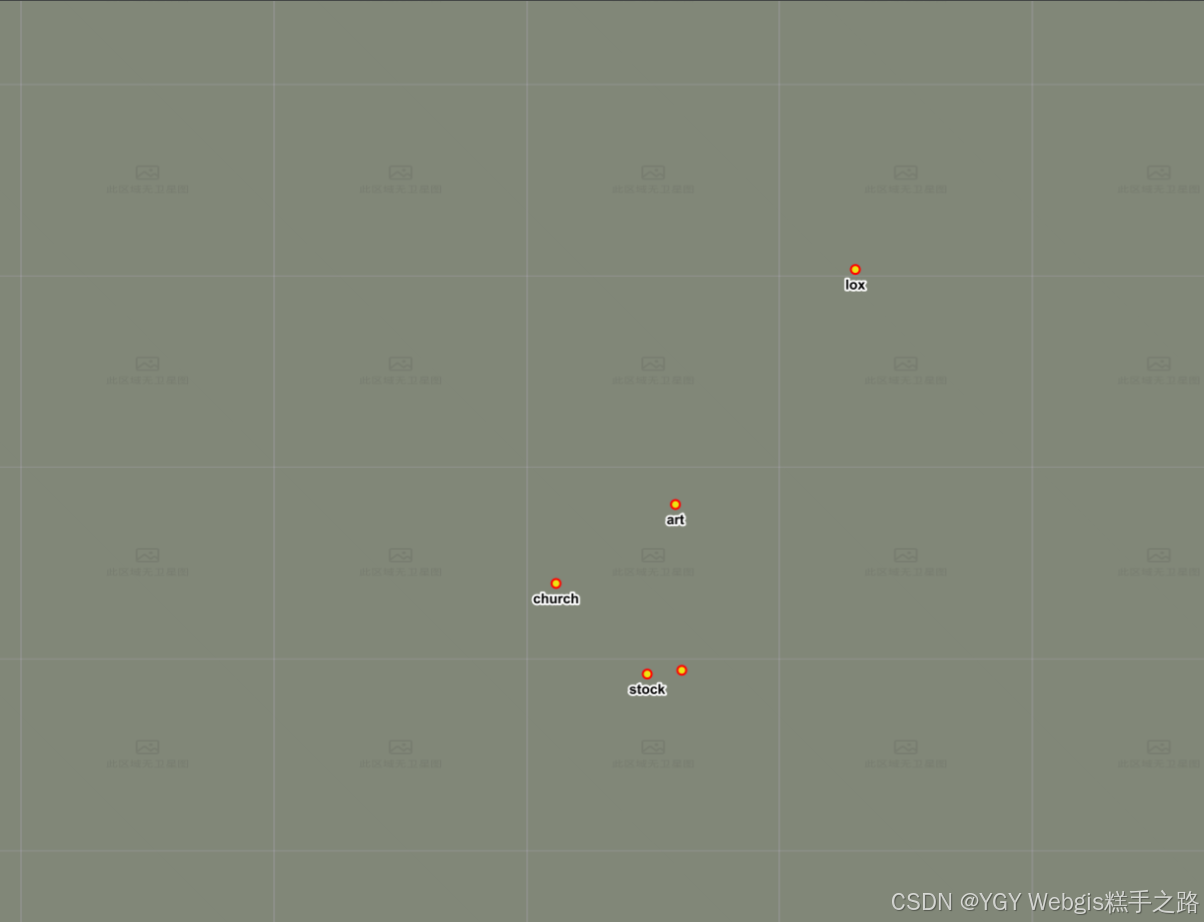
GeoServer WMS
import TileLayer from "ol/layer/Tile.js";
import TileWMS from "ol/source/TileWMS.js";// http://localhost:8520/geoserver/tiger/wms?service=WMS&version=1.1.0&request=GetMap&layers=tiger%3Apoi&bbox=-74.0118315772888%2C40.70754683896324%2C-74.00153046439813%2C40.719885123828675&width=641&height=768&srs=EPSG%3A4326&styles=&format=application/openlayers
const wmsLayer = new TileLayer({source: new TileWMS({url: "http://localhost:8520/geoserver/tiger/wms",params: {LAYERS: "tiger:poi",VERSION: "1.1.0",},}),
});
map.addLayer(wmsLayer);
2. ImageLayer - 图片图层
用于显示单张静态图片或动态生成的图片(如 WMS 服务返回的图片)
ImageSource - 数据源
| 类型 | 类名 | 描述 |
|---|---|---|
| ImageStatic | ol/source/ImageStatic | 静态图片 |
| ImageWMS | ol/source/ImageWMS | WMS 服务图片 |
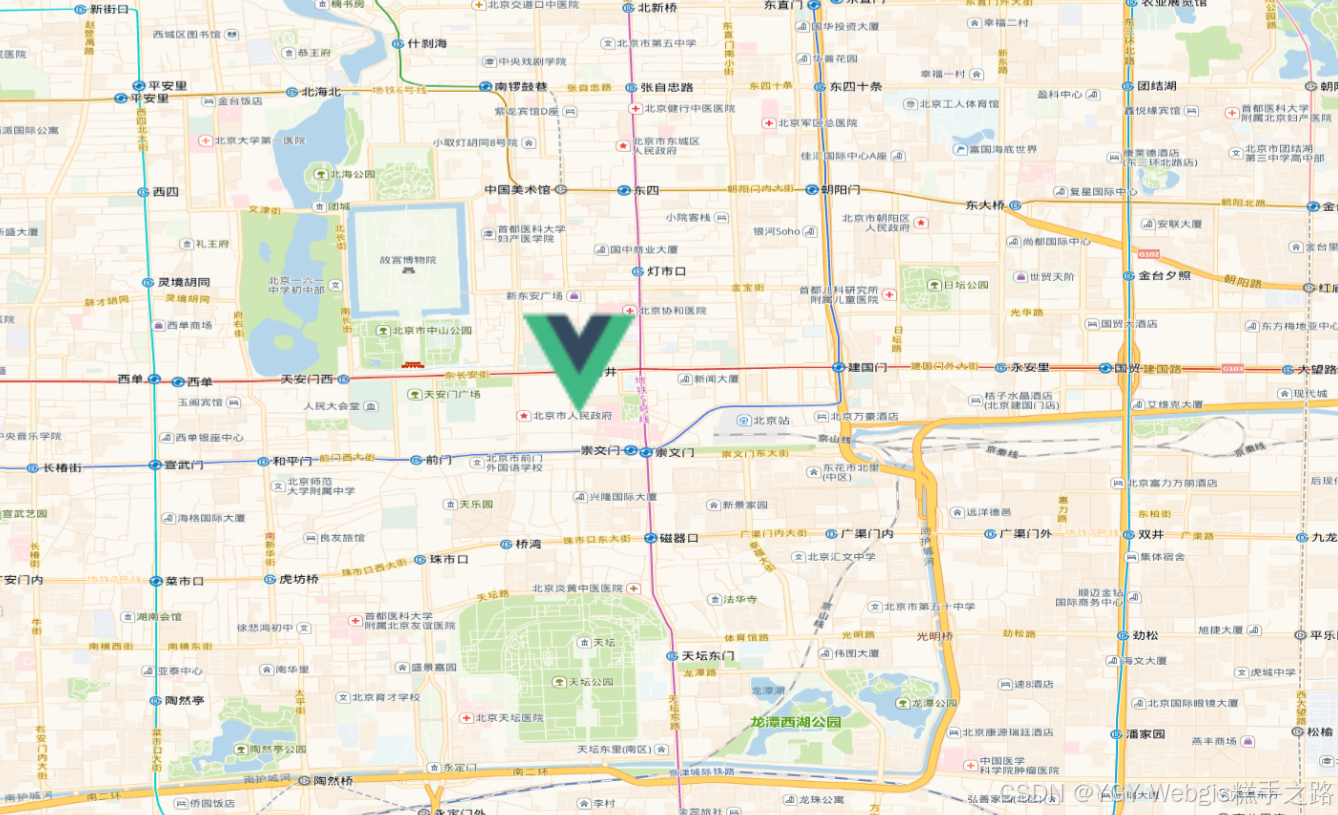
ImageStatic - 静态图像
import ImageLayer from "ol/layer/Image";
import Static from "ol/source/ImageStatic.js";const imageLayer = new ImageLayer({source: new Static({url: "/src/assets/vue.svg", // 替换为你的图片路径imageExtent: [116.4074, 39.9042, 116.4174, 39.9142], // 图像在地图坐标中的范围}),
});
map.addLayer(imageLayer);
3. VectorLayer - 矢量图层(重点)
直接在客户端渲染矢量数据(点/线/面),支持动态修改和交互。
特有属性
| 属性名 | 类型 | 默认值 | 描述 |
|---|---|---|---|
style | Style|Function | undefined | 要素样式(支持动态函数) |
background | string | undefined | 背景色 |
- 复杂样式建议使用
StyleFunction动态计算
特有方法
| 方法名 | 返回值 | 描述 |
|---|---|---|
setStyle(style) | void | 设置图层样式 |
getStyle() | Style | 获取图层样式 |
VectorSource - 数据源
矢量图层数据源(Vector Source)负责提供矢量数据,定义了数据的获取方式、格式和加载策略。它是矢量图层(VectorLayer)的核心组成部分。
| 类型 | 介绍 |
|---|---|
| GeoJSON | 加载 GeoJSON 格式矢量数据 |
| KML | 加载 KML 格式矢量数据 |
| Vector | 加载矢量要素 |
VectorSource - 核心属性
| 属性 | 类型 | 默认值 | 描述 |
|---|---|---|---|
features | Array<Feature> | [] | 初始要素数组 |
url | string | null | 远程数据 URL |
format | ol.format.* | null | 数据解析格式(GeoJSON 等) |
loader | function | null | 自定义加载函数 |
strategy | LoadingStrategy | 加载策略(控制何时加载数据),默认一次性加载所有要素 | |
overlaps | boolean | true | 是否允许要素重叠(性能优化) |
useSpatialIndex | boolean | true | 是否启用空间索引(查询优化) |
wrapX | boolean | true | 是否在水平方向重复要素(适用于全球地图) |
VectorSource - 核心方法
| 方法名 | 返回值 | 描述 |
|---|---|---|
addFeature(feature) | void | 添加单个要素 |
addFeatures(features) | void | 添加多个要素 |
removeFeature(feature) | Feature | 移除单个要素(返回被移除的要素) |
removeFeatures(features) | void | 移除多个要素 |
getFeatureById(id) | Feature | 根据 ID 获取要素 |
getFeatures() | Array | 获取所有要素 |
getFeaturesInExtent(extent) | Array | 获取指定范围内的要素(需开启空间索引) |
getClosestFeatureToCoordinate(coordinate) | Feature | 根据坐标获取最近要素 |
forEachFeature(callback) | void | 遍历所有要素 |
forEachFeatureInExtent(extent, callback) | void | 在指定范围内遍历要素(需开启空间索引) |
clear() | void | 清除所有要素 |
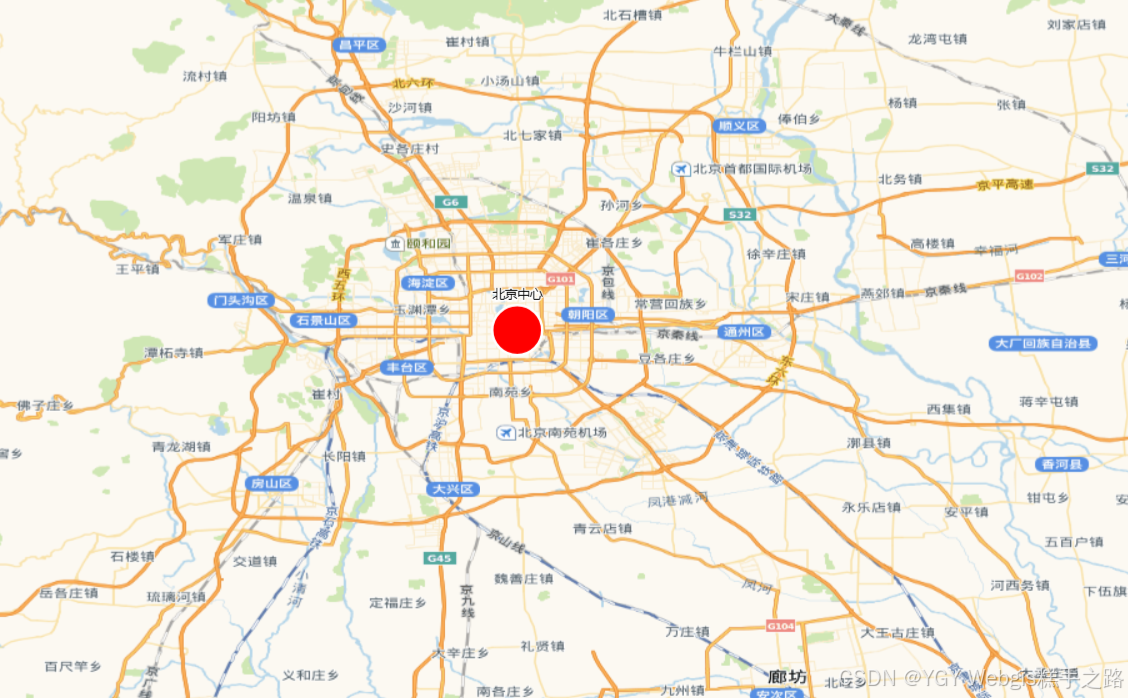
矢量要素创建
- 以下为创建一个最基础的矢量要素(点),更多矢量图层属性参考矢量图形,
- 创建顺序为
Feature -> VectorSource(features 属性加载) -> VectorLayer
import Feature from "ol/Feature.js";
import Point from "ol/geom/Point.js";
import VectorLayer from "ol/layer/Vector.js";
import VectorSource from "ol/source/Vector.js";
import Style from "ol/style/Style";
import Fill from "ol/style/Fill";
import Stroke from "ol/style/Stroke";
import CircleStyle from "ol/style/Circle";
import Text from "ol/style/Text";const feature = new Feature({geometry: new Point([116.4074, 39.9042]), // 北京市中心经纬度name: "北京中心",
});
const source = new VectorSource({features: [feature],
});
const layer = new VectorLayer({source: source,// 圆形标记style: new Style({image: new CircleStyle({radius: 20,fill: new Fill({ color: "red" }),stroke: new Stroke({ color: "white", width: 2 }),}),text: new Text({text: feature.get("name"), // 显示点的名称offsetY: -28, // 文本偏移fill: new Fill({ color: "black" }),stroke: new Stroke({ color: "white", width: 2 }),}),}),
});
map.addLayer(layer);
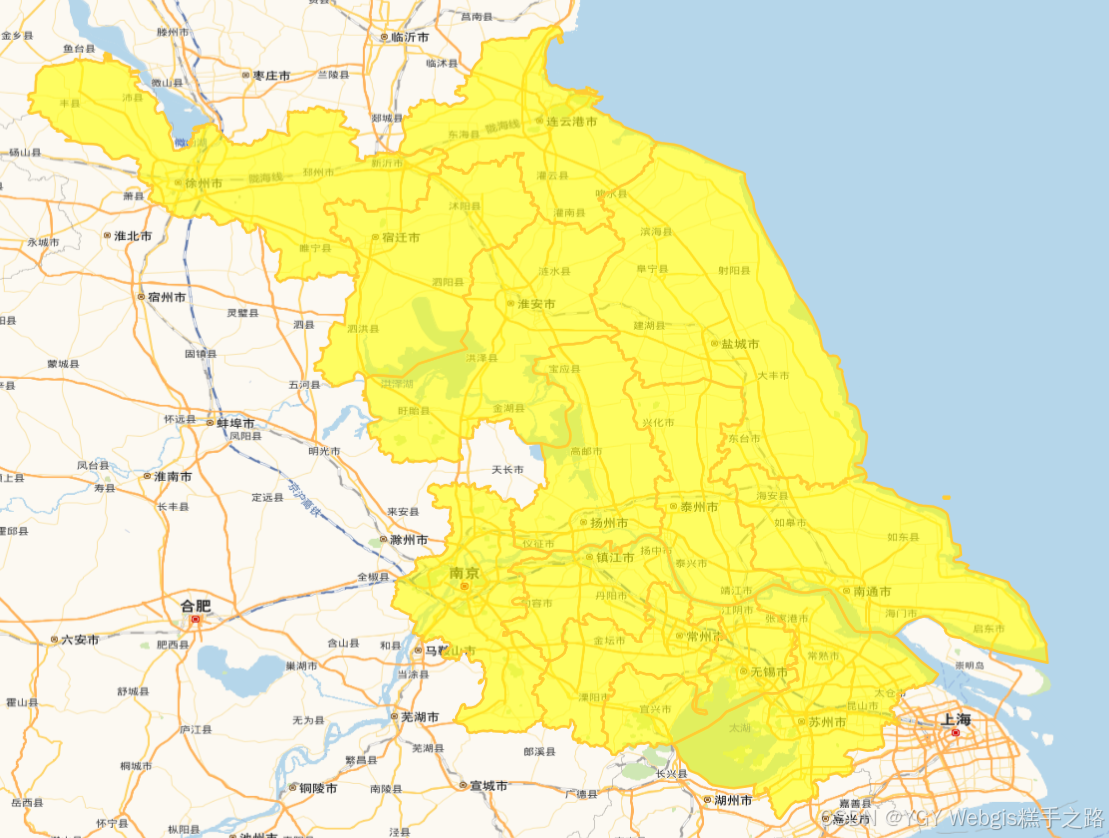
加载 Geojson
- 创建顺序为
VectorSource(url 属性加载) -> VectorLayer - format:数据解析格式,用于将 GeoJSON 数据转换为 OpenLayers 中的要素对象。
import GeoJSON from "ol/format/GeoJSON.js";
import VectorLayer from "ol/layer/Vector.js";
import VectorSource from "ol/source/Vector.js";
import Style from "ol/style/Style";
import Fill from "ol/style/Fill";
import Stroke from "ol/style/Stroke";const geojsonLayer = new VectorLayer({source: new VectorSource({url: "https://geo.datav.aliyun.com/areas_v3/bound/320000_full.json", // 替换为你的GeoJSON数据URLformat: new GeoJSON(), // 数据解析格式}),style: new Style({fill: new Fill({color: "rgba(255, 255, 0, 0.6)",}),stroke: new Stroke({color: "#ffcc33",width: 2,}),}),
});
map.addLayer(geojsonLayer);
Style - 样式
控制矢量要素外观的核心机制,支持静态样式和动态样式函数。
基础样式组件
| 组件 | 作用 | 示例 |
|---|---|---|
Fill | 填充颜色 | new Fill({ color: 'red' }) |
Stroke | 描边样式 | new Stroke({ color: 'blue', width: 2 }) |
Circle | 圆形图标 | new Circle({ radius: 10, fill: ... }) |
Icon | 图片图标 | new Icon({ src: 'pin.png' }) |
Text | 文本标注 | new Text({ text: '北京', font: 'bold 14px sans-serif' }) |
RegularShape | 自定义形状 | new RegularShape({ radius: 10, fill: ... }) |
基本样式
import { Style, Fill, Stroke, Circle, Text } from "ol/style";const pointStyle = new Style({image: new Circle({radius: 10, // 半径fill: new Fill({ color: "red" }), // 填充颜色}),text: new Text({text: "标记点", // 文本内容font: "bold 14px sans-serif", // 字体样式fill: new Fill({ color: "black" }), // 文本填充颜色offsetY: -20, // 文本垂直偏移stroke: new Stroke({color: "white", // 文本描边颜色width: 2, // 文本描边宽度}),rotation: Math.PI / 4, // 文本旋转角度(弧度)}),stroke: new Stroke({color: "blue",width: 3,lineDash: [10, 5], // 虚线模式}),fill: new Fill({color: "rgba(0, 255, 0, 0.3)", // 带透明度的绿色}),
});
动态样式
每次视图变化时都会重新计算样式,适用于需要根据视图状态调整样式的情况。
// 设置动态样式函数
const getStyle = (feature, resolution) => {const size = resolution < 100 ? 10 : 5;return new Style({image: new CircleStyle({radius: size,fill: new Fill({ color: "blue" }),}),});
};
vectorLayer.setStyle(getStyle);
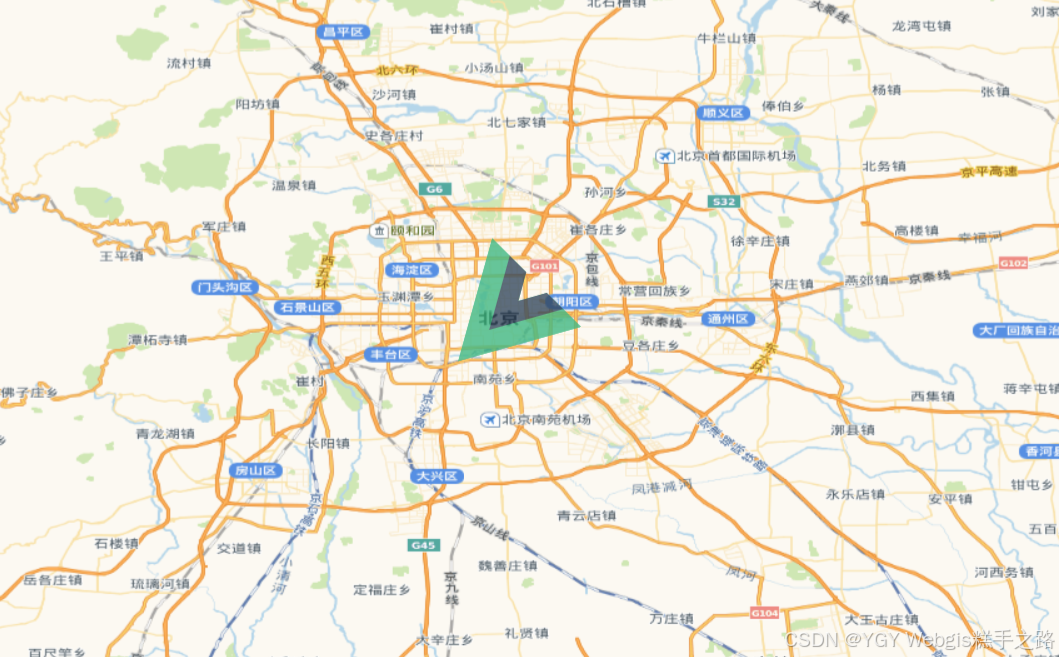
图标样式
import { Style, Icon } from "ol/style";const iconStyle = new Style({image: new Icon({src: "/src/assets/vue.svg", // 使用本地图片// scale: 1, // 缩放比例width: 60, // 图标的像素宽度,不能与 scale 一起使用。height: 60, // 图标的像素高度,不能与 scale 一起使用。rotation: Math.PI / 4, // 旋转角度(弧度)anchor: [0.5, 0.5], // 锚点位置(图标中心)opacity: 0.8, // 图标透明度rotateWithView: false, // 是否随视图旋转图标}),
});
4. VectorTileLayer - 矢量瓦片图层
加载矢量瓦片(如 Mapbox Vector Tiles),在客户端动态渲染样式。
import VectorTileLayer from "ol/layer/VectorTile";
import VectorTileSource from "ol/source/VectorTile";
import MVT from "ol/format/MVT";const vectorTileLayer = new VectorTileLayer({source: new VectorTileSource({format: new MVT(),url: "https://your-server/tiles/{z}/{x}/{y}.pbf",}),
});
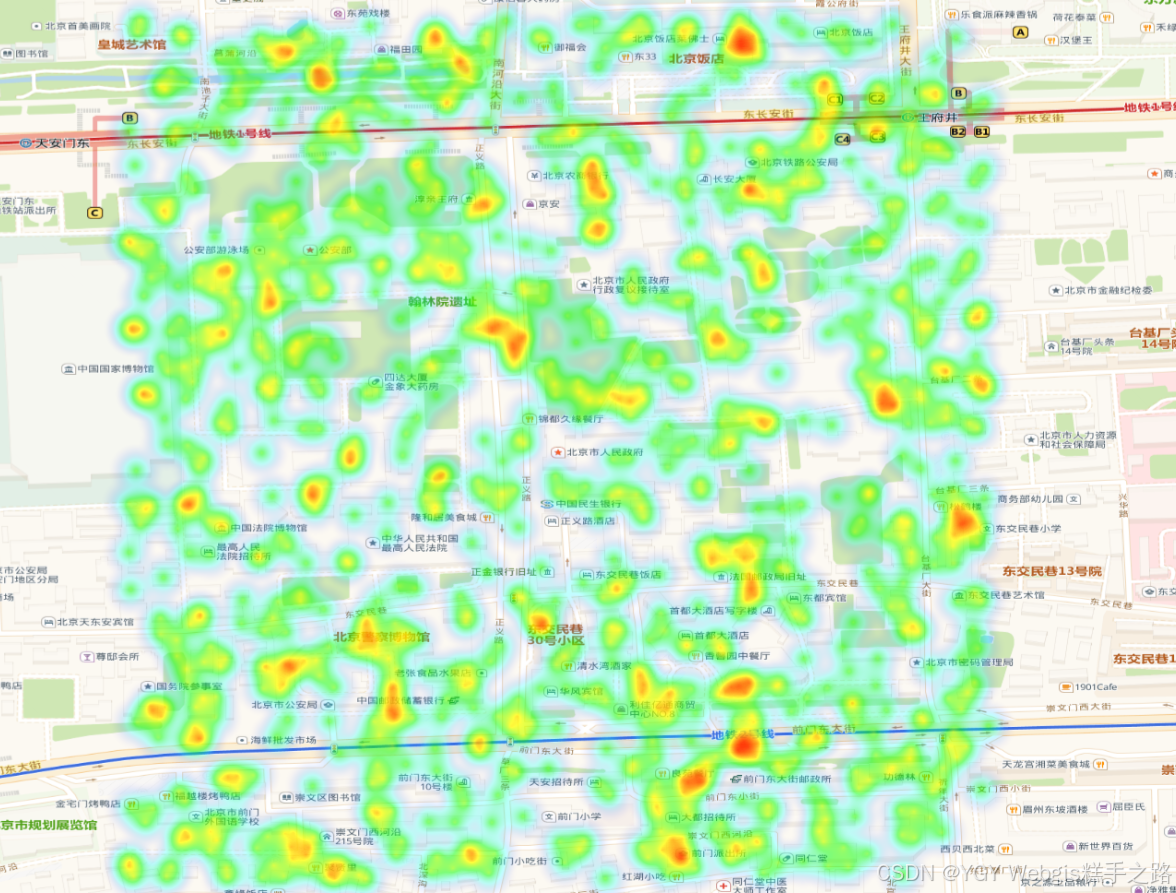
5. HeatmapLayer - 热力图层
将点数据转换为热力图,表现密度分布。
特有属性
| 属性名 | 类型 | 默认值 | 描述 |
|---|---|---|---|
blur | number | 15 | 模糊半径(像素) |
radius | number | 8 | 点半径(像素) |
gradient | Array<string> | ['#00f','#0ff','#0f0','#ff0','#f00'] | 颜色渐变数组 |
weight | string|function | 'weight' | 权重字段/计算函数 |
数据源必须包含点要素
import Heatmap from "ol/layer/Heatmap";
import VectorSource from "ol/source/Vector";
import Feature from "ol/Feature";
import Point from "ol/geom/Point";// 随机生成1000个点
const features = [];
for (let i = 0; i < 1000; i++) {const randomLon = 116.4074 + (Math.random() - 0.5) * 0.01; // 随机生成纬度const randomLat = 39.9042 + (Math.random() - 0.5) * 0.01; // 随机生成经度const feature = new Feature({geometry: new Point([randomLon, randomLat]),});features.push(feature);
}
// 创建一个矢量图层
const heatmapLayer = new Heatmap({source: new VectorSource({features,}),
});
map.addLayer(heatmapLayer);
6. GroupLayer - 图层组
管理多个图层的容器,可统一控制组内所有图层。
核心方法
| 方法名 | 描述 |
|---|---|
| getLayers() | 获取组中的所有图层数组 |
| setLayers(layers) | 设置组中的图层数组 |
| getVisible() | 获取组的可见性 |
| setVisible(visible) | 设置组的可见性 |
| getOpacity() | 获取组的透明度 |
| setOpacity(opacity) | 设置组的透明度 |
| getZIndex() | 获取图层组叠放顺序 |
| setZIndex(zIndex) | 设置图层组叠放顺序 |
| getExtent() | 获取组的范围(范围) |
| getMinResolution() | 获取组的最小分辨率 |
| getMaxResolution() | 获取组的最大分辨率 |
| getMinZoom() | 获取组的最小缩放级别 |
| getMaxZoom() | 获取组的最大缩放级别 |
import LayerGroup from "ol/layer/Group";const groupLayer = new LayerGroup({layers: [tileLayer, vectorLayer],
});
添加图层到组
// 方法1:创建时添加
const group = new LayerGroup({layers: [layer1, layer2],
});// 方法2:通过集合添加
group.getLayers().push(layer3);// 方法3:插入指定位置
group.getLayers().insertAt(0, layer0); // 插入到首位// 方法4:添加多个图层
group.getLayers().extend([layer4, layer5]);