评估遥感云雾浓度的无参化指标(适用于其它合成雾的场景)
前言
本文总结了四种用于评估图像雾浓度的无参考指标:FADE、densityD、AuthESI和JSFD。FADE通过MATLAB实现,能较好反映雾气浓度但计算耗时;densityD基于TensorFlow,对天空场景较为敏感;AuthESI主要用于评估合成雾真实性,不适用于浓度评估;JSFD结合HSV空间S值、白点比例和暗通道特征,准确性较高但计算时间长。实验表明,FADE和JSFD以及density更适合遥感场景的雾浓度评估,虽然存在计算效率问题,但能较好区分薄雾和浓雾数据集。这些指标为遥感图像去雾研究提供了有效的量化评
无参化指标
FADE
下载地址:Laboratory for Image and Video Engineering - The University of Texas at Austin
这是一个matlab工程,我这里使用的是matlab2016a,可正常使用。
clear all; close all; clc;% 选择包含图像的文件夹
folder_path = uigetdir('请选择包含图像的文件夹');
if folder_path == 0error('未选择文件夹,操作已取消。');
end% 获取文件夹中所有图像文件
image_extensions = {'.jpg', '.jpeg', '.png', '.bmp', '.tif', '.tiff'};
file_list = dir(fullfile(folder_path, '*'));
image_files = {};
for k = 1:length(file_list)[~, ~, ext] = fileparts(file_list(k).name);if any(strcmpi(ext, image_extensions))image_files{end+1} = fullfile(folder_path, file_list(k).name);end
end% 检查是否找到图像文件
if isempty(image_files)error('文件夹中未找到图像文件(支持格式:.jpg/.jpeg/.png/.bmp/.tif)');
end% 初始化结果存储
density_values = zeros(length(image_files), 1);
short_names = cell(length(image_files), 1);% 创建结果输出文件
output_file = fullfile('fade_results.txt');
fid = fopen(output_file, 'w');
if fid == -1error('无法创建结果文件: %s', output_file);
end% 打印表头
fprintf('文件名\t\t\t\tFADE指标\n');
fprintf('==========================================\n');
fprintf(fid, '文件名\t\t\t\tFADE指标\n');
fprintf(fid, '==========================================\n');% 遍历并计算FADE指标
for i = 1:length(image_files)try% 读取图像img = imread(image_files{i});% 计算雾密度指标density = FADE(img);% 存储结果density_values(i) = density;% 提取短文件名[~, name, ext] = fileparts(image_files{i});short_name = [name, ext];short_names{i} = short_name;% 格式化输出if length(short_name) > 15fprintf('%s...\t%.4f\n', short_name(1:12), density);fprintf(fid, '%s...\t%.4f\n', short_name(1:12), density);elsefprintf('%-15s\t\t%.4f\n', short_name, density);fprintf(fid, '%-15s\t\t%.4f\n', short_name, density);endcatch MEwarning('处理文件 %s 时出错: %s', image_files{i}, ME.message);density_values(i) = NaN;short_names{i} = 'ERROR';end
end% 计算统计信息(忽略错误值)
valid_idx = ~isnan(density_values);
if any(valid_idx)valid_densities = density_values(valid_idx);valid_names = short_names(valid_idx);% 计算统计值avg_density = mean(valid_densities);[max_density, max_idx] = max(valid_densities);[min_density, min_idx] = min(valid_densities);% 输出统计结果fprintf('\n===== 统计结果 =====\n');fprintf('平均值: %.4f\n', avg_density);fprintf('最大值: %.4f (图像: %s)\n', max_density, valid_names{max_idx});fprintf('最小值: %.4f (图像: %s)\n', min_density, valid_names{min_idx});% 写入统计结果到文件fprintf(fid, '\n===== 统计结果 =====\n');fprintf(fid, '平均值: %.4f\n', avg_density);fprintf(fid, '最大值: %.4f (图像: %s)\n', max_density, valid_names{max_idx});fprintf(fid, '最小值: %.4f (图像: %s)\n', min_density, valid_names{min_idx});
elsefprintf('\n没有有效的FADE计算结果\n');fprintf(fid, '\n没有有效的FADE计算结果\n');
end% 关闭文件
fclose(fid);
fprintf('\n结果已保存至: %s\n', output_file);
从主观上来看还是比较符合雾气的浓度对比,只是运行的时间比较的长。
density D
下载地址:JiaheZhang/HazDesNet: An End-to-End Network for Haze Density Prediction
这是一个Tensorflow的工程,好在只用装一个cpu的版本就能运行。
出现下面的问题,重新安装cv库没效果,后面发现需要安装的是一个补丁包
from cv2.ximgproc import guidedFilter
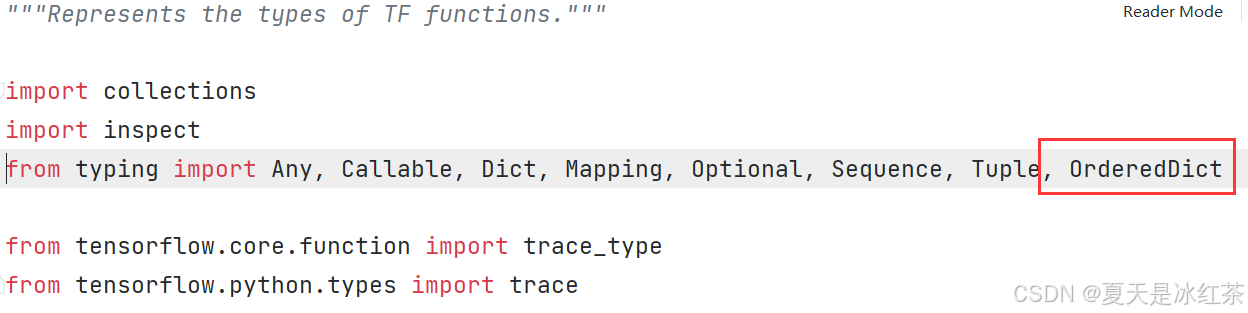
pip install opencv--contrib-python -i https://pypi.tuna.tsinghua.edu.cn/simpleImportError: cannot import name 'OrderedDict' from 'typing'
出现这个问题,解决方案:cannot import name ‘OrderedDict‘ from ‘typing‘错误的解决方法
先安装一个补丁库
pip install typing_extensions -i https://pypi.tuna.tsinghua.edu.cn/simple跳转进出现错误的地方,将这部份删除后
重新导入
from typing_extensions import OrderedDict有出现问题:
ImportError: urllib3 v2.0 only supports OpenSSL 1.1.1+, currently the 'ssl' module is compiled with 'OpenSSL 1.1.0i 14 Aug 2018'. See: https://github.com/urllib3/urllib3/issues/2168
根据其他的博客重新安装就好了:
pip install urllib3==1.26.15import cv2
from cv2.ximgproc import guidedFilter
# pip install opencv--contrib-python -i https://pypi.tuna.tsinghua.edu.cn/simple
import numpy as np
import model
import osdef density_D(image_path):img = cv2.imread(image_path)guide = cv2.cvtColor(img, cv2.COLOR_BGR2GRAY)img = np.expand_dims(img, axis=0)# predict one hazy imagehaz_des_map = HazDesNet.predict(img)haz_des_map = haz_des_map[0, :, :, 0]guide = cv2.resize(guide, (haz_des_map.shape[1], haz_des_map.shape[0]))haz_des_map = guidedFilter(guide=guide, src=haz_des_map, radius=32, eps=500)des_score = np.mean(haz_des_map)# cv2.imwrite(results_path, haz_des_map * 255)return des_scoreclass DataStatsCalculator:def __init__(self):self.data = {}self.total = 0.0self.count = 0self.max_val = -float('inf')self.min_val = float('inf')self.max_ids = []self.min_ids = []def update(self, identifier, value, verbose=False):"""Update statistics with new data point"""self.data[identifier] = valueself.total += valueself.count += 1# Update max value and identifiersif value > self.max_val:self.max_val = valueself.max_ids = [identifier]elif value == self.max_val:self.max_ids.append(identifier)# Update min value and identifiersif value < self.min_val:self.min_val = valueself.min_ids = [identifier]elif value == self.min_val:self.min_ids.append(identifier)if verbose:print(f"Added: {identifier} = {value}")def calculate(self):"""Calculate and return statistics"""if self.count == 0:return Noneavg = self.total / self.countreturn {'average': avg,'max_value': self.max_val,'max_identifiers': self.max_ids,'min_value': self.min_val,'min_identifiers': self.min_ids,'count': self.count}def save(self, filename='statistics.txt'):"""Save results to file"""stats = self.calculate()if stats is None:print("No valid data to save!")returnwith open(filename, 'w') as f:f.write("ID\tValue\n")for k, v in self.data.items():f.write(f"{k}\t{v:.4f}\n")f.write("\nStatistics:\n")f.write(f"Average: {stats['average']:.4f}\n")f.write(f"Max: {stats['max_value']:.4f} (IDs: {', '.join(stats['max_identifiers'])})\n")f.write(f"Min: {stats['min_value']:.4f} (IDs: {', '.join(stats['min_identifiers'])})\n")f.write(f"Total entries: {stats['count']}\n")if __name__ == "__main__":target_path = r'E:\PythonProject\img_processing_techniques_main\filter_image\LEVIR_DEHAZE\thick\hazy'results_path = './results'all_files = os.listdir(target_path)png_files = [file for file in all_files if file.lower().endswith('.png')]dsc = DataStatsCalculator()HazDesNet = model.load_HazDesNet()HazDesNet.summary()for image_name in png_files:image_path = os.path.join(target_path, image_name)des_score = density_D(image_path)dsc.update(image_path, des_score, verbose=True)# plt.imshow(haz_des_map, cmap='jet')# plt.show()print(dsc.calculate())这个相对来说还不错,不过它容易将天空场景给误识别,但因为我是做的遥感场景,所以相对来说影响不是很大。
AuthESI
下载地址:FoHIS: Towards Simulating Foggy and Hazy Images and Evaluating their Authenticity
这是一个python工程,运行compute_authenticity.py文件即可。
"""
Towards Simulating Foggy and Hazy Images and Evaluating their Authenticity
Ning Zhang, Lin Zhang*, and Zaixi Cheng
"""
import cv2
import numpy as np
import math
from PIL import Image
import guided_filter
import compute_aggd
import scipy.io as sioBLOCK_SIZE_ROW     = 48
BLOCK_SIZE_COL     = 48
NORMALIZED_WIDTH   = 528
FEATURE_NUMBER     = 16
GRADIENT_THRESHOLD_L = 3
GRADIENT_THRESHOLD_R = 60
DARK_CHANNEL_THRESHOLD_L = 30
DARK_CHANNEL_THRESHOLD_R = 100def authenticity(img):data = sio.loadmat('prisparam_16_hazeandfog.mat')# print(data)mu_prisparam1 = data['mu1']mu_prisparam2 = data['mu2']cov_prisparam1 = data['cov1']cov_prisparam2 = data['cov2']img = cv2.resize(cv2.imread(img), (NORMALIZED_WIDTH, NORMALIZED_WIDTH), interpolation=cv2.INTER_CUBIC)gray = cv2.cvtColor(img, cv2.COLOR_BGR2GRAY)block_rownum = math.floor(gray.shape[0]/BLOCK_SIZE_ROW)block_colnum = math.floor(gray.shape[1]/BLOCK_SIZE_COL)img = img[:block_rownum*BLOCK_SIZE_ROW, :block_colnum*BLOCK_SIZE_COL, :]gray = cv2.cvtColor(img, cv2.COLOR_BGR2LAB)[:, :, 0]# gradient magnitudegradx = cv2.Sobel(gray, cv2.CV_16S, 1, 0, ksize=3)grady = cv2.Sobel(gray, cv2.CV_16S, 0, 1, ksize=3)absX = cv2.convertScaleAbs(gradx)absY = cv2.convertScaleAbs(grady)gradient = cv2.addWeighted(absX, 0.5, absY, 0.5, 0)gradient2 = gradientgradient2[gradient2 < 20] = 0gradient2[gradient2 >= 20] =255# dark channeldark_image = np.asarray(guided_filter.getDark(Image.fromarray(np.uint8(img)), guided_filter.minimizeFilter, (10, 10)))quality = []features1_list_all = []  # haze-free featuresfeatures2_list_all = []  # haze featuresfor i in range(block_rownum):for j in range(block_colnum):features1_list = []  # haze-free featuresfeatures2_list = []  # haze featurescrop_row_start = i*BLOCK_SIZE_ROWcrop_row_end = (i+1)*BLOCK_SIZE_ROWcrop_col_start = j*BLOCK_SIZE_COLcrop_col_end = (j+1)*BLOCK_SIZE_COLcrop_gray = gray[crop_row_start: crop_row_end, crop_col_start:crop_col_end]crop_img = img[crop_row_start: crop_row_end, crop_col_start:crop_col_end]crop_gradient = gradient[crop_row_start: crop_row_end, crop_col_start:crop_col_end]crop_gradient2 = gradient2[crop_row_start: crop_row_end, crop_col_start:crop_col_end]crop_dark_image = dark_image[crop_row_start: crop_row_end, crop_col_start:crop_col_end]if np.mean(crop_dark_image) < DARK_CHANNEL_THRESHOLD_L:if np.count_nonzero(crop_gradient2) > 400:# print('1', crop_gray.astype(np.float64))features1_list.extend(compute_aggd.compute_features(crop_gray.astype(np.float64), crop_gradient.astype(np.float64)))cv2.rectangle(img, (crop_col_start, crop_row_start), (crop_col_end, crop_row_end), (0, 255, 0))else:# print('2', crop_gray.astype(np.float64))features1_list.extend(compute_aggd.compute_features(crop_gray.astype(np.float64), crop_gradient.astype(np.float64)))cv2.rectangle(img, (crop_col_start, crop_row_start), (crop_col_end, crop_row_end), (255, 0, 0))elif np.mean(crop_dark_image) >= DARK_CHANNEL_THRESHOLD_L:features2_list.extend(compute_aggd.compute_features(crop_gray.astype(np.float64), crop_gradient.astype(np.float64)))cv2.rectangle(img, (crop_col_start, crop_row_start), (crop_col_end, crop_row_end), (255, 0, 255))features1_list_all.extend(features1_list)features2_list_all.extend(features2_list)if len(features1_list_all) != 0:features1 = np.array(features1_list_all).reshape((int(len(features1_list_all)/FEATURE_NUMBER)), FEATURE_NUMBER)if features1.shape[0] >1:mu_distparam1 = (np.mean(features1, axis=0))cov_distparam1 = np.cov(features1.reshape(features1.shape[1], features1.shape[0]))invcov_param1 = np.linalg.inv((cov_prisparam1+cov_distparam1)/2)q1 = np.sqrt(np.dot(np.dot((mu_prisparam1-mu_distparam1),invcov_param1), np.transpose(mu_prisparam1-mu_distparam1)))quality.append(np.nanmean(q1))else:features2_list_all.extend(features2_list_all)if len(features2_list_all) != 0:features2 = np.array(features2_list_all).reshape((int(len(features2_list_all)/FEATURE_NUMBER)), FEATURE_NUMBER)mu_distparam2 = (np.mean(features2, axis=0))cov_distparam2 = np.cov(features2.reshape(features2.shape[1], features2.shape[0]))invcov_param2 = np.linalg.inv((cov_prisparam2+cov_distparam2)/2)q2 = np.sqrt(np.dot(np.dot((mu_prisparam2-mu_distparam2),invcov_param2), np.transpose(mu_prisparam2-mu_distparam2)))quality.append(np.nanmean(q2))r = 0# print(quality)for i in quality:r += ireturn rif __name__=="__main__":import pyzjrimage_paths = pyzjr.get_image_path(r"E:\PythonProject\img_processing_techniques_main\filter_image\LEVIR_DEHAZE\thick\hazy")AuthESI = pyzjr.AverageMeter()for path in image_paths:r = authenticity(path)AuthESI.update(r)print(f'{path} A: {AuthESI.val} ({AuthESI.avg})')
这是我修改过后遍历文件夹的版本,但是我看网上说AuthESI是用于评估合成雾的真实性,而且里面很多的参数都是依靠认为设定的,感觉我这里不太能用的上。
E:/PythonProject/img_processing_techniques_main/filter_image/LEVIR_DEHAZE/thick/hazy/airplane_1.png A: 0.46001594265470536 (0.46001594265470536)
E:/PythonProject/img_processing_techniques_main/filter_image/LEVIR_DEHAZE/thick/hazy/airplane_2.png A: 2.006452327939024 (1.2332341352968645)
E:/PythonProject/img_processing_techniques_main/filter_image/LEVIR_DEHAZE/thick/hazy/airplane_3.png A: 2.606442689835228 (1.6909703201429858)
E:/PythonProject/img_processing_techniques_main/filter_image/LEVIR_DEHAZE/thick/hazy/airplane_4.png A: 1.8098348473257968 (1.7206864519386884)
E:/PythonProject/img_processing_techniques_main/filter_image/LEVIR_DEHAZE/thick/hazy/airplane_5.png A: 1.0421387569025702 (1.5849769129314648)
后面我测试了几张图,感觉与雾气浓度无关,不是我想要的。
JSFD
下载地址:ImageFogDensityEsitmation
这是一个matlab工程,我这里使用的是matlab2016a,可正常使用。
%DaiEestiFogDensityValBy3FeaturesFuse.m
%Esitimate fog density using image according to three image features:
%1.Average S values in HSV format
%2.Rate of white points in ranged points
%3.Jdark, i.e. dark channel map
%Input: a folder of images in the format "png","jpg", of "jpeg".
%Output:Estimated fog density of each image, and save to% clear all;
disp('**Estimate fog density of RGB image using our method** ');
%----threshold begin
VarThresh  = 0.018^2; % 0.065;
Scal = 1;%------end threshold--------------opfilePath = uigetdir('..');  %Open image folder,analysis all image in the folder
img_path_list = dir(strcat(opfilePath,'\*.png' ));%image list
img_num = length(img_path_list);%the number of images
if img_num<1img_path_list = dir(strcat(opfilePath,'\*.jpg' ));%image listimg_num = length(img_path_list);%the number of images
end
if img_num<1img_path_list = dir(strcat(opfilePath,'\*.jpeg' ));%image listimg_num = length(img_path_list);%the number of images
end
if img_num<1img_path_list = dir(strcat(opfilePath,'\*.bmp' ));%image listimg_num = length(img_path_list);%the number of images
end
%
F2S =zeros(img_num,1);%record average s-values
rgdVar = zeros(img_num,1);%Rate of white points in ranged points
Fdark  = zeros(img_num,1);%Jdark, i.e. dark channel map fileNm=[];
%读取每辐图像,并计算特征
tic
ImgOpend = 0;
for q = 1:img_num %逐一读取有雾图像image_name = img_path_list(q).name  % 图像名ImgOpend = ImgOpend+1;fileNm{ImgOpend,1}=image_name;J = [];J = imread(strcat(opfilePath,'\',image_name));%Fea1: s meanHSVi = rgb2hsv(J);Si = HSVi(:,:,2) ;[m, n] = size( Si );F2S(ImgOpend,1) = mean(Si(:));%Fea2: rate of white points in all pointsJ1 = double(J)./255;Xm = sum(J1,3);X2 =  sum(J1.^2,3);varM = (X2- Xm.^2/3)/2;%每个像素点的色彩方差varMv = varM(:);idx = find( varMv  < VarThresh );%方差在一定范围内的点所占比例rgdVar(ImgOpend,1) = size(idx,1)/m/n;   %Fea3: JdarkJdark = darkChannel3onlyDark( J,3,0.95);[m,n]=size(Jdark); Dkv=[];Dkv = double(Jdark(:));idx = find(Dkv<0.85);Dkv1 = Dkv(idx);Fdark(ImgOpend,1) = mean(Dkv1 );
end%end q%转化为雾浓度估计
VisD = 500; %默认500;  %无雾图像强度信息
P2 = 0.05;  % 默认 0.05;
P3 = 20000;%默认20000
maxS =  max( F2S );
AdjLight = maxS *( 1+ P2 * exp( VisD*VisD/P3/P3 ) );
AdjF2S = F2S/AdjLight;
LowR = min( min( rgdVar ),0.3);
AdjRgdVar = (rgdVar-LowR)/(1-LowR);
alph1 = 0.50; %默认
alph2 = 0.25;%city %0.45;
Fden = alph1*(1- AdjF2S ) + alph2* AdjRgdVar + (1-alph1-alph2)*Fdark; % stdlizedresultFile = fopen('fog_density_results.txt', 'w');
fprintf('Image Name\tFog Density\n');
fprintf(resultFile, 'Image Name\tFog Density\n');% 打印每幅图像的结果
for i = 1:img_numfprintf('%s\t%.4f\n', fileNm{i}, Fden(i));fprintf(resultFile, '%s\t%.4f\n', fileNm{i}, Fden(i));
end[~, maxIdx] = max(Fden);
[~, minIdx] = min(Fden);
avgFden = mean(Fden);fprintf('\nStatistics:\n');
fprintf('Average Fog Density: %.4f\n', avgFden);
fprintf('Max Fog Density: %.4f (Image: %s)\n', Fden(maxIdx), fileNm{maxIdx});
fprintf('Min Fog Density: %.4f (Image: %s)\n', Fden(minIdx), fileNm{minIdx});fprintf(resultFile, '\nStatistics:\n');
fprintf(resultFile, 'Average Fog Density: %.4f\n', avgFden);
fprintf(resultFile, 'Max Fog Density: %.4f (Image: %s)\n', Fden(maxIdx), fileNm{maxIdx});
fprintf(resultFile, 'Min Fog Density: %.4f (Image: %s)\n', Fden(minIdx), fileNm{minIdx});fclose(resultFile);
我删去了画图和保存的表格的相关代码,保留了计算的逻辑,并将内容存入txt文件当中,感觉这个还是相对比较准确的,就是遍历运算的时间感觉比较的长。
参考论文
Referenceless Prediction of Perceptual Fog Density and Perceptual Image Defogging
HazDesNet: An End-to-End Network for Haze Density Prediction
Towards Simulating Foggy and Hazy Images and Evaluating Their Authenticity
Image based fog density estimation