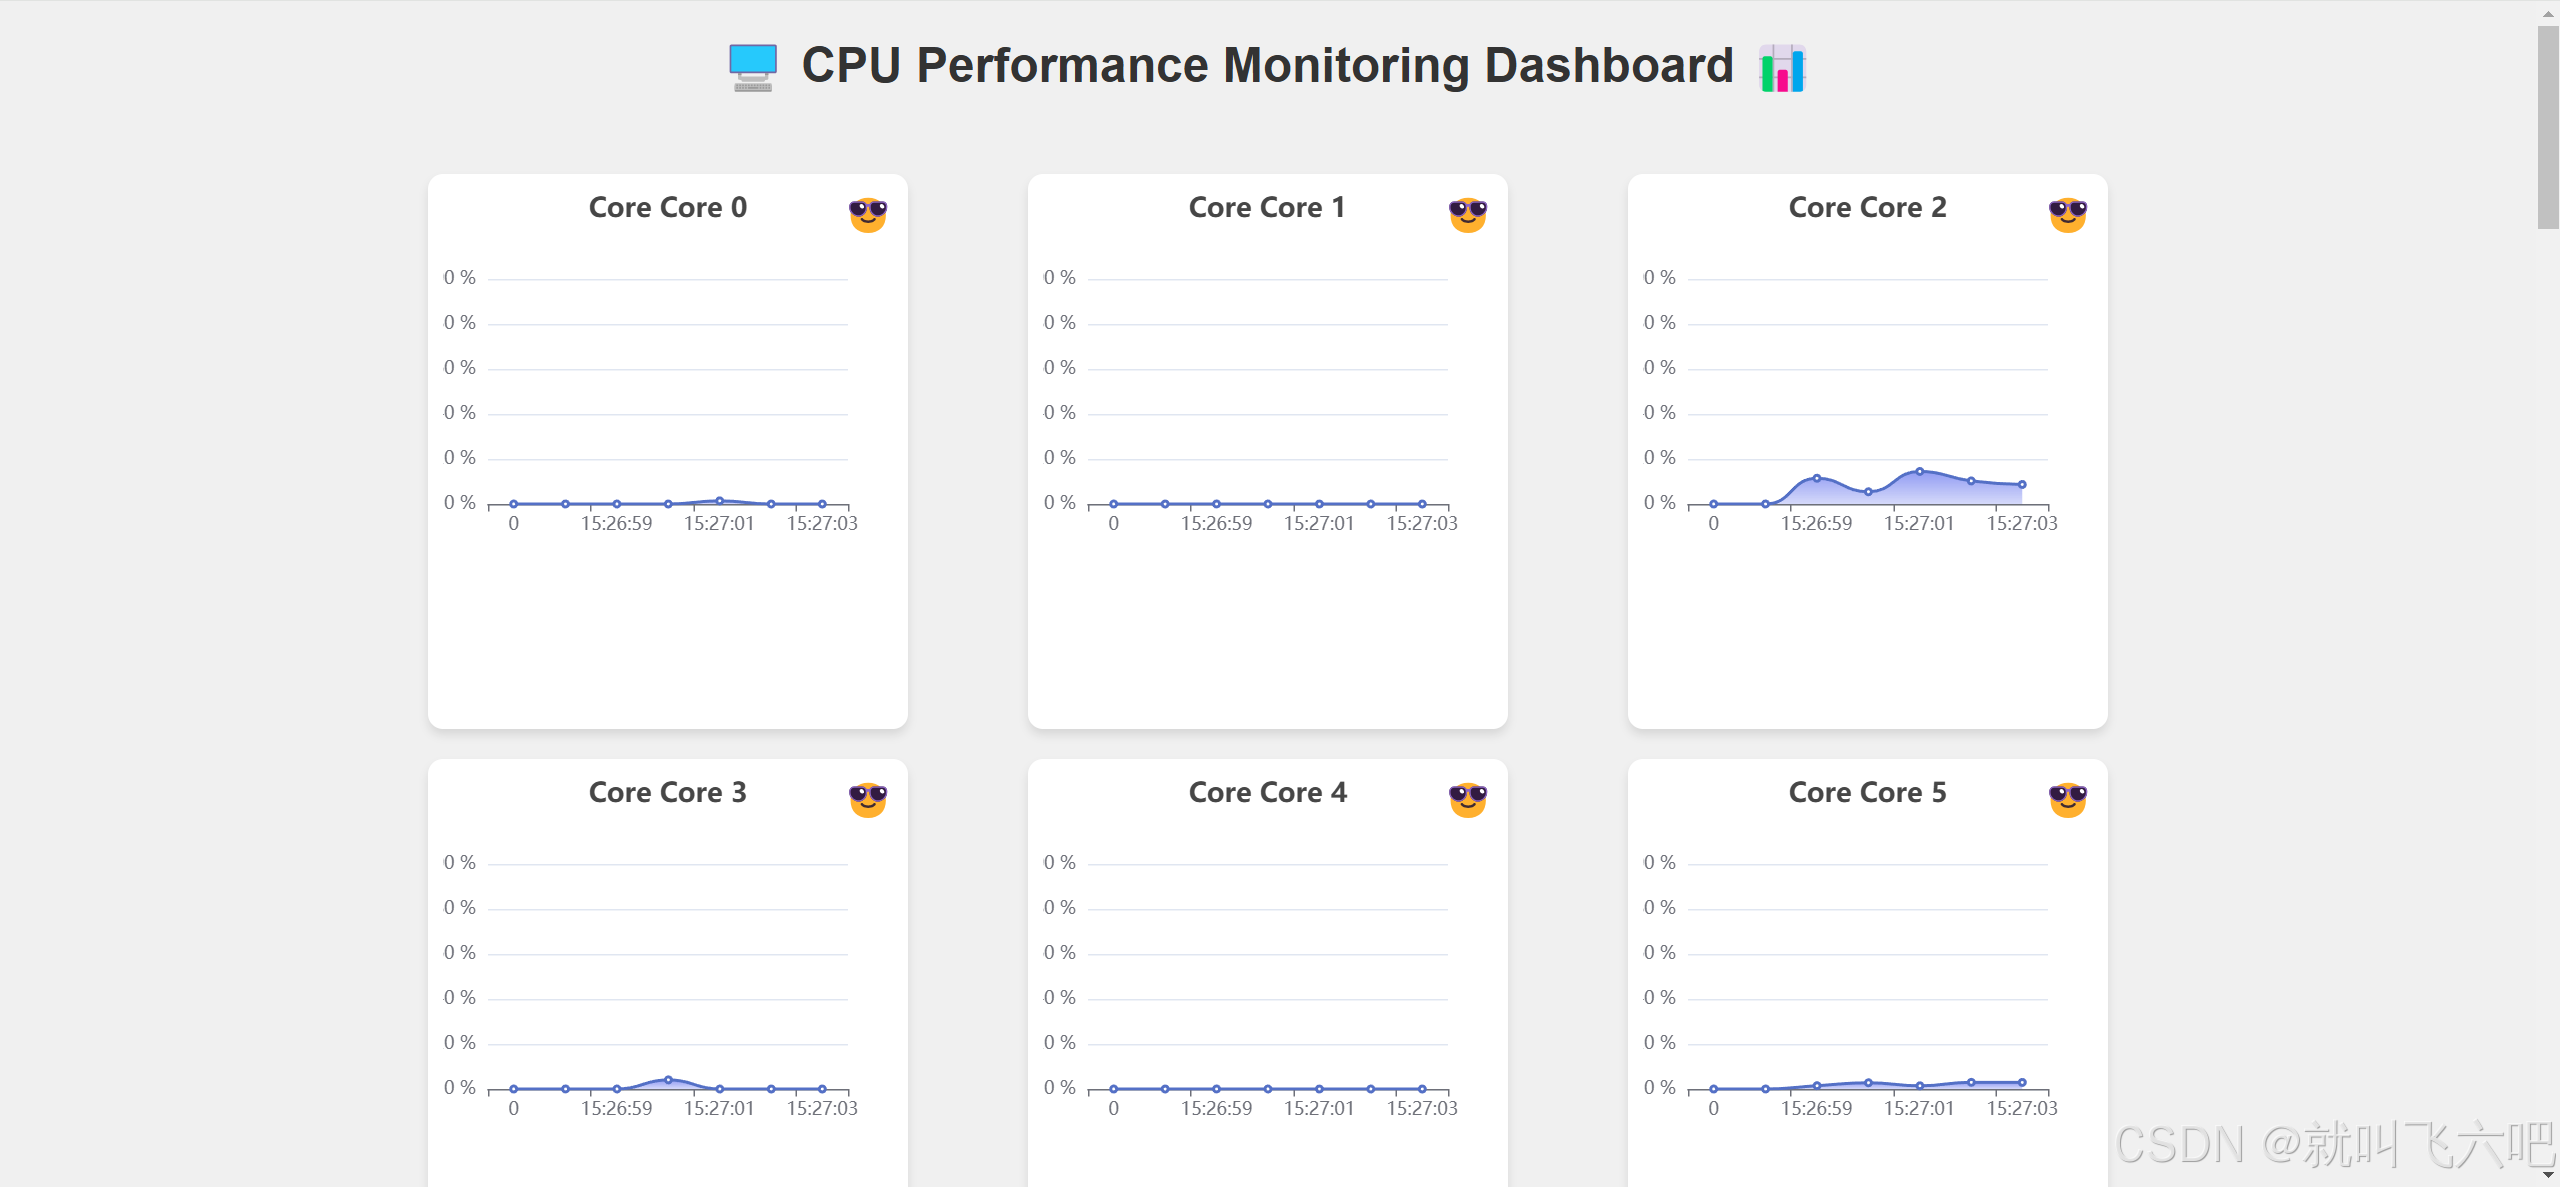
项目基于oshi库快速搭建一个cpu监控面板
后端:
<dependency><groupId>org.springframework.boot</groupId><artifactId>spring-boot-starter-web</artifactId></dependency><dependency><groupId>com.github.oshi</groupId><artifactId>oshi-core</artifactId><version>5.8.5</version></dependency>
package org.example.cputest;import com.fasterxml.jackson.core.JsonProcessingException;
import com.fasterxml.jackson.databind.ObjectMapper;
import org.springframework.web.bind.annotation.CrossOrigin;
import org.springframework.web.bind.annotation.GetMapping;
import org.springframework.web.bind.annotation.RequestMapping;
import org.springframework.web.bind.annotation.RestController;
import oshi.SystemInfo;
import oshi.hardware.CentralProcessor;
import oshi.hardware.HardwareAbstractionLayer;import java.util.Comparator;
import java.util.Map;
import java.util.TreeMap;@CrossOrigin("*")
@RestController
@RequestMapping("/api/cpu")
public class CpuUsageController {private final SystemInfo systemInfo = new SystemInfo();private final HardwareAbstractionLayer hardware = systemInfo.getHardware();private final CentralProcessor processor = hardware.getProcessor();private long[][] prevTicks = processor.getProcessorCpuLoadTicks();@GetMapping("/usage")public String getCpuUsage() throws JsonProcessingException {// 获取当前的 tick 数long[][] ticks = processor.getProcessorCpuLoadTicks();// 获取 CPU 核心数int logicalProcessorCount = processor.getLogicalProcessorCount();// 计算每个核心的 CPU 使用率Map<String, Double> cpuUsages = new TreeMap<>(new Comparator<String>() {@Overridepublic int compare(String core1, String core2) {int num1 = Integer.parseInt(core1.replace("Core ", ""));int num2 = Integer.parseInt(core2.replace("Core ", ""));return Integer.compare(num1, num2);}});for (int i = 0; i < logicalProcessorCount; i++) {long user = ticks[i][CentralProcessor.TickType.USER.getIndex()] - prevTicks[i][CentralProcessor.TickType.USER.getIndex()];long nice = ticks[i][CentralProcessor.TickType.NICE.getIndex()] - prevTicks[i][CentralProcessor.TickType.NICE.getIndex()];long sys = ticks[i][CentralProcessor.TickType.SYSTEM.getIndex()] - prevTicks[i][CentralProcessor.TickType.SYSTEM.getIndex()];long idle = ticks[i][CentralProcessor.TickType.IDLE.getIndex()] - prevTicks[i][CentralProcessor.TickType.IDLE.getIndex()];long iowait = ticks[i][CentralProcessor.TickType.IOWAIT.getIndex()] - prevTicks[i][CentralProcessor.TickType.IOWAIT.getIndex()];long irq = ticks[i][CentralProcessor.TickType.IRQ.getIndex()] - prevTicks[i][CentralProcessor.TickType.IRQ.getIndex()];long softirq = ticks[i][CentralProcessor.TickType.SOFTIRQ.getIndex()] - prevTicks[i][CentralProcessor.TickType.SOFTIRQ.getIndex()];long steal = ticks[i][CentralProcessor.TickType.STEAL.getIndex()] - prevTicks[i][CentralProcessor.TickType.STEAL.getIndex()];long totalCpu = user + nice + sys + idle + iowait + irq + softirq + steal;// 检查 totalCpu 是否为零if (totalCpu == 0) {cpuUsages.put("Core " + i, 0.0);} else {double cpuUsage = (totalCpu - idle) * 100.0 / totalCpu;cpuUsages.put("Core " + i, cpuUsage);}}// 更新 prevTicksSystem.arraycopy(ticks, 0, prevTicks, 0, ticks.length);// 将结果转换为 JSON 字符串ObjectMapper objectMapper = new ObjectMapper();return objectMapper.writeValueAsString(cpuUsages);}
}
前端
<!DOCTYPE html>
<html lang="en">
<head><meta charset="UTF-8"><meta name="viewport" content="width=device-width, initial-scale=1.0"><title>Dynamic CPU Performance Monitor 🖥️</title><!-- Vue and ECharts CDN --><script src="https://cdn.jsdelivr.net/npm/vue@2"></script><script src="https://cdn.jsdelivr.net/npm/echarts@5.3.2/dist/echarts.min.js"></script><style>body {font-family: Arial, sans-serif;background-color: #f0f0f0;text-align: center;}#app {display: flex;flex-wrap: wrap;justify-content: space-around;max-width: 1200px;margin: 0 auto;padding: 20px;}.chart-container {width: 300px;height: 350px;margin: 10px;background-color: white;border-radius: 10px;box-shadow: 0 4px 6px rgba(0,0,0,0.1);padding: 10px;position: relative;}.core-status {position: absolute;top: 10px;right: 10px;font-size: 24px;}h1 {color: #333;display: flex;align-items: center;justify-content: center;}h1 span {margin: 0 10px;}</style>
</head>
<body>
<h1><span>🖥️</span>CPU Performance Monitoring Dashboard<span>📊</span>
</h1>
<div id="app"><div v-for="(usage, core) in cpuUsageData" :key="core" class="chart-container"><div class="core-status"><span v-if="usage < 30">😎</span><span v-else-if="usage < 60">😓</span><span v-else-if="usage < 80">🥵</span><span v-else>🔥</span></div><div :ref="`chart-${core}`" style="width: 100%; height: 280px;"></div></div>
</div><script>// Create Vue instancenew Vue({el: '#app',data: {cpuUsageData: {},timeStamps: Array.from({length: 7}, () => 0)},mounted() {// Start timer to update data every secondthis.updateChart();},methods: {async updateChart() {try {// Fetch CPU usage dataconst response = await fetch('http://localhost:8080/api/cpu/usage');const data = await response.json();// Update CPU usage datathis.cpuUsageData = data;// Update timestampsthis.timeStamps.shift();this.timeStamps.push(new Date().toLocaleTimeString());// Iterate through each core, initialize or update EChartsObject.keys(this.cpuUsageData).forEach(core => {const usage = this.cpuUsageData[core];const chartContainer = this.$refs[`chart-${core}`][0];// Initialize chart if not existsif (!chartContainer.__chart) {chartContainer.__chart = echarts.init(chartContainer);chartContainer.__chart.setOption({title: {text: `Core ${core}`,left: 'center'},tooltip: {trigger: 'axis'},xAxis: {type: 'category',data: this.timeStamps},yAxis: {type: 'value',axisLabel: {formatter: '{value} %'},min: 0,max: 100},series: [{name: 'CPU Usage',type: 'line',smooth: true,  // 使线条平滑areaStyle: {color: new echarts.graphic.LinearGradient(0, 0, 0, 1, [{offset: 0, color: 'rgba(58,77,233,0.8)'},{offset: 1, color: 'rgba(58,77,233,0.3)'}])},data: Array.from({length: 7}, () => 0)}]});}// Update chart dataconst seriesData = chartContainer.__chart.getOption().series[0].data;seriesData.shift();seriesData.push(usage);chartContainer.__chart.setOption({xAxis: {data: this.timeStamps},series: [{data: seriesData}]});});} catch (error) {console.error('Error fetching CPU usage data:', error);}// Update every secondsetTimeout(this.updateChart, 1000);}}});
</script>
</body>
</html>