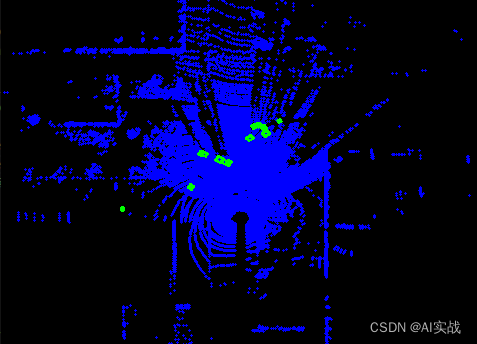
将3D检测的box框投影到BEV图片上
前言
点云数据作为一种丰富的三维空间信息表达方式,通常用于自动驾驶、机器人导航和三维建模等领域。然而,点云数据的直观性不如二维图像,这限制了它在一些需要快速视觉反馈的应用场景中的使用。本文将探讨如何将点云数据转换为二维图像,并介绍相关的技术和实践方法。
实现原理
将3D Box进行投影到图片上。
width, height = 480, 480
image = np.zeros((height, width, 3), dtype=np.uint8)dis_x_thresh =50
dis_y_thresh =40
# 遍历每个点,并在图像上绘制
for point in points:if abs(point[1]) < dis_y_thresh or point[0] > dis_x_thresh:x = (dis_y_thresh-point[1]) * width /(dis_y_thresh*2)  #此处的x对应于点云的yy = (dis_x_thresh-point[0]) * height /(dis_x_thresh*2)
代码实现
#获取3dbox检测框
def load_groundtruth(gt_file):with open(gt_file, "r") as hd:objects = json.load(hd)return objects
#获取检测框的角点
def get_obj_corners(obj):center = [obj["Center"]["CenterX"], obj["Center"]["CenterY"], obj["Center"]["CenterZ"]]size = [obj["Size"]["ObjectLength"], obj["Size"]["ObjectWidth"], obj["Size"]["ObjectHeight"]]yaw = obj["Yaw"]rot = np.asmatrix([[math.cos(yaw), -math.sin(yaw)],\[math.sin(yaw),  math.cos(yaw)]])plain_pts = np.asmatrix([[0.5 * size[0], 0.5*size[1]],\[0.5 * size[0], -0.5*size[1]],\[-0.5 * size[0], -0.5*size[1]],\[-0.5 * size[0], 0.5*size[1]]])tran_pts = np.asarray(rot * plain_pts.transpose())tran_pts = tran_pts.transpose()corners = np.arange(24).astype(np.float32).reshape(8, 3)for i in range(8):corners[i][0] = center[0] + tran_pts[i%4][0]corners[i][1] = center[1] + tran_pts[i%4][1]corners[i][2] = center[2] + (float(i >= 4) - 0.5) * size[2]return corners
#将3d box投影映射到Bev图片上。
for obj in objects:corners = get_obj_corners(obj)x1 = (dis_y_thresh-corners[0][1]) * width /(dis_y_thresh*2)y1 = (dis_x_thresh-corners[0][0]) * height /(dis_x_thresh*2)x2 = (dis_y_thresh-corners[1][1]) * width /(dis_y_thresh*2)y2 = (dis_x_thresh-corners[1][0]) * height /(dis_x_thresh*2)x3 = (dis_y_thresh-corners[2][1]) * width /(dis_y_thresh*2)y3 = (dis_x_thresh-corners[2][0]) * height /(dis_x_thresh*2)x4 = (dis_y_thresh-corners[3][1]) * width /(dis_y_thresh*2)y4 = (dis_x_thresh-corners[3][0]) * height /(dis_x_thresh*2)box = np.array([int(x1),int(y1),int(x2),int(y2),int(x3),int(y3),int(x4),int(y4)])boxs = box.reshape((-1,2))cv2.drawContours(image, [boxs], 0, (0, 255, 0), 2)结果可视化