echarts柱状图实现左右横向对比
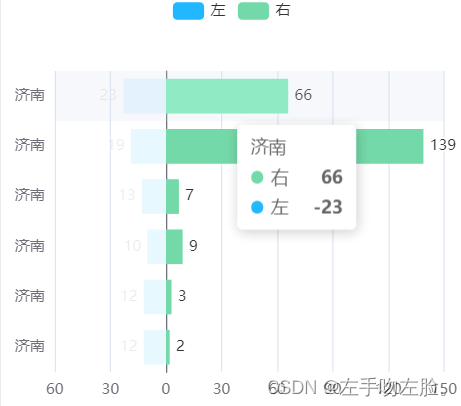
实现效果如上图
其实是两组数据,其中一组数据改为负数,然后 在展示的时候,在将负数取反
第一处修改坐标轴
xAxis: [{type: 'value',axisLabel: {formatter: function (value) {if (value < 0) {return -value;}else{return value;}}}}],第二处修改数据,转负为正
{name: '左',type: 'bar',color: '#21B8FF',stack: '总量',label: {show: true,position: 'left',formatter: function (value) {if (value.data < 0) {return -value.data;}},},emphasis: {focus: 'series'},data: [-12, -12, -10, -13, -19, -23, -21, -34, -22, -12]}这里数据如果初始为正,先便利一遍加负号
我的全部代码
<template><div id="echarts11"></div>
</template><script setup>
import * as echarts from "echarts";
const emit = defineEmits();const props = defineProps({echartList: {default: [],},dolDate: {defalut: false}
});
const initChart = () => {let xdata = [];let ydata1 = [];let ydata2 = [];let xdataid = [];props.echartList.forEach((item) => {xdata.push(item.cityName);// xdataid.push(item.cityId);ydata1.push(item.parkArea);ydata2 = [-15, -25, -35, -45, -55]// ydata2.push(item.water);});const machart = echarts.init(document.getElementById("echarts11"));var option = {tooltip: {trigger: 'axis',axisPointer: {            // 坐标轴指示器,坐标轴触发有效type: 'shadow'        // 默认为直线,可选为:'line' | 'shadow'}},legend: {data: ['左', '右']},grid: {left: '3%',right: '4%',bottom: '3%',containLabel: true},xAxis: [{type: 'value',axisLabel: {formatter: function (value) {if (value < 0) {return -value;}else{return value;}}}}],yAxis: [{type: 'category',axisTick: {show: false},data:xdata}],series: [{name: '右',type: 'bar',color: '#74D9A9',stack: '总量',label: {show: true,position: 'right'},emphasis: {focus: 'series'},data: [2, 3, 9, 7, 139, 66, 42, 16, 9, 10]},{name: '左',type: 'bar',color: '#21B8FF',stack: '总量',label: {show: true,position: 'left',formatter: function (value) {if (value.data < 0) {return -value.data;}},},emphasis: {focus: 'series'},data: [-12, -12, -10, -13, -19, -23, -21, -34, -22, -12]}]};machart.setOption(option);setTimeout(() => {window.addEventListener("resize", resizeFn);}, 100);const resizeFn = () => {return machart.resize();};machart.on("click", (params) => {if (params.componentType === "series") {const dataIndex = params.dataIndex;const yValue = xdata[dataIndex]; // 获取对应柱子的y值// const cidtyid = xdataid[dataIndex]; // 获取对应柱子的y值emit("changedi", yValue);// 在这里你可以对获取到的y值进行其他操作,比如弹窗显示等}});
};
setTimeout(() => {initChart();
}, 800);
defineExpose({initChart,
});
onBeforeUnmount(() => {// 离开页面必须进行移除,否则会造成内存泄漏,导致卡顿window.removeEventListener("resize", initChart);
});
watch(() => props.echartList,(newVal, oldVal) => {if (newVal !== oldVal) {initChart();}}
);
</script><style scoped>
#echarts11 {width: 100%;height: 90%;/* height:    calc(30vh- 10px); */
}
</style>