ArcgisForJs快速入门
文章目录
- 0.引言
- 1.前端代码编辑工具
- 2.使用ArcgisForJs创建一个简单应用
- 3.切片地图服务图层
- 4.动态地图服务图层
- 5.地图事件
0.引言
ArcGIS API for JavaScript是一款由Esri公司开发的用于创建WebGIS应用的JavaScript库。它允许开发者通过调用ArcGIS Server的REST API,将地图资源和其它资源(如ArcGIS Online)嵌入到Web应用中。ArcGIS API for JavaScript提供了丰富的功能,包括页面布局、地图图层、空间坐标转换、要素符号、专题图、属性查询、空间分析、三维场景、小部件、渲染器等。本文介绍如何快速入门ArcgisForJs。
1.前端代码编辑工具
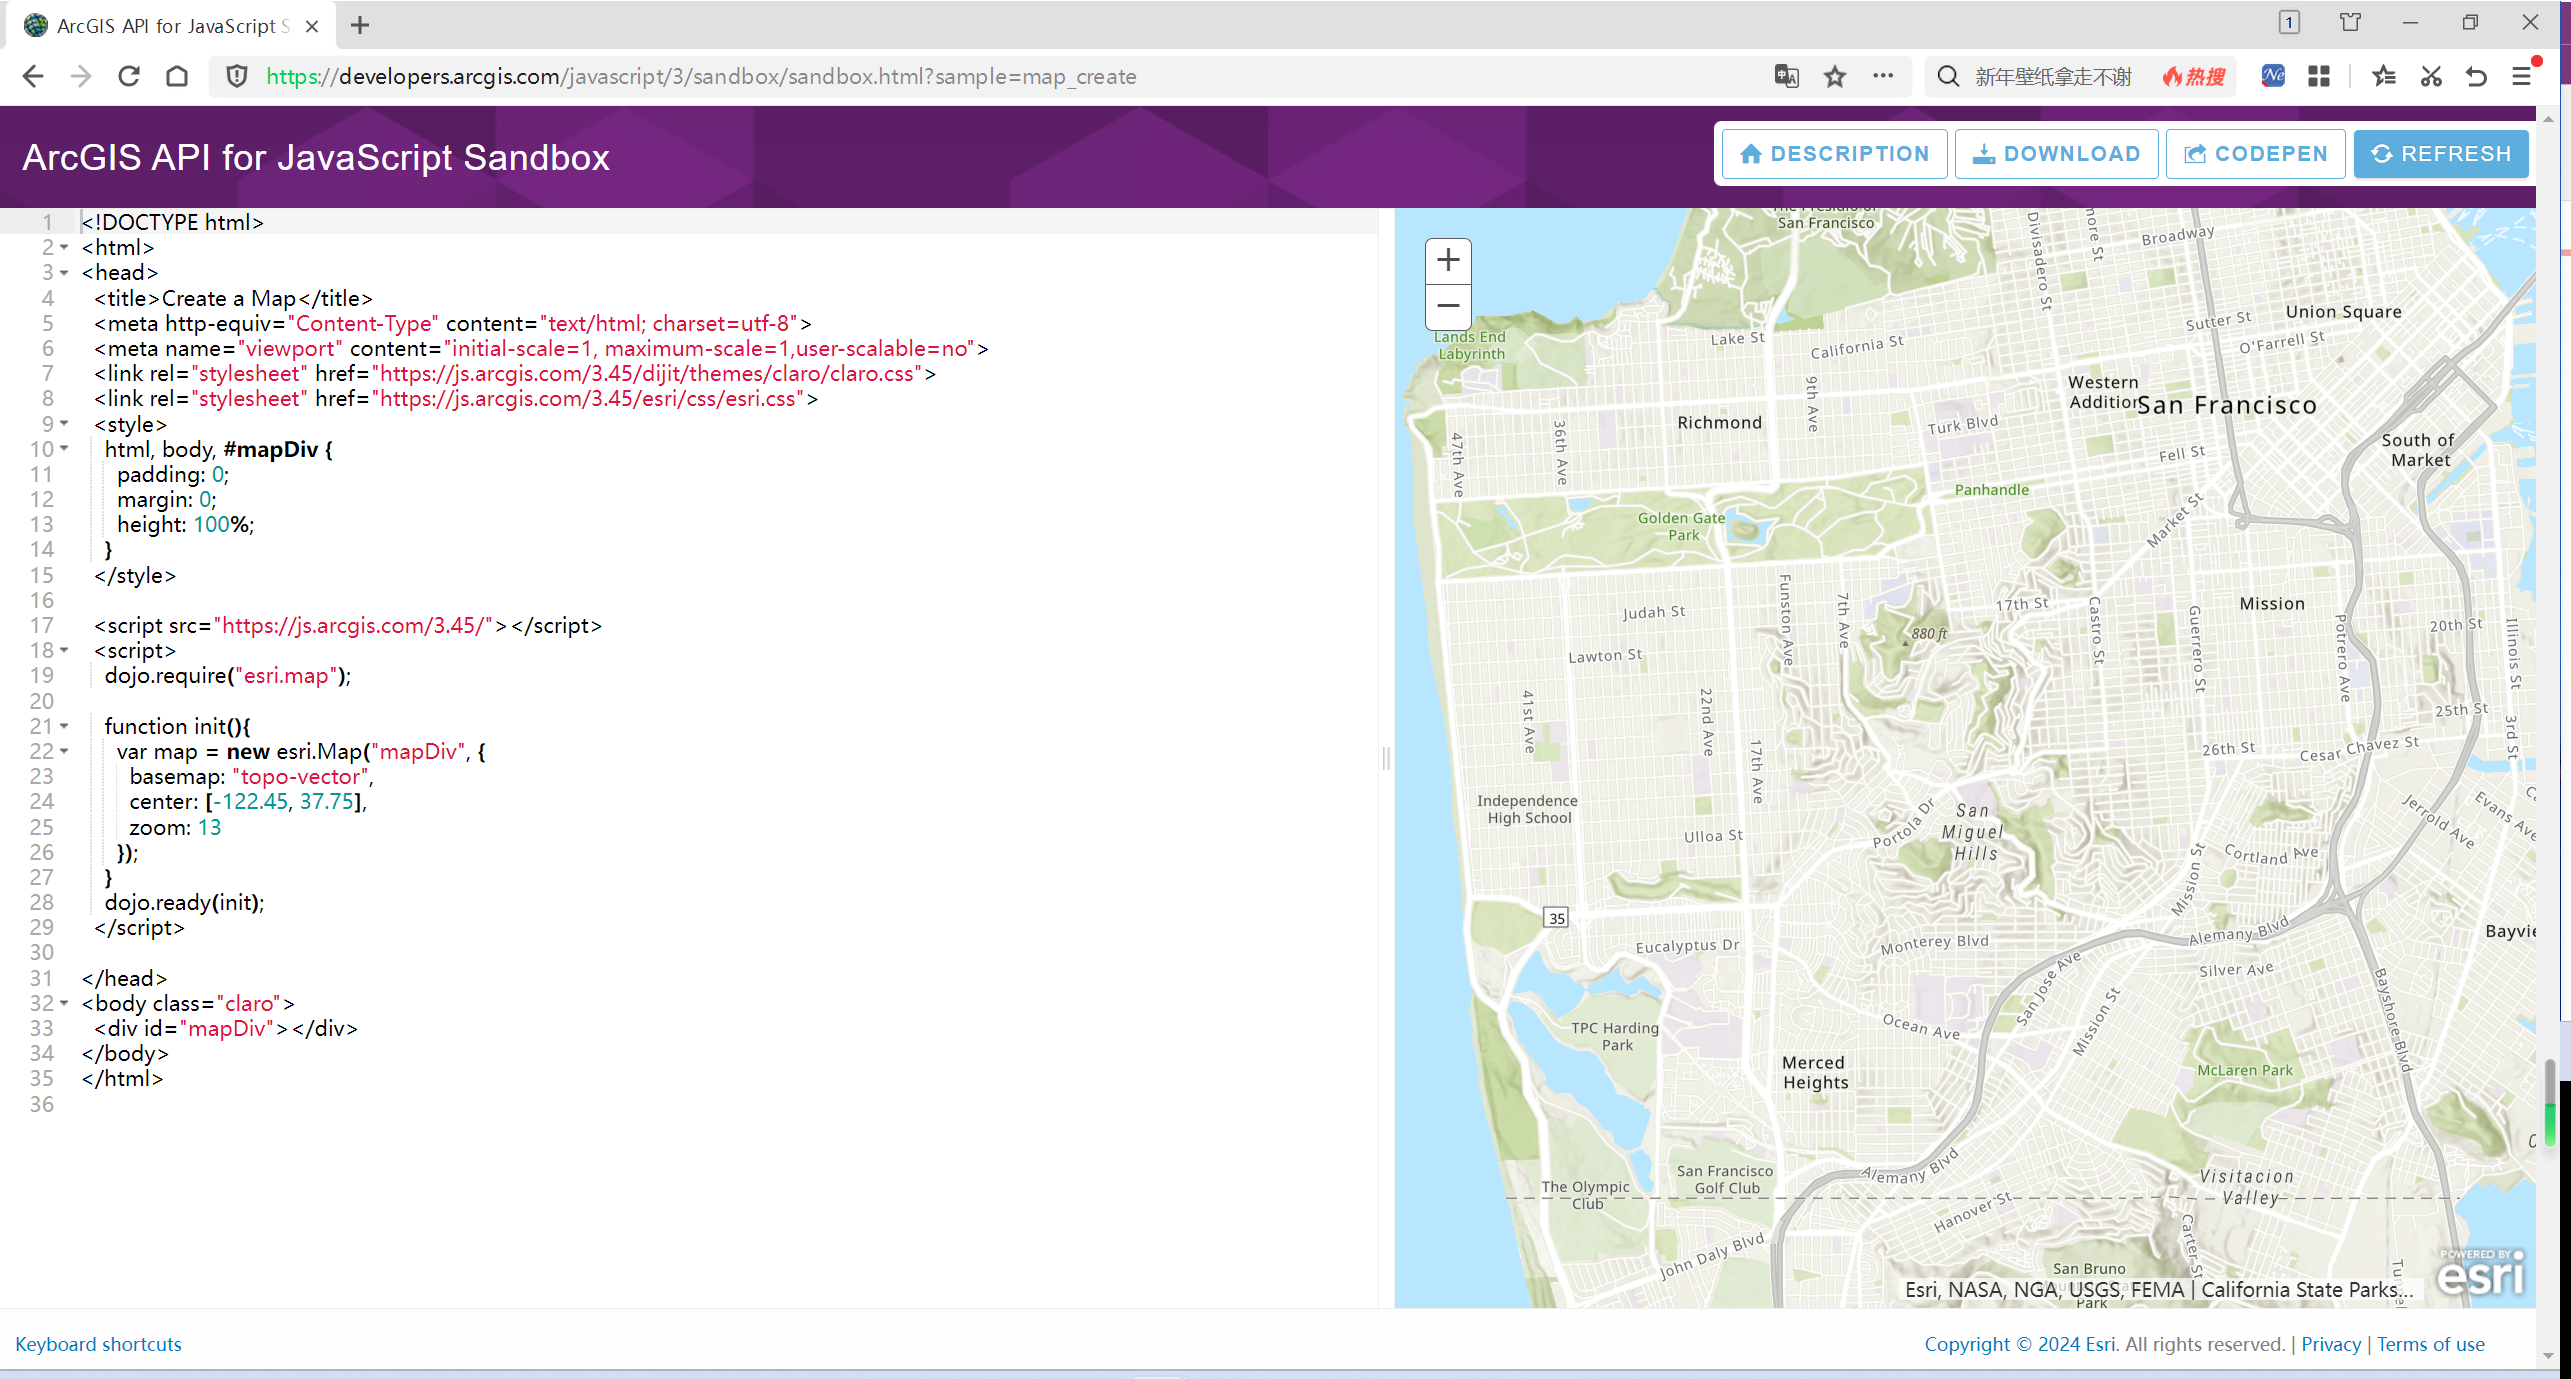
(1)ArcgisForJs沙盒
ArcgisForJs的代码编写和测试在沙盒中进行。
ArcgisForJs沙盒可以访问: https://developers.arcgis.com/javascript/3/sandbox/sandbox.html?sample=map_create
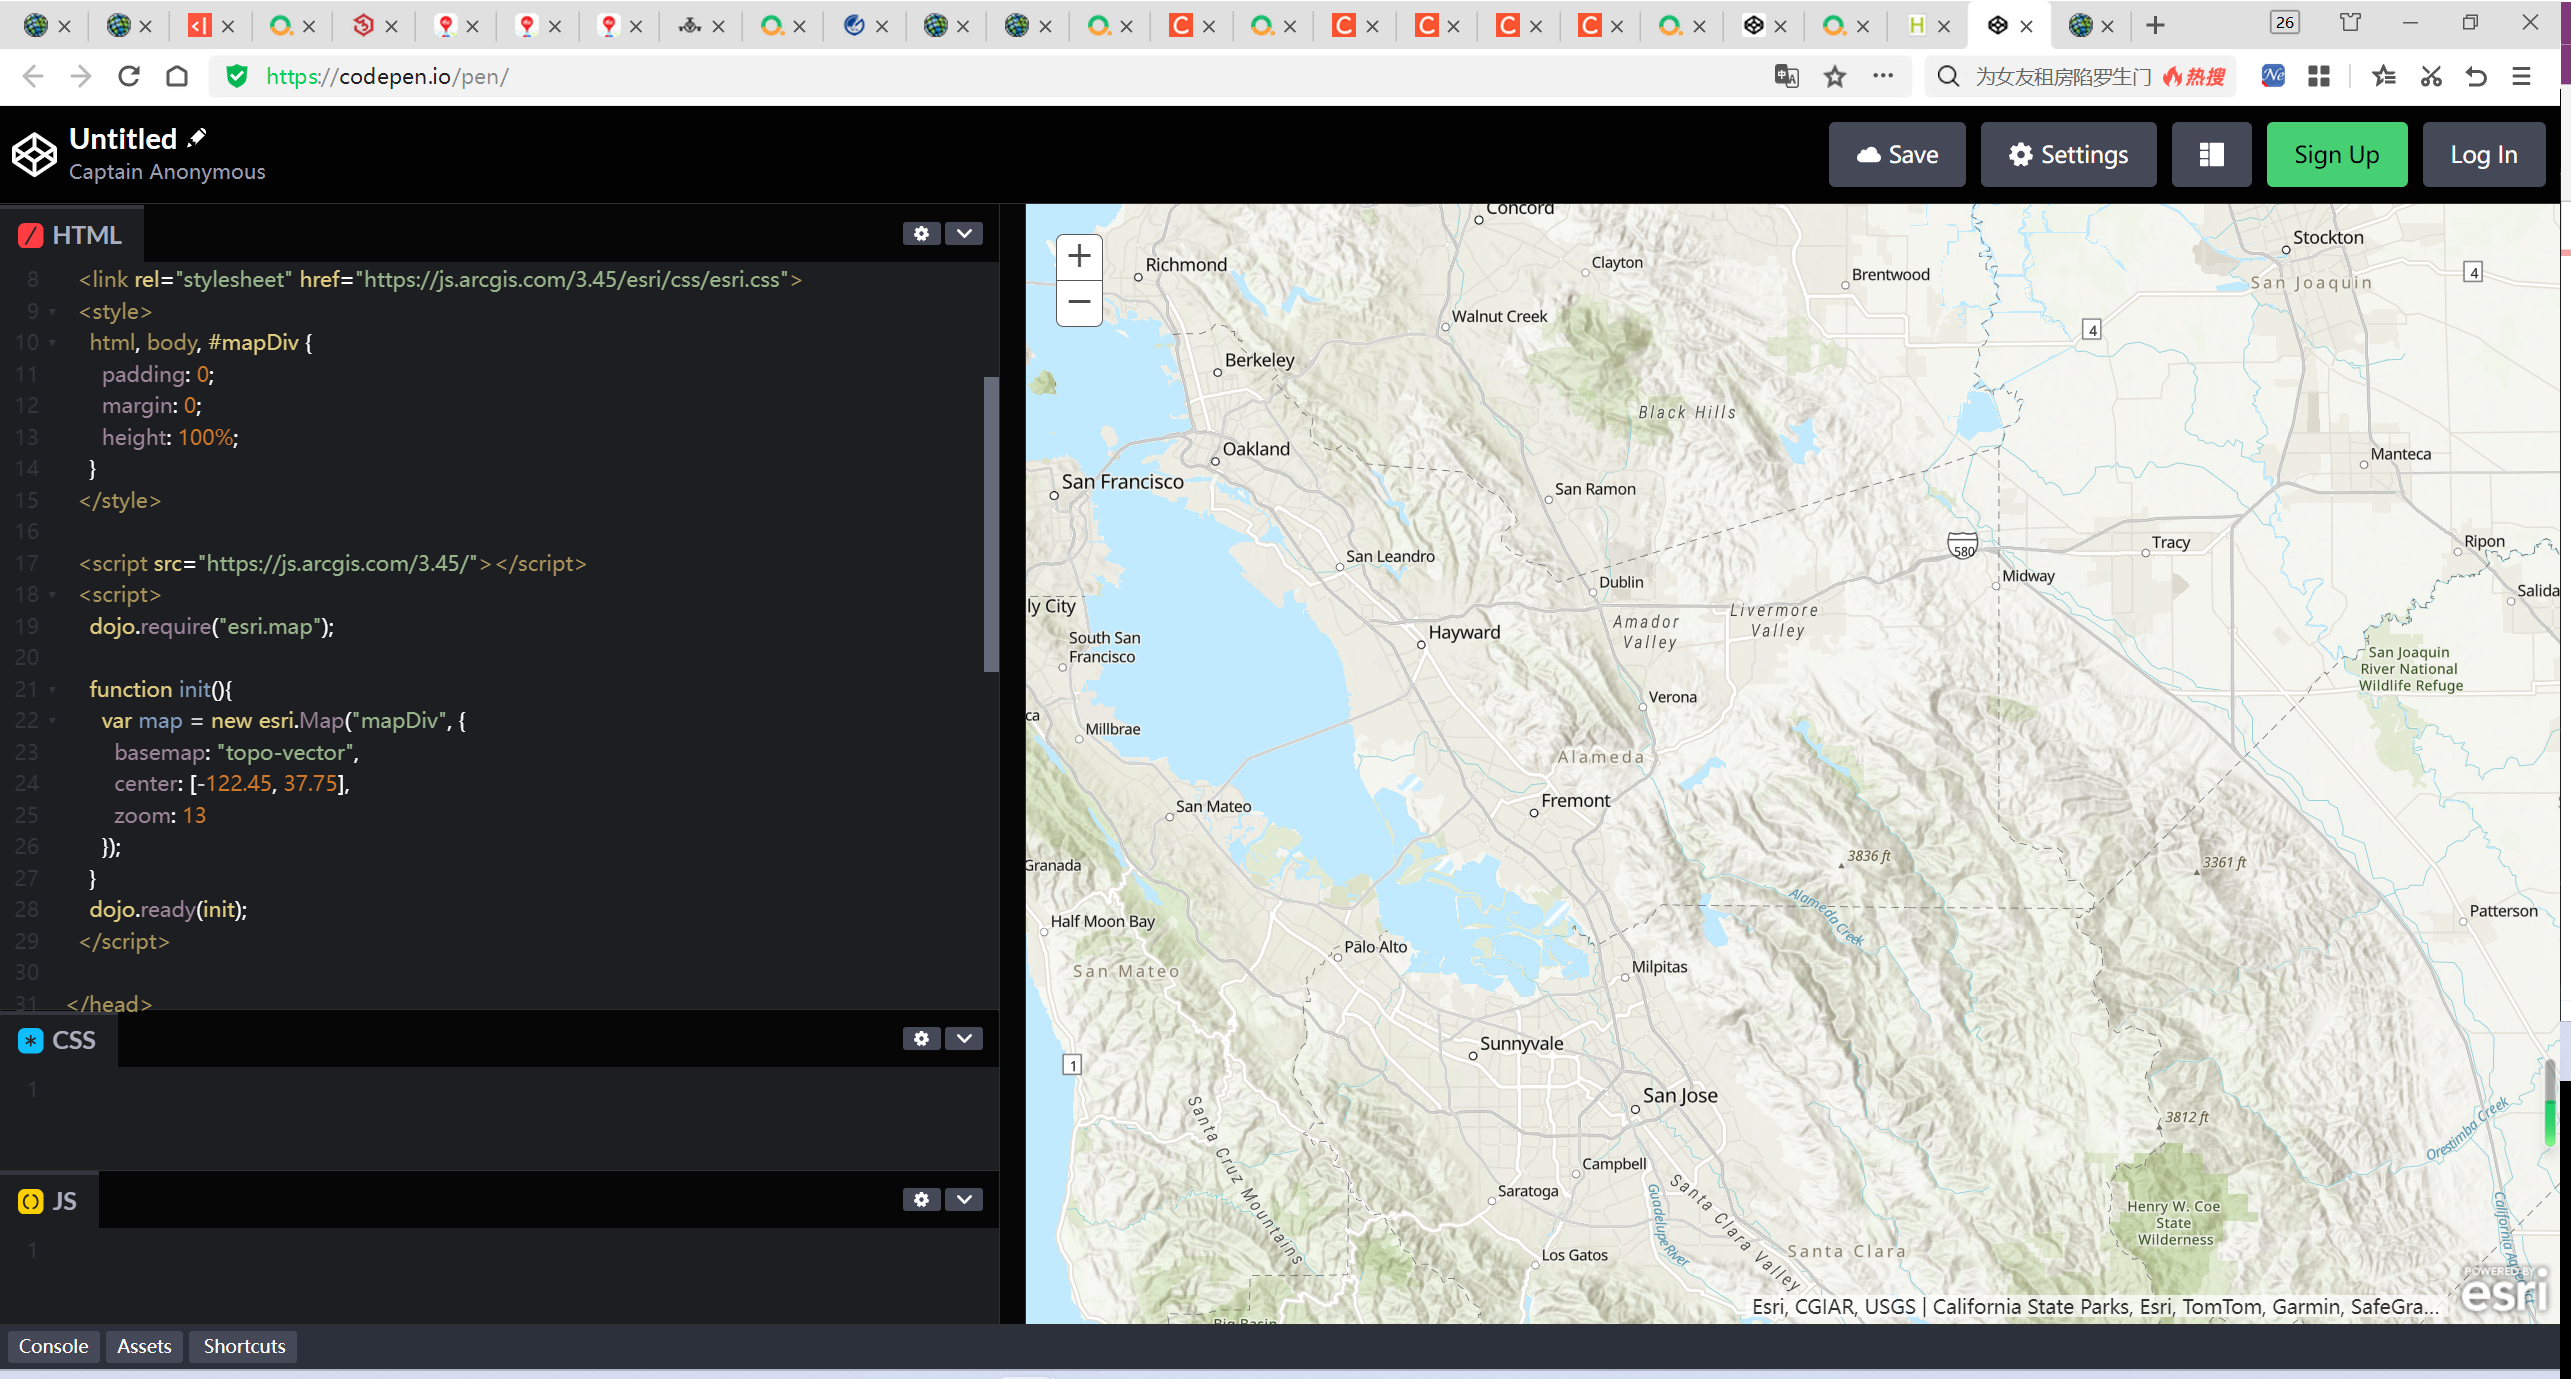
(2)代码笔
CodePen(代码笔)一款前端所见即所得的工具,我们可以在线编辑制作前端页面,所见即所得。同时网站提供所有常见的 js、css 库,并且支持流行技术(如 SASS),免去了我们自建平台的麻烦。编辑器网址: https://codepen.io/pen/
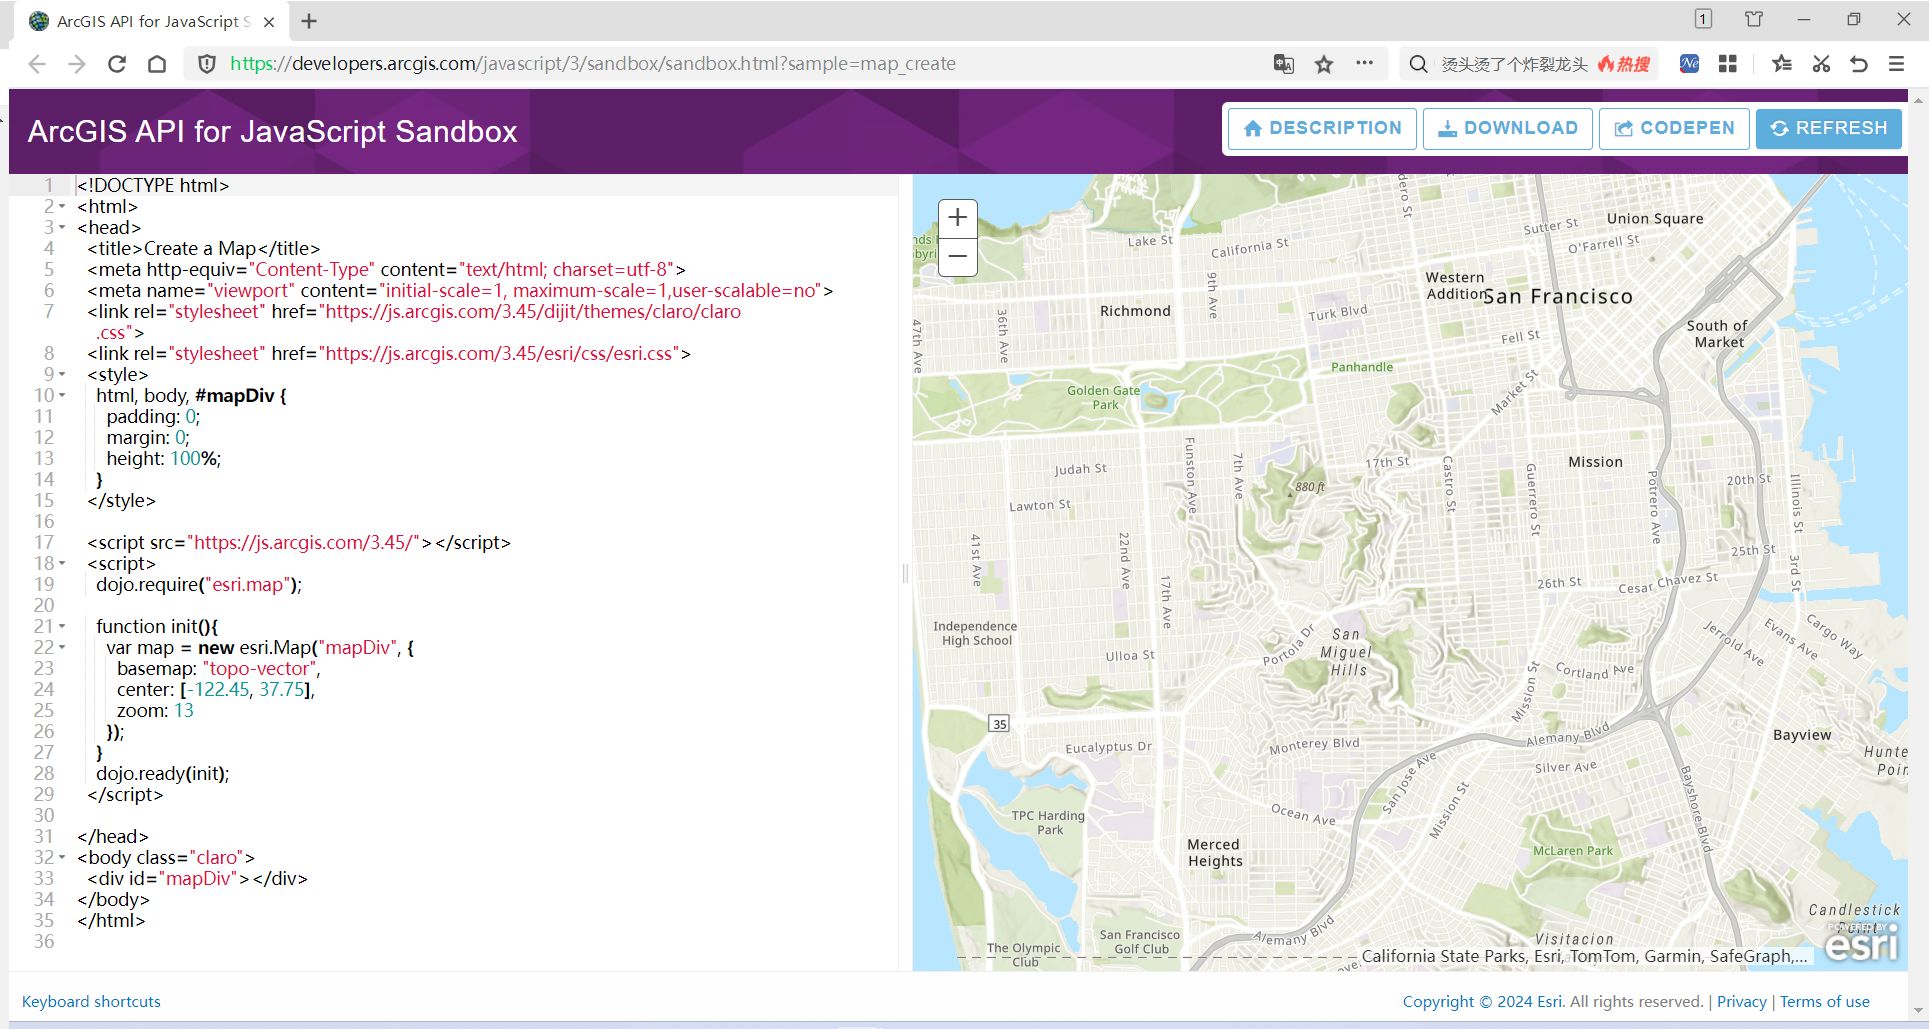
2.使用ArcgisForJs创建一个简单应用
创建任何GIS地图应用程序,都需要遵循一些步骤。假如想让地图成为应用程序的一部分,那么就需要按照这些步骤来执行。需要遵循以下步骤:①创建页面HTML代码;②引用ArcGIS API for JavaScript和样式表;③加载模块;④确保DOM可用;⑤创建地图;⑥定义页面内容;⑦页面样式。
(1)主要代码
<!DOCTYPE html>
<html>
<head>  <title>Create a Map</title>  <meta http-equiv="Content-Type" content="text/html; charset=utf-8">  <meta name="viewport" content="initial-scale=1, maximum-scale=1,user-scalable=no">  <link rel="stylesheet" href="https://js.arcgis.com/3.45/dijit/themes/claro/claro.css">  <link rel="stylesheet" href="https://js.arcgis.com/3.45/esri/css/esri.css">  <style>  html, body, #mapDiv {  padding: 0;  margin: 0;  height: 100%;  }  </style>  <script src="https://js.arcgis.com/3.45/"></script>  <script>  dojo.require("esri.map");  function init(){  var map = new esri.Map("mapDiv", {  basemap: "topo-vector",  center: [-122.45, 37.75],  zoom: 13  });  }  dojo.ready(init);  </script>  </head>
<body class="claro">  <div id="mapDiv"></div>
</body>
</html>
(2)结果显示
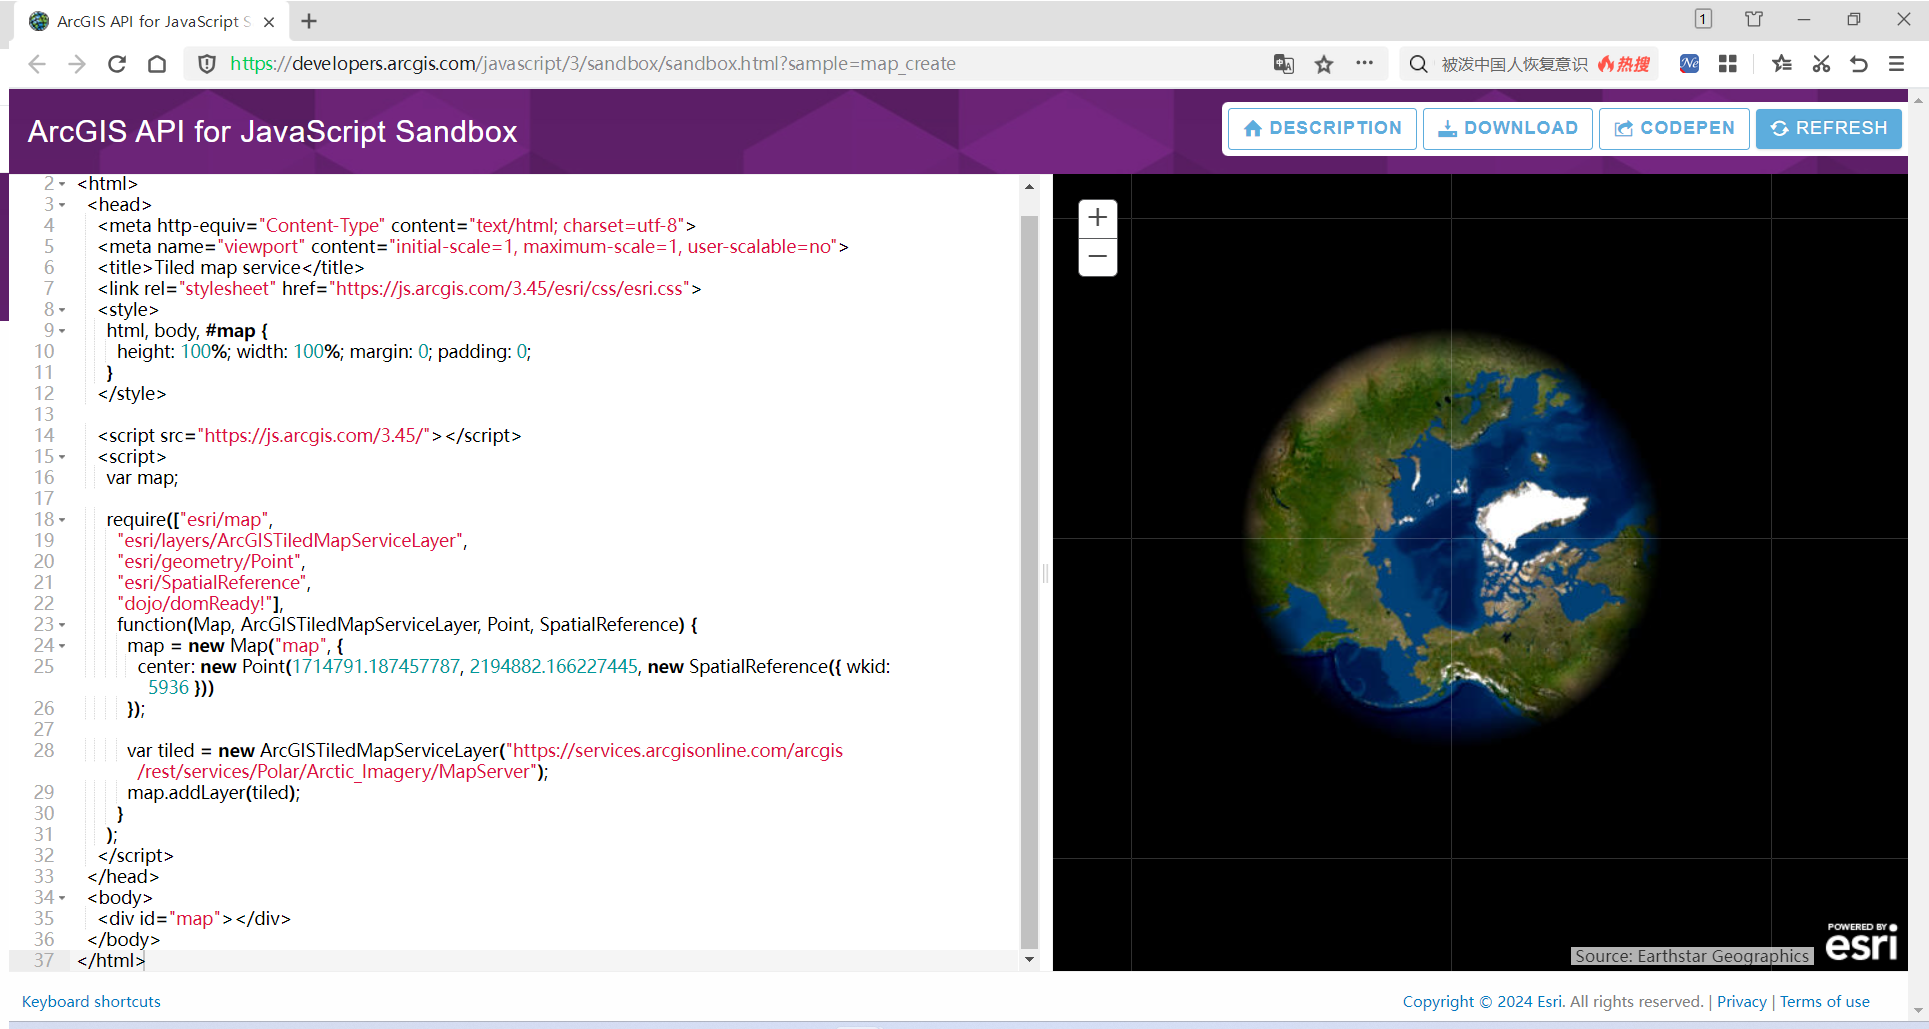
3.切片地图服务图层
ArcGISTiledMapServiceLayer类使用在当引用ArcGIS Server暴露的切片(缓存)地图服务时。这种类型的对象使用已经缓存过的切片地图集合,所以性能得以改善。
(1)主要代码
<!DOCTYPE html>
<html>  <head>  <meta http-equiv="Content-Type" content="text/html; charset=utf-8">  <meta name="viewport" content="initial-scale=1, maximum-scale=1, user-scalable=no">  <title>Tiled map service</title>  <link rel="stylesheet" href="https://js.arcgis.com/3.45/esri/css/esri.css">  <style>  html, body, #map {  height: 100%; width: 100%; margin: 0; padding: 0;  }  </style>  <script src="https://js.arcgis.com/3.45/"></script>  <script>  var map;  require(["esri/map",  "esri/layers/ArcGISTiledMapServiceLayer",  "esri/geometry/Point",  "esri/SpatialReference",  "dojo/domReady!"],  function(Map, ArcGISTiledMapServiceLayer, Point, SpatialReference) {  map = new Map("map", {  center: new Point(1714791.187457787, 2194882.166227445, new SpatialReference({ wkid: 5936 }))  });  var tiled = new ArcGISTiledMapServiceLayer("https://services.arcgisonline.com/arcgis/rest/services/Polar/Arctic_Imagery/MapServer");  map.addLayer(tiled);  }  );  </script>  </head>  <body>  <div id="map"></div>  </body>
</html>
(2)结果显示
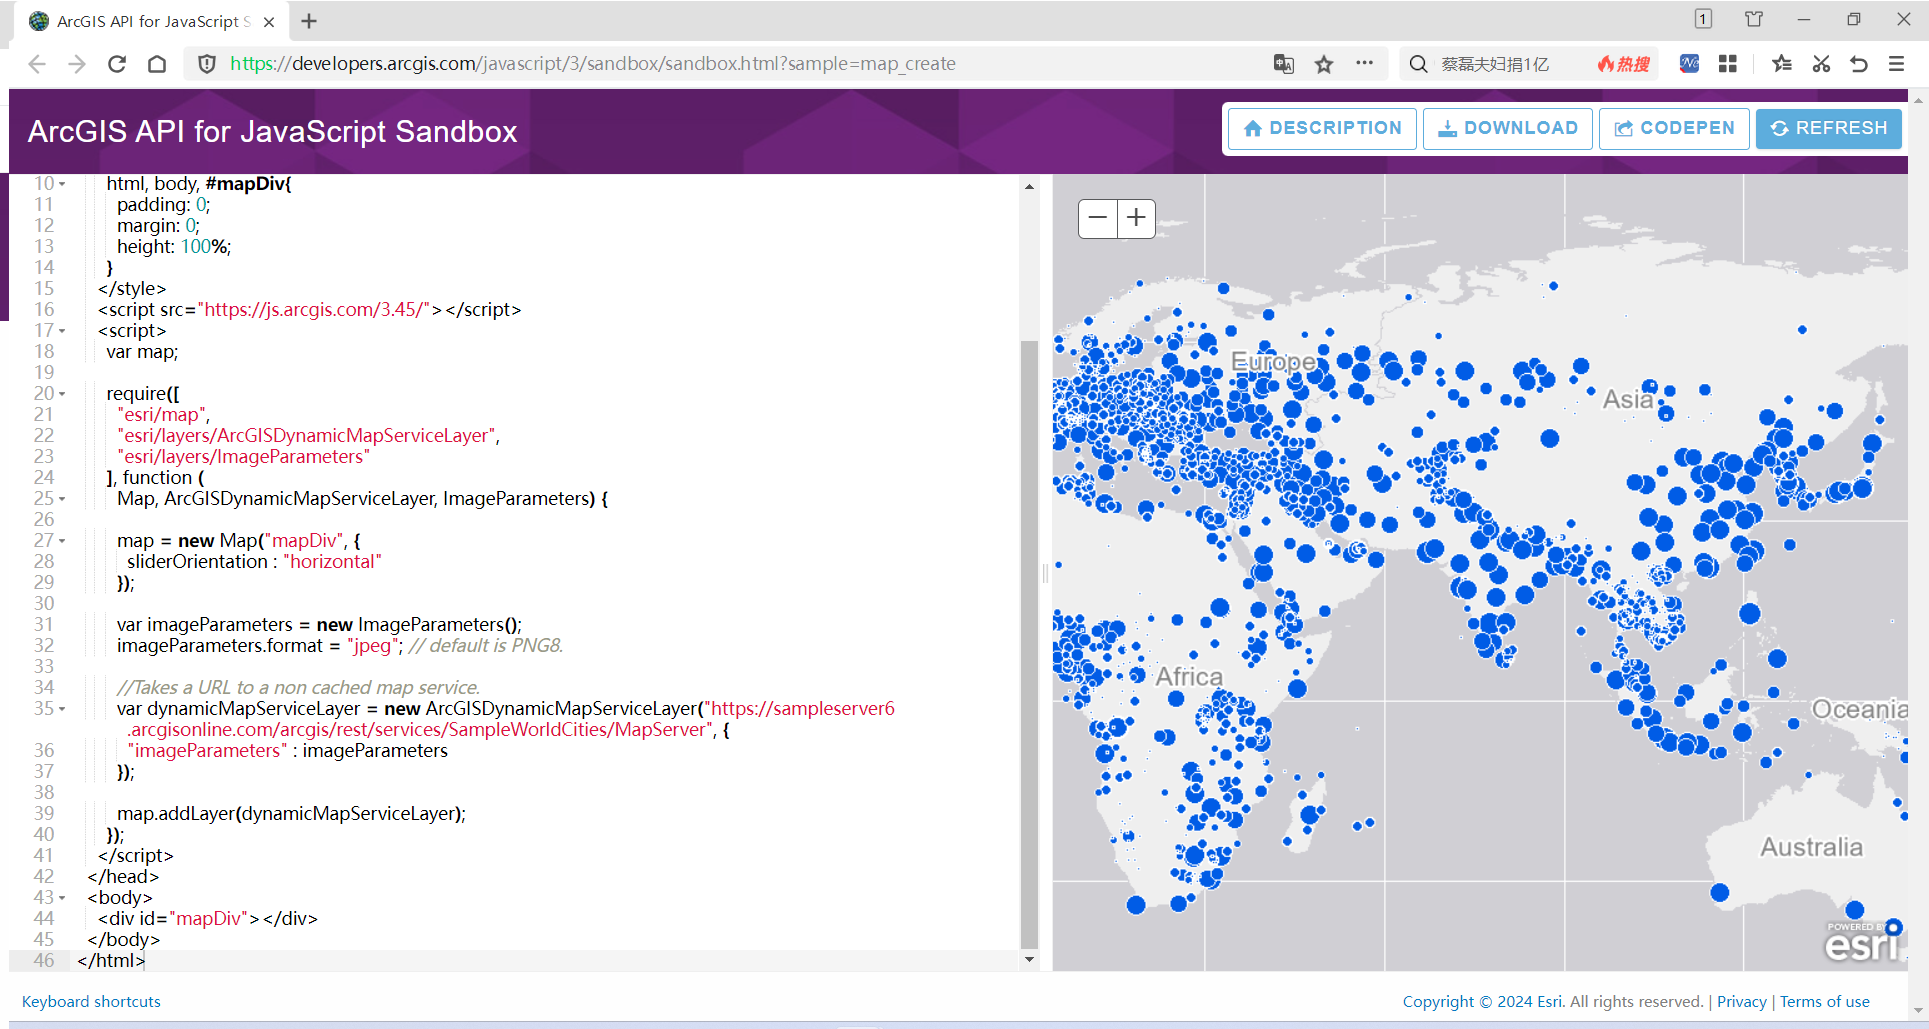
4.动态地图服务图层
ArcGISDynamicMapService类用来动态创建ArcGIS Server地图服务。
(1)主要代码
<!DOCTYPE html>
<html>  <head>  <meta http-equiv="Content-Type" content="text/html; charset=utf-8">  <meta name="viewport" content="initial-scale=1, maximum-scale=1,user-scalable=no">  <title>Create Map and add a dynamic layer</title>  <link rel="stylesheet" href="https://js.arcgis.com/3.45/esri/css/esri.css"/>  <style>  html, body, #mapDiv{  padding: 0;  margin: 0;  height: 100%;  }  </style>  <script src="https://js.arcgis.com/3.45/"></script>  <script>  var map;  require([  "esri/map",  "esri/layers/ArcGISDynamicMapServiceLayer",  "esri/layers/ImageParameters"  ], function (  Map, ArcGISDynamicMapServiceLayer, ImageParameters) {  map = new Map("mapDiv", {  sliderOrientation : "horizontal"  });  var imageParameters = new ImageParameters();  imageParameters.format = "jpeg"; // default is PNG8.  //Takes a URL to a non cached map service.  var dynamicMapServiceLayer = new ArcGISDynamicMapServiceLayer("https://sampleserver6.arcgisonline.com/arcgis/rest/services/SampleWorldCities/MapServer", {  "imageParameters" : imageParameters  });  map.addLayer(dynamicMapServiceLayer);  });  </script>  </head>  <body>  <div id="mapDiv"></div>  </body>
</html>
(2)结果显示
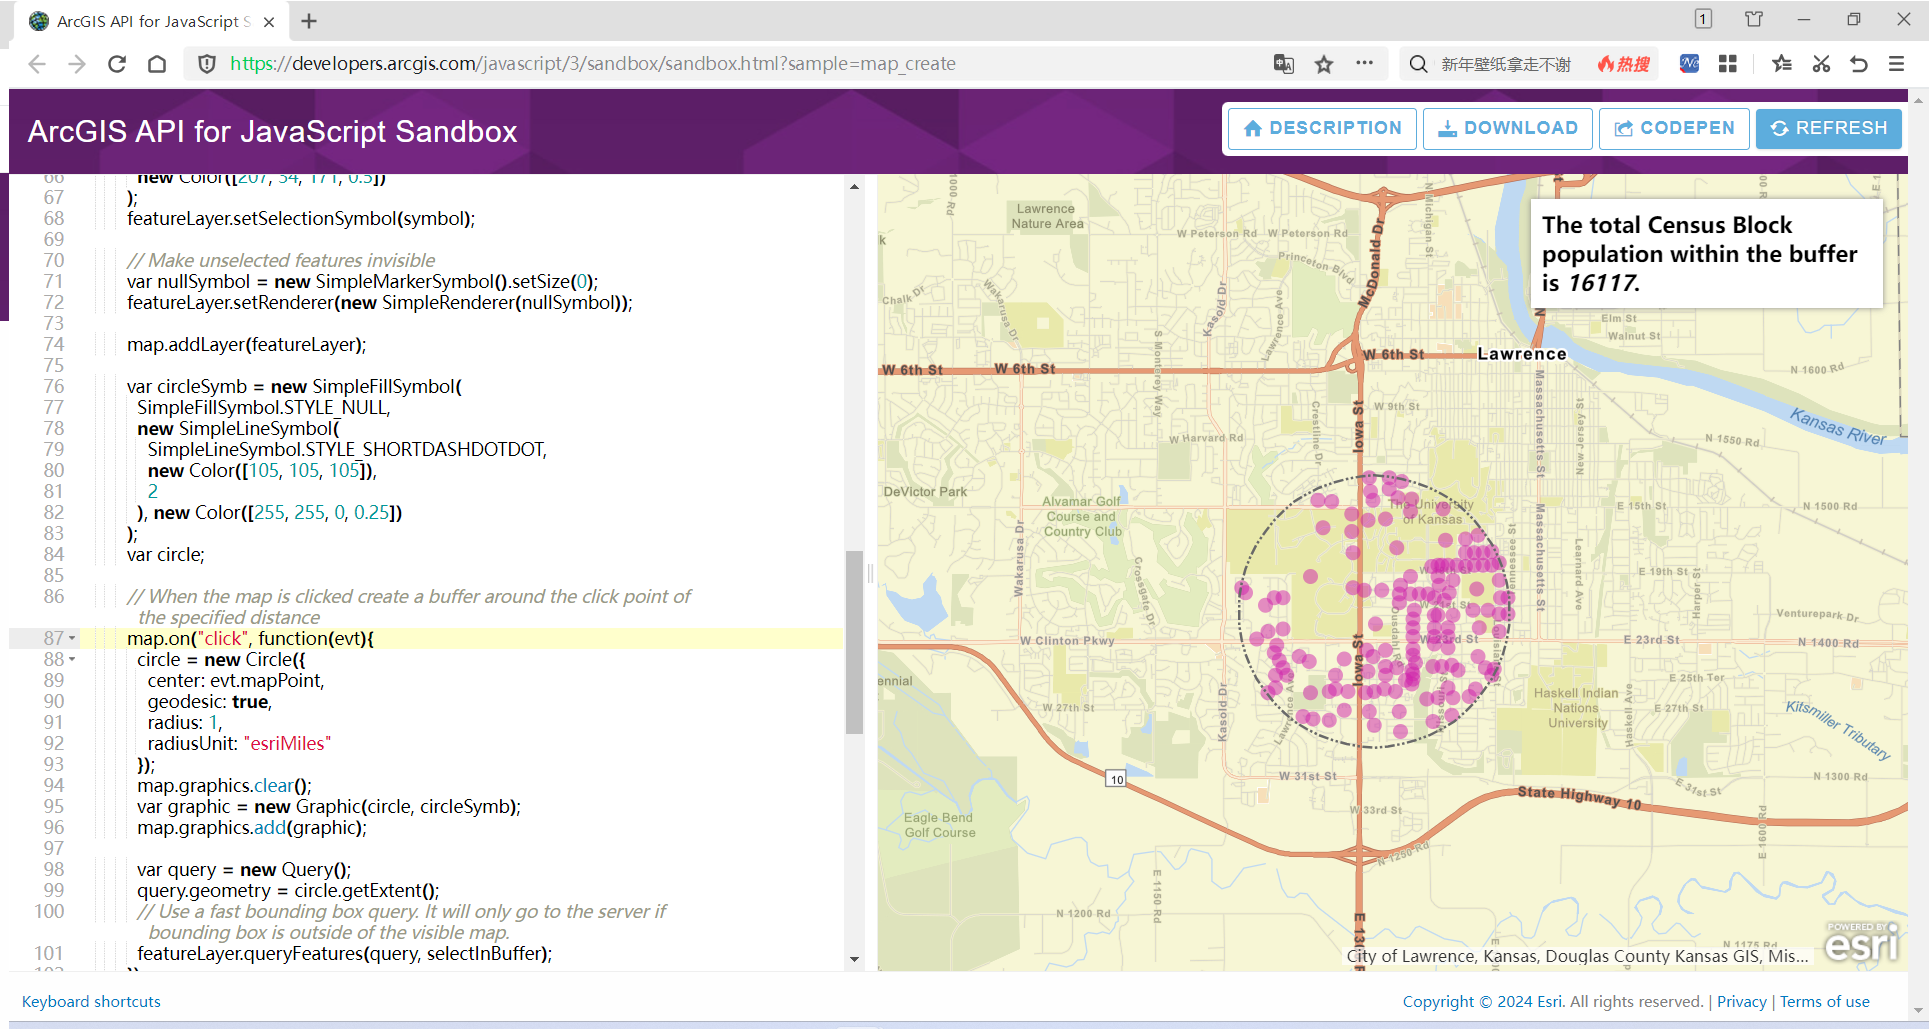
5.地图事件
在编程世界里,事件是发生在应用程序中的动作。通常,这些事件通过终端用户触发,包括鼠标单击、鼠标拖拽和键盘动作,但是它还包括数据的发送和接收、组件修改和其他操作。
(1)主要代码
<!DOCTYPE html>
<html>  <head>  <meta http-equiv="Content-Type" content="text/html; charset=utf-8">  <meta name="viewport" content="initial-scale=1, maximum-scale=1,user-scalable=no">  <title>Select with feature layer</title>  <link rel="stylesheet" href="https://js.arcgis.com/3.45/dijit/themes/tundra/tundra.css">  <link rel="stylesheet" href="https://js.arcgis.com/3.45/esri/css/esri.css">  <style>  html, body, #mapDiv {  padding: 0;  margin: 0;  height: 100%;  }  #messages{  background-color: #fff;  box-shadow: 0 0 5px #888;  font-size: 1.1em;  max-width: 15em;  padding: 0.5em;  position: absolute;  right: 20px;  top: 20px;  z-index: 40;  }  </style>  <script src="https://js.arcgis.com/3.45/"></script>  <script>  var map;  require([  "esri/map", "esri/layers/FeatureLayer",  "esri/tasks/query", "esri/geometry/Circle",  "esri/graphic", "esri/symbols/SimpleMarkerSymbol",  "esri/symbols/SimpleLineSymbol", "esri/symbols/SimpleFillSymbol", "esri/renderers/SimpleRenderer",  "esri/config", "esri/Color", "dojo/dom", "dojo/domReady!"  ], function(  Map, FeatureLayer,  Query, Circle,  Graphic, SimpleMarkerSymbol,  SimpleLineSymbol, SimpleFillSymbol, SimpleRenderer,  esriConfig, Color, dom  ) {  map = new Map("mapDiv", {  basemap: "streets-vector",  center: [-95.249, 38.954],  zoom: 14,  slider: false  });  // Add the census block points in on demand mode. An outfield is specified since it is used when calculating   the total population falling within the one mile radius.  var featureLayer = new FeatureLayer("https://sampleserver6.arcgisonline.com/arcgis/rest/services/Census/MapServer/0",{  outFields: ["POP2000"]  });  // Selection symbol used to draw the selected census block points within the buffer polygon  var symbol = new SimpleMarkerSymbol(  SimpleMarkerSymbol.STYLE_CIRCLE,  12,  new SimpleLineSymbol(  SimpleLineSymbol.STYLE_NULL,  new Color([247, 34, 101, 0.9]),  1  ),  new Color([207, 34, 171, 0.5])  );  featureLayer.setSelectionSymbol(symbol);  // Make unselected features invisible  var nullSymbol = new SimpleMarkerSymbol().setSize(0);  featureLayer.setRenderer(new SimpleRenderer(nullSymbol));  map.addLayer(featureLayer);  var circleSymb = new SimpleFillSymbol(  SimpleFillSymbol.STYLE_NULL,  new SimpleLineSymbol(  SimpleLineSymbol.STYLE_SHORTDASHDOTDOT,  new Color([105, 105, 105]),  2  ), new Color([255, 255, 0, 0.25])  );  var circle;  // When the map is clicked create a buffer around the click point of the specified distance  map.on("click", function(evt){  circle = new Circle({  center: evt.mapPoint,  geodesic: true,  radius: 1,  radiusUnit: "esriMiles"  });  map.graphics.clear();  var graphic = new Graphic(circle, circleSymb);  map.graphics.add(graphic);  var query = new Query();  query.geometry = circle.getExtent();  // Use a fast bounding box query. It will only go to the server if bounding box is outside of the visible map.  featureLayer.queryFeatures(query, selectInBuffer);  });  function selectInBuffer(response){  var feature;  var features = response.features;  var inBuffer = [];  // Filter out features that are not actually in buffer, since we got all points in the buffer's bounding box  for (var i = 0; i < features.length; i++) {  feature = features[i];  if(circle.contains(feature.geometry)){  inBuffer.push(feature.attributes[featureLayer.objectIdField]);  }  }  var query = new Query();  query.objectIds = inBuffer;  // Use an objectIds selection query (should not need to go to the server)  featureLayer.selectFeatures(query, FeatureLayer.SELECTION_NEW, function(results){  var totalPopulation = sumPopulation(results);  var r = "";  r = "<b>The total Census Block population within the buffer is <i>" + totalPopulation + "</i>.</b>";  dom.byId("messages").innerHTML = r;  });  }  function sumPopulation(features) {  var popTotal = 0;  for (var x = 0; x < features.length; x++) {  popTotal = popTotal + features[x].attributes["POP2000"];  }  return popTotal;  }  });  </script>  </head>  <body>  <span id="messages">Click on the map to select census block points within 1 mile.</span>  <div id="mapDiv"></div>  </body>
</html>
(2)结果显示
参考资料:
[1] 派普勒[著]张大伟[译]. 《JavaScript构建Web和ArcGIS Server应用实战》; 2015-12-01 [accessed 2024-01-28].
[2] hangge. CodePen - 一个在线的前端代码编辑工具(可用于制作测试页面、代码调试); 2019-12-02 [accessed 2024-01-28].
[3] . ArcGIS Maps SDK for JavaScript; [accessed 2024-01-28].
[4] . ArcGIS API for JavaScript (legacy) 3.45; [accessed 2024-01-28].
[5] 祥哥哥咩~. arcgis for js图层graphic的鼠标悬浮事件; 2019-04-26 [accessed 2024-01-28].