WPF Live Charts2 自学笔记
文章目录
- 前言
- 实现效果
- 微软平台的历史问题
- WPF 项目搭建
- Nuget添加
- 额外框架添加
- 项目初始化
- livecharts配置
- 其它LiveCharts2 案例
- 简单案例Demo示例
- View
- ViewModel
- GPU渲染
- Github地址仓库
前言
LiveChart 是C# 上面很受欢迎的统计图 UI控件。最近在学WPF+halcon开发,想想还是把LiveCharts 也顺便学一下
LiveCharts2 官网
LiveCharts2 WPF 平台官方文档
Gitee仓库地址 gclove2000 / WPF_LiveCharts2
实现效果
微软平台的历史问题
微软推出这么多UI框架干嘛。我希望MAUI在5年内不变。先把跨平台的问题解决好。
WPF 项目搭建
Nuget添加
注意:Livecharts2 目前是预览版,所以需要在搜索的时候添加预览版选项
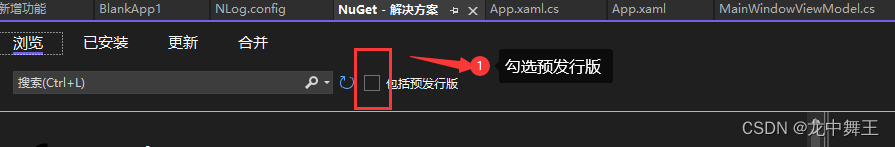
LiveChartsCore.SkiaSharpView.WPF

额外框架添加
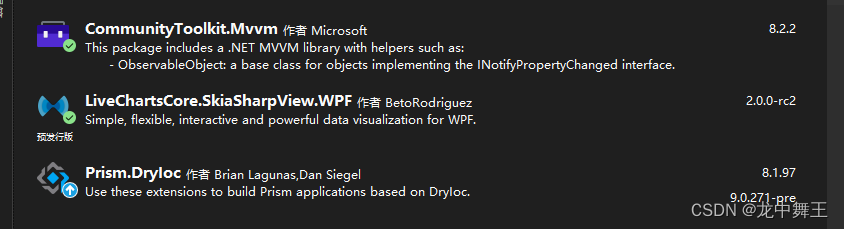
WPF Prims框架详解
WPF CommunityToolkit.Mvvm
项目初始化
按照案例运行完美成功!
ViewModel属性添加
using LiveChartsCore;
using LiveChartsCore.SkiaSharpView;namespace WpfSample
{public class ViewModel{public ISeries[] Series { get; set; } = new ISeries[]{new LineSeries<double>{Values = new double[] { 2, 1, 3, 5, 3, 4, 6 },Fill = null}};}
}
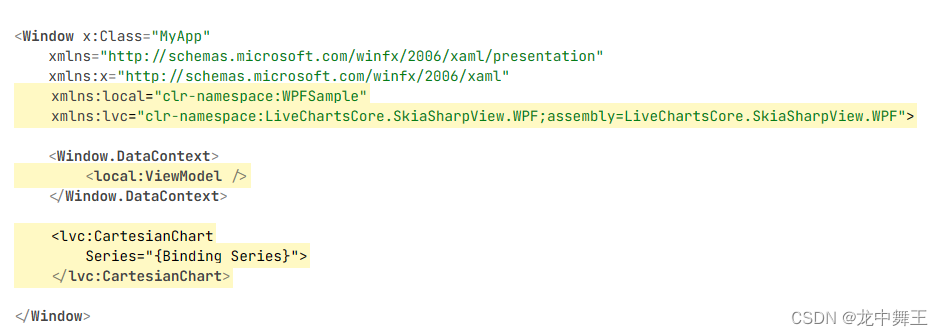
xml添加
<Window x:Class="MyApp"xmlns="http://schemas.microsoft.com/winfx/2006/xaml/presentation"xmlns:x="http://schemas.microsoft.com/winfx/2006/xaml" xmlns:local="clr-namespace:WPFSample"xmlns:lvc="clr-namespace:LiveChartsCore.SkiaSharpView.WPF;assembly=LiveChartsCore.SkiaSharpView.WPF"><Window.DataContext><local:ViewModel /></Window.DataContext><lvc:CartesianChartSeries="{Binding Series}"></lvc:CartesianChart></Window>
运行效果
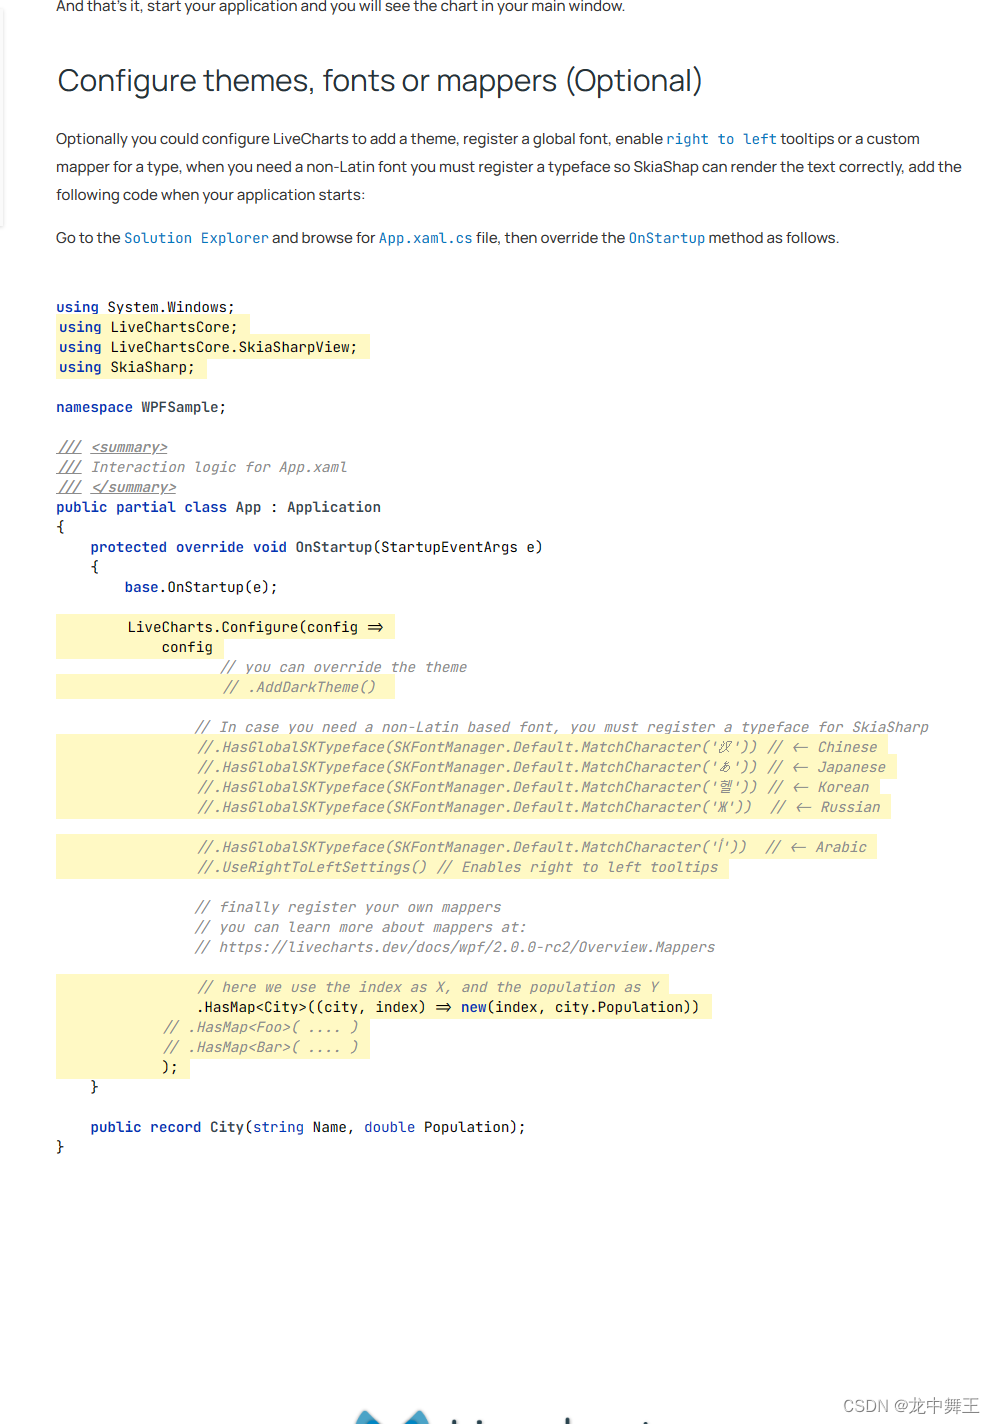
livecharts配置
看不懂,暂时不用
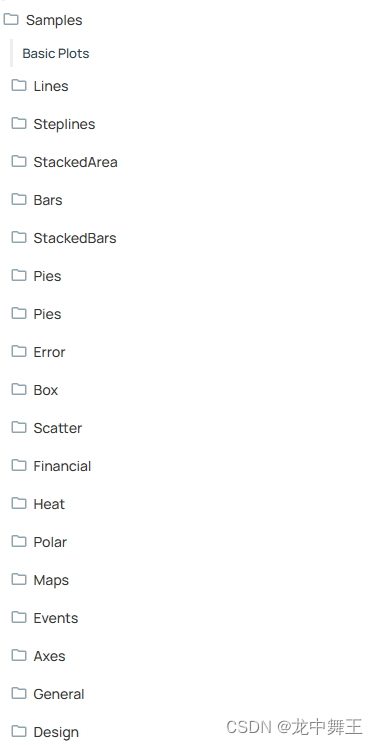
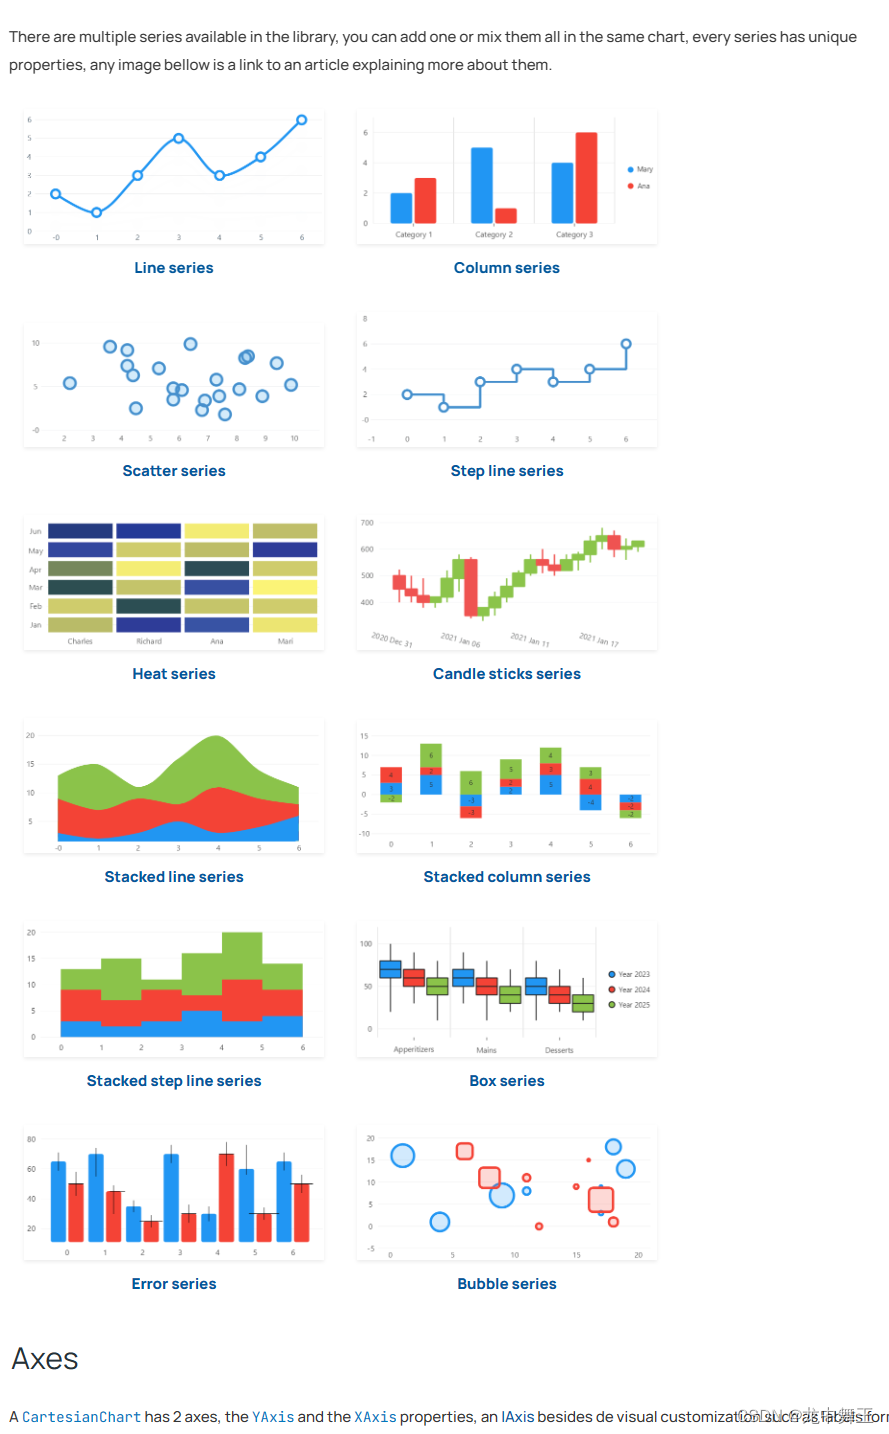
其它LiveCharts2 案例
我们可以在LiveCharts2的Example里面选择案例
常用的:条形图,柱状图,雷达塔,世界地图等都有,而且都有对应的动态动画
简单案例Demo示例
View
<UserControl x:Class="BlankApp1.Views.AView"xmlns="http://schemas.microsoft.com/winfx/2006/xaml/presentation"xmlns:x="http://schemas.microsoft.com/winfx/2006/xaml"xmlns:mc="http://schemas.openxmlformats.org/markup-compatibility/2006"xmlns:d="http://schemas.microsoft.com/expression/blend/2008"xmlns:local="clr-namespace:BlankApp1.Views"xmlns:ViewModel="clr-namespace:BlankApp1.ViewModels"xmlns:lvc="clr-namespace:LiveChartsCore.SkiaSharpView.WPF;assembly=LiveChartsCore.SkiaSharpView.WPF"mc:Ignorable="d"d:DesignHeight="450"d:DesignWidth="800"><UserControl.DataContext><ViewModel:AViewModel /></UserControl.DataContext><Grid><Grid.RowDefinitions><RowDefinition /><RowDefinition /></Grid.RowDefinitions><Grid.ColumnDefinitions><ColumnDefinition /><ColumnDefinition /></Grid.ColumnDefinitions><lvc:CartesianChart Series="{Binding Series}"Grid.Row="0"Grid.Column="0" /><lvc:CartesianChart Series="{Binding Series2}"Grid.Row="0"Grid.Column="1"YAxes="{Binding YAxes2}" /><lvc:PieChart Series="{Binding Series3}"Grid.Row="1"Grid.Column="0"Title="{Binding Title3}"></lvc:PieChart><lvc:PieChart Grid.Row="1"Grid.Column="1"Series="{Binding Series4}" /></Grid>
</UserControl>
ViewModel
using CommunityToolkit.Mvvm.ComponentModel;
using LiveChartsCore.SkiaSharpView;
using LiveChartsCore;
using Prism.Mvvm;
using System;
using System.Collections.Generic;
using System.Linq;
using System.Text;
using System.Threading.Tasks;
using LiveChartsCore.SkiaSharpView.Painting;
using SkiaSharp;
using System.Windows.Ink;
using LiveChartsCore.SkiaSharpView.Extensions;
using LiveChartsCore.SkiaSharpView.VisualElements;namespace BlankApp1.ViewModels
{partial class AViewModel : ObservableObject{public AViewModel() {var outer = 0;var data = new[] { 6, 5, 4, 3, 2 };// you can convert any array, list or IEnumerable<T> to a pie series collection:Series4 = data.AsPieSeries((value, series) =>{// this method is called once per element in the array// we are decrementing the outer radius 50px// on every element in the array.series.InnerRadius = 50;series.OuterRadiusOffset = outer;outer += 50;});}[ObservableProperty]private string title = "ViewA";public ISeries[] Series { get; set; }= new ISeries[]{new LineSeries<double>{Values = new double[] { 2, 1, 3, 5, 3, 4, 6 },Fill = null}};public ISeries[] Series2 { get; set; } ={new ColumnSeries<double>{IsHoverable = false, // disables the series from the tooltips Values = new double[] { 10, 10, 10, 10, 10, 10, 10 },Stroke = null,Fill = new SolidColorPaint(new SKColor(30, 30, 30, 30)),IgnoresBarPosition = true},new ColumnSeries<double>{Values = new double[] { 3, 10, 5, 3, 7, 3, 8 },Stroke = null,Fill = new SolidColorPaint(SKColors.CornflowerBlue),IgnoresBarPosition = true}};public Axis[] YAxes2 { get; set; } ={new Axis { MinLimit = 0, MaxLimit = 10 }};public IEnumerable<ISeries> Series3 { get; set; } =new[] { 2, 4, 1, 4, 3 }.AsPieSeries();public LabelVisual Title3 { get; set; } =new LabelVisual{Text = "My chart title",TextSize = 25,Padding = new LiveChartsCore.Drawing.Padding(15),Paint = new SolidColorPaint(SKColors.DarkSlateGray)};public IEnumerable<ISeries> Series4 { get; set; }}
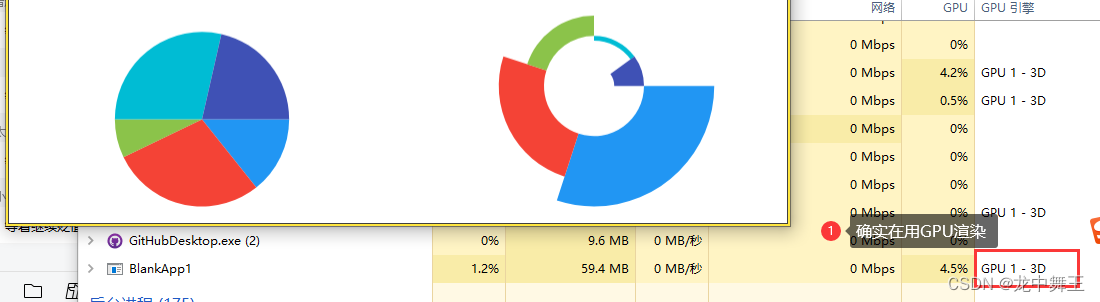
}GPU渲染
我听说LiveCharts2是用GPU渲染的,发现好像是真的
Github地址仓库
Gitee仓库地址 gclove2000 / WPF_LiveCharts2