echarts图表 实现高度按照 内容撑起来或者超出部分滚动展示效果
背景:因为数据不固定 高度写死导致数据显示不全,所以图表高度要根据内容计算
实现代码如下:
<divv-if="showCharts"id="business-bars"class="chart":style="{ height: chartHeight + 'px' }"></div>``````data() {return {chartHeight: 0,deptData: {},yAxisData: [], // 用于y轴的数据.......//其它数据}}``````watch: {yAxisData(newData) {this.chartHeight = newData.length * 30 + 20;this.$nextTick(() => {this.drawChart();const chart = echarts.init(document.getElementById("business-bars"));chart.resize()});},},
 mounted() {this.init(); // 初始化图表数据this.$nextTick(() => {//this.drawChart(); // 绘制图表});
},
思路:通过监听’yAxisData’的变化,来动态地计算和调整图表的整体高度
重点:1、在 Watch 属性的回调函数内调用了 drawChart() 方法,确保图表的高度在动态计算后被正确应用,
在 Watch 属性中通过 this.$nextTick() 来调用 drawChart() 方法,以确保在图表高度更新后再进行绘制操作
watch: {yAxisData(newData) {this.chartHeight = newData.length * 17 + 20;this.$nextTick(() => {this.drawChart();const chart = echarts.init(document.getElementById("business-bars"));chart.resize()});}
},
2、在 drawChart() 方法中,确保在绘制图表之前,已经将图表容器的实际高度设置为计算后的高度
methods: {drawChart() {const chart = echarts.init(document.getElementById("business-bars"));const chartContainer = document.getElementById("business-bars");chartContainer.style.height = this.chartHeight + "px";const option = {barWidth: 20,barGap: "30%", // 调整同一类目上的柱子间隔barCategoryGap: "20%", // 调整不同类目的柱子间隔// dataZoom: [ //   {//     type: 'slider',//     yAxisIndex: 0, // y轴索引//     startValue: 0, // 起始数据索引//     endValue: 5,  // 结束数据索引//     zoomLock: true // 禁用滑动条//   }// ],color: ["rgba(27, 158, 255, 1)","rgba(0, 210, 233, 1)","rgba(253, 200, 79, 1)",],tooltip: {trigger: "axis",axisPointer: {type: "shadow",},},legend: {bottom: 20,itemGap: 15,itemWidth: 10,itemHeight: 10,},grid: {left: "2%",right: "4%",top: "2%",containLabel: true,},xAxis: {type: "value",splitLine: {show: false,},},yAxis: {type: "category",data: this.yAxisData,axisLine: {show: false,},axisTick: {show: false,interval: 0,},axisLabel: {interval: 0,formatter: function (value) {if (value.length > 5) {return `${value.substr(0, 5)}...`;}return value;},},},series: this.seriesData,};const that = this;chart.off("click");chart.on("click", function (param) {const index = PROJECT_STATE_ENUM.findIndex((item) => item.name === param.seriesName);that.value = param.seriesName;that.dept = param.name;if (index > -1) {let time;if (that.current === "all") {time = 0;} else if (that.current === "week") {time = 1;} else if (that.current === "month") {time = 2;} else if (that.current === "year") {time = 3;}that.$emit("query", {value: PROJECT_STATE_ENUM[index].code,time: time,dept: param.name,});}});chart.setOption(option);// 自适应窗口大小window.addEventListener("resize", function () {chart.resize();});},
}
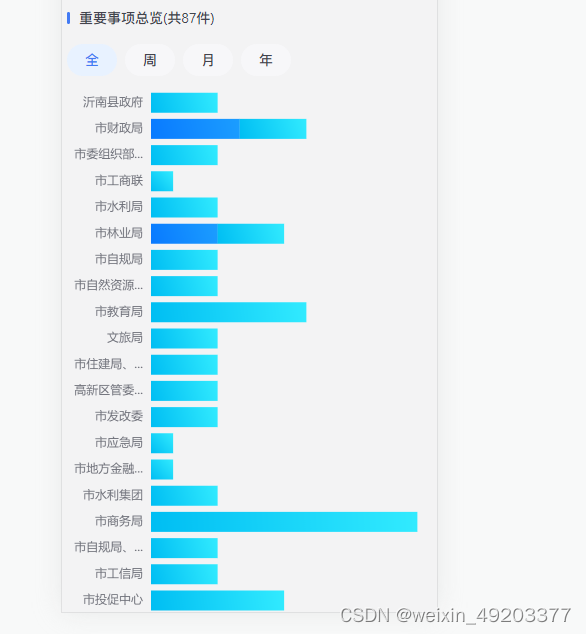
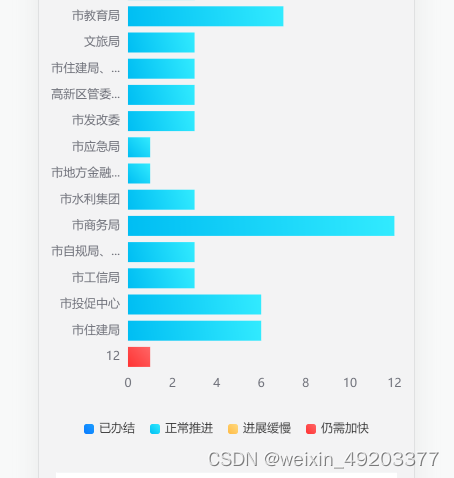
实现效果如下:按照内容高度 撑开全部展示
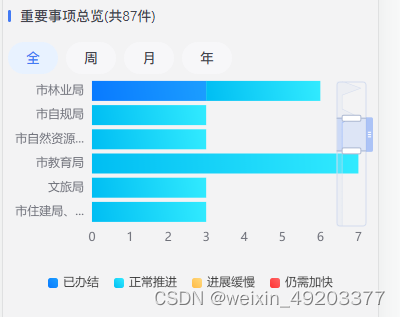
如果左侧高度想固定 超出部分右侧滚动条上下滚动的形式展示 则在echarts配置中添加datazoom属性
// dataZoom: [// {// type: 'slider',// yAxisIndex: 0, // y轴索引// startValue: 0, // 起始数据索引// endValue: 5, // 结束数据索引// zoomLock: true // 禁用滑动条// }// ],
展示效果如下: