ssm实现折线统计图
方法1:单张数据表中的数据图表生成
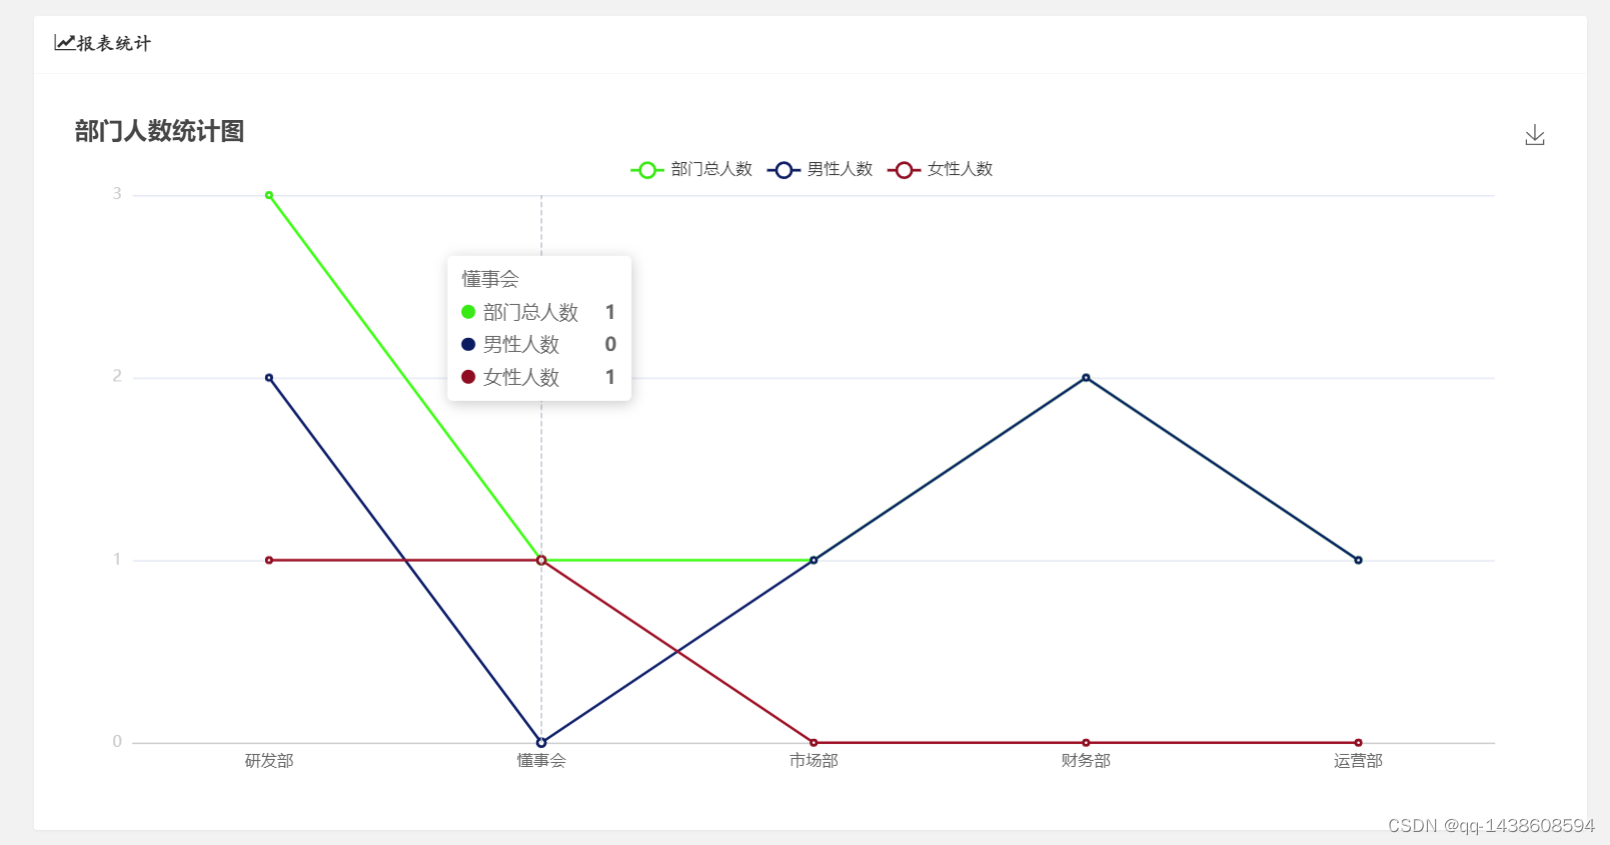
图表统计,查看部门人数统计这里实现的时单张表中的数据实现部门人数折线统计图展示。

<script type="text/javascript">// 利用AjAx来获取后台传入的数据(@Responsebody注解传入的)var deptName=[];var totalCount=[];var maleCount=[];var femaleCount=[];$.ajax({type: "get",async: false, //是否异步url:ctx+ "/admin/sortHit",contentType: "application/json;charset=UTF-8",dataType: "json", //跨域json请求一定是jsonsuccess: function (response) {for (var index = 0; index < response.length; index += 1) {deptName.push(response[index].deptName);totalCount.push(response[index].totalCount);maleCount.push(response[index].maleCount);femaleCount.push(response[index].femaleCount);}},error: function (response) {console.log("请求失败")}});//Echarts展示数据$(function () {{// 基于准备好的dom,初始化echarts图表var myChart = echarts.init(document.getElementById('main'));option = {title: {text: '部门人数统计图'},tooltip: {trigger: 'axis',axisPointer: {type: 'line',}},toolbox: {show: true,feature: {saveAsImage: {}}},legend: { // 添加线条标识说明data: ['总人数', '男性人数', '女性人数'],top: 30},grid: {left: '3%',right: '4%',bottom: '3%',containLabel: true},xAxis: [{type: 'category',// boundaryGap: false,data: deptName,axisLabel: {interval: 0,textStyle: {color: '#666'}},axisLine: {lineStyle: {color: '#ccc'}},axisTick: {show: false}}],yAxis: [{type: 'value',minInterval: 1,axisLine: {lineStyle: {color: '#ccc'}},axisTick: {lineStyle: {color: '#ccc'}}}],series: [{name: '总人数',type: 'line',itemStyle: {color: '#a9dffb'},data: totalCount},{name: '男性人数',type: 'line',itemStyle: {color: '#5fb7f9'},data: maleCount},{name: '女性人数',type: 'line',itemStyle: {color: '#289df5'},data: femaleCount}]};// 为echarts对象加载数据myChart.setOption(option);// echarts 窗口缩放自适应window.onresize = function () {echartsRecords.resize();}}})
</script>
这里是后端方法,这里只有mybatis和controller层的代码其他代码可自行生成。
// 后端SSM方法
@RequestMapping(value = "/admin/sortHit", method = RequestMethod.GET)
@ResponseBody
public List<Department> getDepartmentStatistics() {return departmentService.getDepartmentStatistics();
}// Department类
public class Department {private String deptName;private int totalCount;private int maleCount;private int femaleCount;// getters and setters
}// DepartmentMapper.xml
<select id="getDepartmentStatistics" resultType="Department">SELECT deptName, COUNT(*) AS totalCount,SUM(CASE WHEN gender = 'male' THEN 1 ELSE 0 END) AS maleCount,SUM(CASE WHEN gender = 'female' THEN 1 ELSE 0 END) AS femaleCountFROM departmentGROUP BY deptName
</select>
方法二:多张图表生成部门人数统计图,在图表中显示部门总人数,男性人数,女性人数。
前端页面代码
<html>
<head><meta http-equiv="Content-Type" content="text/html; charset=UTF-8"><link rel="stylesheet" href="${ctx }/css/font_eolqem241z66flxr.css"media="all" /><link rel="stylesheet" href="${ctx }/css/list.css" media="all" /><link rel="stylesheet" href="${ctx }/layui/css/layui.css" media="all" /><link rel="stylesheet" href="${ctx }/css/font-awesome-4.7.0/css/font-awesome.min.css" media="all"><link rel="stylesheet" href="${ctx }/css/public.css" media="all"><title>部门人员统计图</title><script>var ctx = "${ctx}";</script>
</head>
<body>
<div class="layui-container"><div class="layui-card"><div class="layui-card-header"><i class="fa fa-line-chart icon"></i>报表统计</div><div class="layui-card-body"><div id="main" style="height:500px;width: 1100px; margin-left: 30px ;margin: 20px auto;"></div></div></div>
</div>
</body>
<!-- 引入layui和echarts -->
<script type="text/javascript" src="${ctx }/layui/layui.js"></script>
<script type="text/javascript" src="${ctx }/js/jquery-1.9.1.min.js"></script>
<script type="text/javascript" src="${ctx }/js/Echarts/echarts.min.js"></script>
<script type="text/javascript">// 利用AjAx来获取后台传入的数据(@Responsebody注解传入的)var deptName=[];var totalCount=[];var maleCount=[];var femaleCount=[];$.ajax({type: "get",async: false, //是否异步url:ctx+ "/admin/sortHit",contentType: "application/json;charset=UTF-8",dataType: "json", //跨域json请求一定是jsonsuccess: function (response) {for (var index = 0; index < response.length; index += 1) {deptName.push(response[index].deptName);totalCount.push(response[index].totalCount);maleCount.push(response[index].maleCount);femaleCount.push(response[index].femaleCount);}},error: function (response) {console.log("请求失败")}});//Echarts展示数据$(function () {{// 基于准备好的dom,初始化echarts图表var myChart = echarts.init(document.getElementById('main'));option = {title: {text: '部门人数统计图'},tooltip: {trigger: 'axis',axisPointer: {type: 'line',}},toolbox: {show: true,feature: {saveAsImage: {}}},legend: { // 添加线条标识说明data: ['部门总人数', '男性人数', '女性人数'],top: 30},grid: {left: '3%',right: '4%',bottom: '3%',containLabel: true},xAxis: [{type: 'category',// boundaryGap: false,data: deptName,axisLabel: {interval: 0,textStyle: {color: '#666'}},axisLine: {lineStyle: {color: '#ccc'}},axisTick: {show: false}}],yAxis: [{type: 'value',minInterval: 1,axisLine: {lineStyle: {color: '#ccc'}},axisTick: {lineStyle: {color: '#ccc'}}}],series: [{name: '部门总人数',type: 'line',itemStyle: {color: '#38e913'},data: totalCount},{name: '男性人数',type: 'line',itemStyle: {color: '#0c1c61'},data: maleCount},{name: '女性人数',type: 'line',itemStyle: {color: '#8f0d21'},data: femaleCount}]};// 为echarts对象加载数据myChart.setOption(option);// echarts 窗口缩放自适应window.onresize = function () {echartsRecords.resize();}}})
</script>
</html>
后端代码
controller层@RequestMapping("/sortHit")@ResponseBodypublic List<Department> countByDept() {return adminService.countByDept();}service层List<Department> countByDept();@Overridepublic List<Department> countByDept() {return adminDao.countByDept();}dao层List<Department> countByDept();
mapper文件
<select id="countByDept" resultType="com.nucleic.acid.manager.entity.DeptEchart">/*方法1:查询部门人数并将总人数里面的男女性别分别显示*/SELECT d.deptName, COUNT(*) AS totalCount,SUM(CASE WHEN a.sex = '1' THEN 1 ELSE 0 END) AS maleCount,SUM(CASE WHEN a.sex = '0' THEN 1 ELSE 0 END) AS femaleCountFROM sys_admin a JOIN tb_department d ON a.dept_name = d.deptNameGROUP BY deptName/* -- 方式一根据部门名称和管理员所属部门名称进行统计人数SELECT d.deptName, COUNT(*) countFROM sys_admin a JOIN tb_department d ON a.dept_name = d.deptNameGROUP BY d.deptName*//* 方式二根据部门id进行生成统计图SELECT d.deptName, COUNT(*) countFROM sys_admin a JOIN tb_department d ON a.department_id = d.de_idGROUP BY d.deptName*/</select>
java类
private Integer id;private String deptName;private int count;private int totalCount;private int maleCount;private int femaleCount;