vue3+antv x6自定义节点样式
先大致定下节点样式,需要展示标题,输入/输出连接桩,
参考样子大概是
https://x6.antv.antgroup.com/examples/showcase/practices#class
这是根据antv x6配置 非自定义节点 图表案例
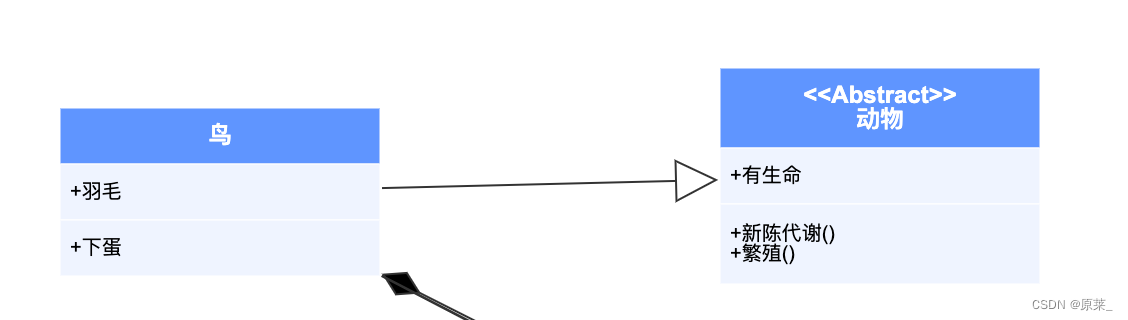
结果
数据格式大概是
nodes:[{title:'鸟',id:'node1',ports:[{title:'羽毛',id:'port-1'},{title:'羽毛',id:'port-1'}],
}]
接下来开始,新建index,ts存放画布配置等信息
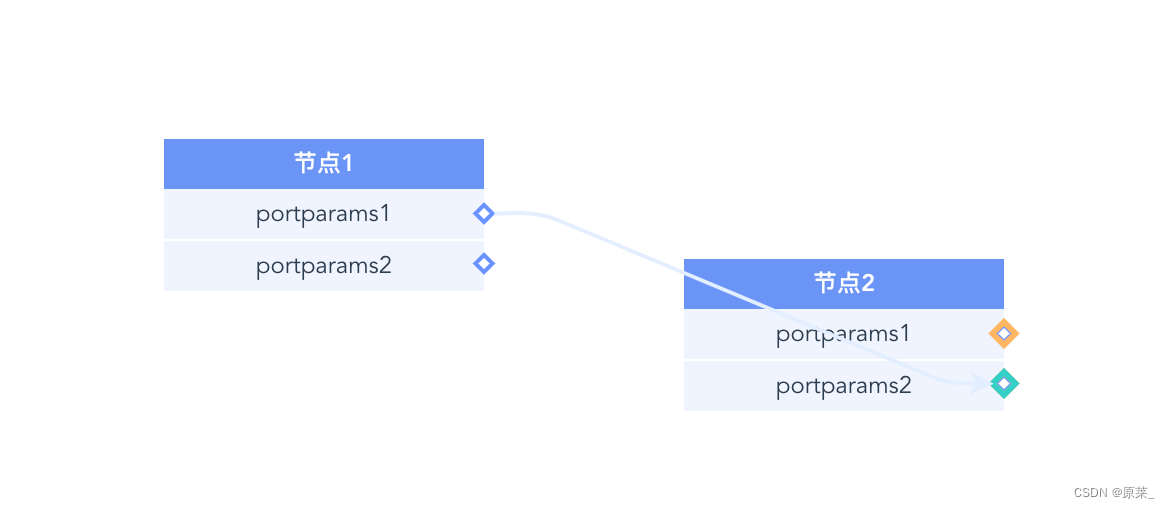
1、优化节点数据(index.js)
这个是画布节点关键信息,需要处理成graph需要的格式,下一步渲染到画布
// 画布节点数据
export const NODE_DATA = {nodes: [{id: 'node1', // String,可选,节点的唯一标识。。...nodeName: '节点1',x: 40,       // Number,必选,节点位置的 x 值y: 40,       // Number,必选,节点位置的 y 值。ports:[{id: 'port-1',name: 'portparams1',},{id: 'port-2',name: 'portparams2',},]},{id: 'node2', // String,可选,节点的唯一标识。。...nodeName: '节点2',x: 300,       // Number,必选,节点位置的 x 值y: 100,       // Number,必选,节点位置的 y 值。ports:[{id: 'port-1',name: 'portparams1',},{id: 'port-2',name: 'portparams2',},]},],edges: []
}
2、将节点信息渲染进画布 (index.vue)
增加的代码有注释标注,下一步处理格式
import {NODE_DATA,formatData } from "./index";//节点信息及处理节点格式方法放在index.js内,在下一个步骤const nodeData = reactive(NODE_DATA)
const refreshData = (data)=>{const cells: Cell[] = []data.nodes.forEach((item: any) => {cells.push(graph.createNode(formatData(item)))//需要将node节点数据处理成createNode接收的格式})data.edges?.forEach((item: any) => {cells.push(graph.createEdge(item))})graph.resetCells(cells)graph.centerContent()graph.zoomToFit({ padding: 10, maxScale: 1 })
}
const graphInit = ()=>{graph = new Graph({container: document.getElementById('container')!,});refreshData(nodeData)//将取过来的节点信息创建到画布
}
3、将节点数据转化为createNode接收的格式(index.js)
下一步需要配置连接桩的格式
export function formatData(params: any) {const portLength = params?.ports?.length || 1const portItems = params?.ports?.map((item, index) => ({id: item.id,// 连接桩唯一 ID,默认自动生成。group: 'port',// 分组名称,指定分组后将继承分组中的连接桩选项。name: item.name,args: {x: 160,y: (index + 1) * 25 + 8,angle: 45,},// 为群组中指定的连接桩布局算法提供参数, 我们不能为单个连接桩指定布局算法,但可以为群组中指定的布局算法提供不同的参数。})) || []return {id: params.id,shape: 'node-item',x: params.x,//节点x轴位置y: params.y,//节点y轴位置width: 160,//节点宽度height: (portLength + 1) * 25 + 10,//节点高度data: params,//用来自定义节点展示节点信息,及节点连接桩信息ports: {groups: COMMON_GROUP_OPTION,//连接桩样式items: [...portItems],},}
}
4、节点样式(node.vue)
<template><div class="nodeitem"><div class="nodetitle">{{ data?.nodeName }}</div><divv-for="(item,index) in data?.ports":key="index"class="nodeport">{{ item.name }}</div></div>
</template>
<script setup lang='ts'>
import { inject, onMounted,ref } from "vue";
import { Node } from '@antv/x6'interface InoutDTO {id?: stringname: string
}
interface NodeDTO {id?: stringnodeName: stringports: InoutDTO[]
}const getNode: Function | undefined = inject<Function>("getNode");
const data =  ref<NodeDTO|undefined>(undefined)
onMounted(() => {const node = getNode?.() as Node;data.value = node?.getData()
});
</script>
<style scoped>
*{font-size: 12px
}
.nodetitle{height: 25px;line-height: 25px;font-weight: 600;color: #fff;background: #6b94f7;
}
.nodeport{padding: 0 6px;line-height: 25px;background: #f0f4fe;border-bottom: 1px solid #fff;text-align: center;
}
</style>
5、连接桩配置(index.js)
export const COMMON_GROUP_OPTION = {port:{markup: [{tagName: 'rect',//矩形selector: 'portBody',},],position: {name: 'absolute',args: { x: 0, y: 0 },//相对节点绝对定位,在formatData有重置位置},attrs: {//样式portBody: {width: 6,height: 6,strokeWidth: 2,stroke: '#6A93FF',fill: '#fff',magnet: true,},},zIndex: 3,},
}
6、最后配置一下画布连接规则(index.js)
// 画布配置
export const GRAPH_CONFIG = {autoResize: true,panning: {enabled: true,// 没有导出类型 EventTypeeventTypes: ['leftMouseDown'] as any,// rightMouseDown},highlighting: {// 高亮magnetAvailable: {name: 'stroke',args: {attrs: {portBody: {stroke: '#ccc',},},},},magnetAdsorbed: {// port自动吸附,跟snap一起用name: 'stroke',args: {attrs: {stroke: '#31d0c6',},},},},
}
// 连线配置
export const CONNECTING_CONFIG = {snap: {radius: 30,},allowBlank: false,allowLoop: false,allowNode: false,allowEdge: false,allowMulti: true,highlight: true,anchor: 'orth',connector: 'rounded',connectionPoint: 'boundary',router: {name: 'er',args: {offset: 25,direction: 'H',},},
}
index.vue内
import { GRAPH_CONFIG, CONNECTING_CONFIG, NODE_DATA,formatData } from "./index";
const graphInit = ()=>{graph = new Graph({container: document.getElementById('container')!,...GRAPH_CONFIG,connecting: { // 连线规则...CONNECTING_CONFIG,createEdge() {return new Shape.Edge({attrs: {line: {stroke: '#E3EEFF',strokeWidth: 2,},},})},}});refreshData(nodeData)
}
7、最后呈现样式