使用GPT让你的RStudio如虎添翼
API的的调用目前来说不限制地区,但是OpenAI的API的申请限制了地区。运行的时候,如果出现了429,意味着你被限流了,需要等一会才行。
前提是,你需要注册一个OpenAI的账户,然后在https://openai.com/api/ 里申请OpenAI的密钥。
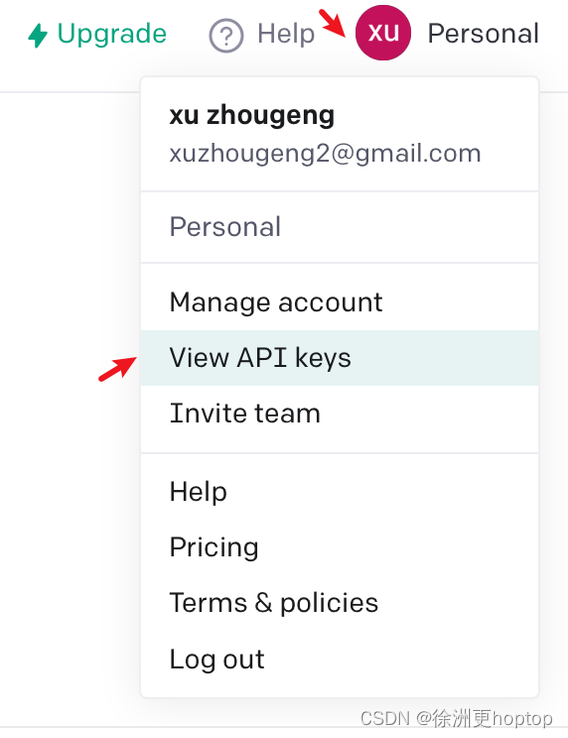
在页面左上角,点击头像,选择View API Keys
然后新建一个密钥,并复制。

接着,我们需要在R语言中设置一个环境变量OPENAI_API_KEY。
这有两种方式,一种是每次启动RStudio后手动运行如下代码
Sys.setenv(OPENAI_API_KEY = "你复制的密钥")另一种是利用usethis包,通过如下代码在项目目录下创建一个.Renviron文件
library(usethis)
usethis::edit_r_environ(scope = "project")
在该文件中设置OPENAI_API_KEY,并保存该文件。

之后从github上安装gptstudio
#install.packages("devtools")
devtools::install_github("MichelNivard/gptstudio")
安装完毕后,你的RStudio中的Addins就会出现GPTSTUDIO工具栏

如我们所见,它的功能主要有7项。
我们可以让它帮我们写代码,例如你写了一段注释,
# write a R code for volcano plot with result from
# DESeq2
然后选择插件的Write/Code from prompt,过了一会就能生成如下的代码
# install and load the DESeq2 package
install.packages("DESeq2")
library(DESeq2)# read the data
data <- read.csv("data.csv")# create a DESeqDataSet
dds <- DESeqDataSetFromMatrix(countData = data,colData = data$condition,design = ~ condition)# run the DESeq2
dds <- DESeq(dds)# extract the results
res <- results(dds)# create the volcano plot
plot(res$log2FoldChange, -log10(res$padj),xlab = "log2 Fold Change",ylab = "-log10 Adjusted p-value",main = "Volcano Plot")# add points
points(res$log2FoldChange, -log10(res$padj),pch = 20,col = ifelse(res$padj < 0.05, "red", "black"))# add lines
abline(h = -log10(0.05), lty = 2, col = "blue")
abline(v = 0, lty = 2, col = "blue")
此外,可以让它帮我们给代码写注释,比如说你在Rstudio中输入如下内容,
set.seed(1)
mtcars2 <- transform(mtcars, mpg = ifelse(runif(32) < 0.2, NA, mpg))
ggplot(mtcars2, aes(wt, mpg)) +geom_point()
选择代码后,在Addins中选择了 Comment your code,我们就会得到如下的内容。
# load the ggplot2 package
library(ggplot2)
# set the seed for the random number generator
set.seed(1)
# create a new variable called mtcars2, which is a copy of the mtcars dataset
# with 20% of the mpg values replaced with NA
mtcars2 <- transform(mtcars, mpg = ifelse(runif(32) < 0.2, NA, mpg))
# create a scatterplot of mpg vs wt, with mpg on the y-axis and wt on the x-axis
ggplot(mtcars2, aes(wt, mpg)) +geom_point()
其他功能可以通过官方文档进行了解哦https://github.com/MichelNivard/gptstudio