Chrome DevTools Protocol 开启协议监视器
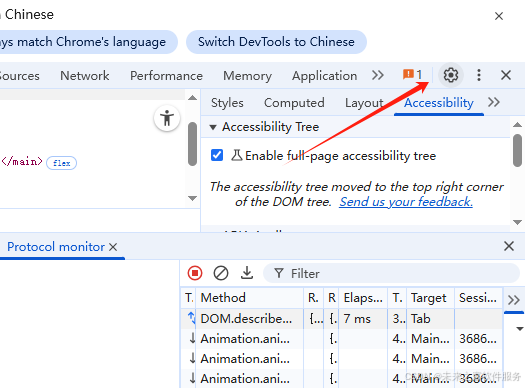
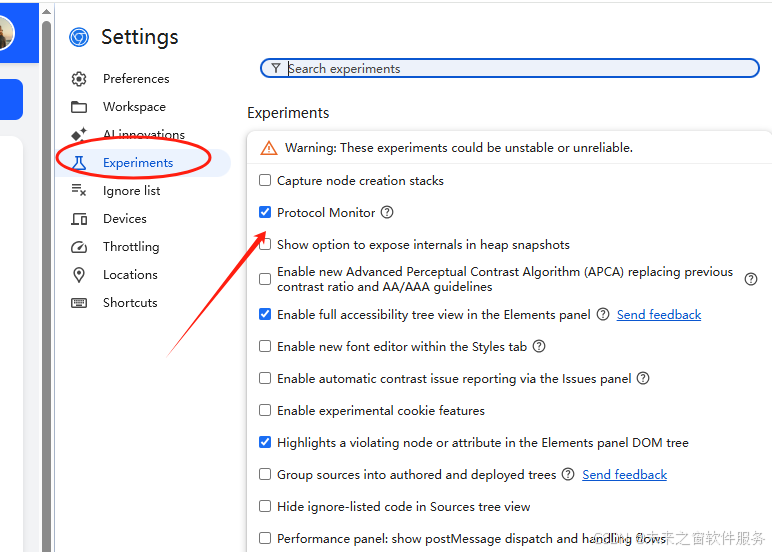
第一步:打开设置
打开代码监视器
输入命令
按以下任一键打开命令菜单:
- macOS:Command+Shift+P
- Windows、Linux、ChromeOS:Ctrl+Shift+P
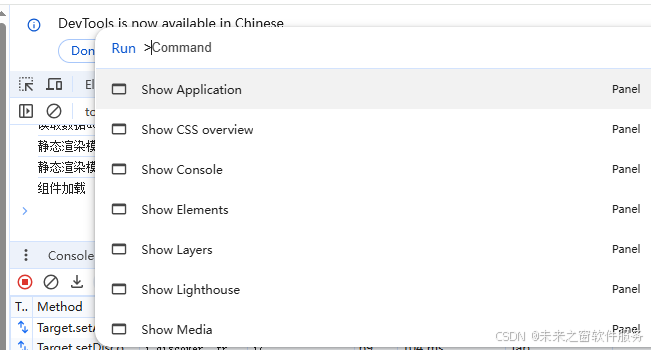
命令参数
Show Protocol monitor
记录 CDP 请求和响应
当您打开协议监视器时,它会自动开始录制当前网页中的 CDP 消息。即使您刷新页面或关闭 DevTools,协议监视器也会继续录制。
如需停止或开始录制,请点击面板顶部操作栏左侧的录制按钮。
点击相应的标头标签页,即可在请求或响应数据之间切换。
右键点击“方法”列中的值可显示基于上下文的选项。
清除和下载 CDP 消息
如需清除所有已记录的 CDP 消息,请点击操作栏中的清除分块按钮。
如需将录制的邮件下载为 JSON 文件,请点击“下载”图标 下载。
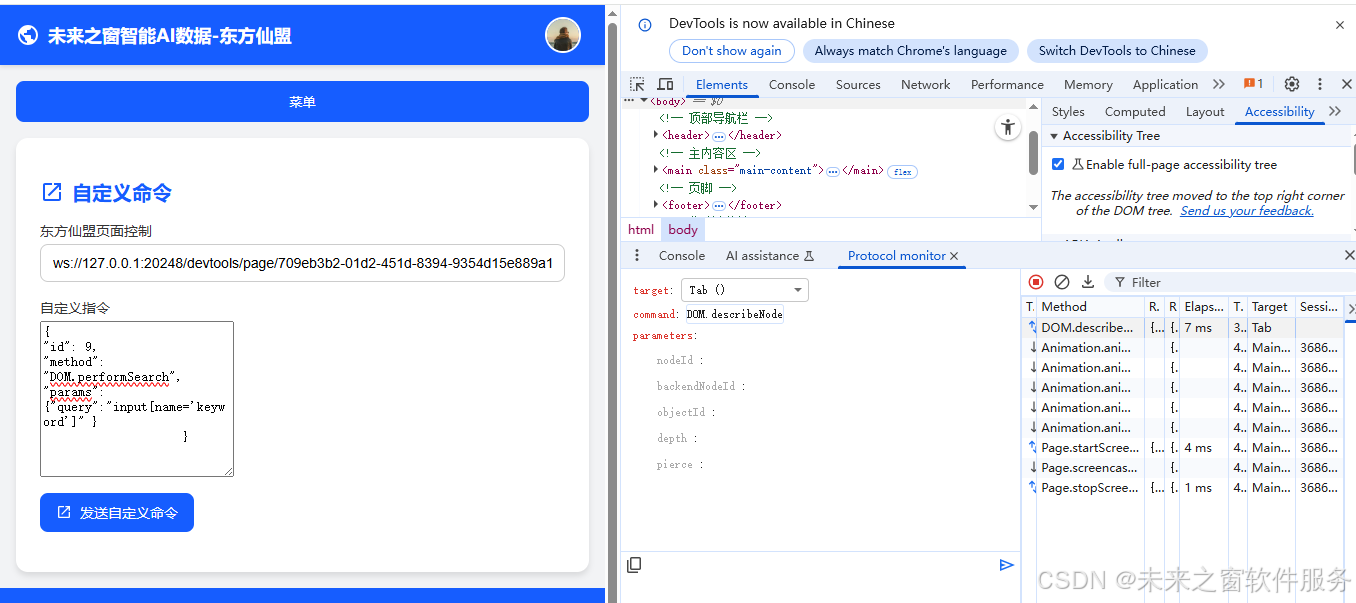
发送原始 CDP 命令
通过协议监视器发送 CDP 命令主要有两种方式:
如果命令不需要任何参数,请在 Protocol Monitor(协议监视器)底部的输入字段中输入该命令,然后按 Enter 键,例如
Page.captureScreenshot。如果命令需要参数,请以 JSON 格式提供这些参数,例如
{"cmd":"Page.captureScreenshot","args":{"format": "jpeg"}}。输入字段右侧的下拉菜单用于指定目标。
参考资料
The Chrome DevTools Protocol allows for tools to instrument, inspect, debug and profile Chromium, Chrome and other Blink-based browsers. Many existing projects currently use the protocol. The Chrome DevTools uses this protocol and the team maintains its API.
Instrumentation is divided into a number of domains (DOM, Debugger, Network etc.). Each domain defines a number of commands it supports and events it generates. Both commands and events are serialized JSON objects of a fixed structure.
Protocol API Docs
The latest (tip-of-tree) protocol (tot) — It changes frequently and can break at any time. However it captures the full capabilities of the Protocol, whereas the stable release is a subset. There is no backwards compatibility support guaranteed.
v8-inspector protocol (v8) — Enables debugging & profiling of Node.js apps.
stable 1.3 protocol (1-3) — The stable release of the protocol, tagged at Chrome 64. It includes a smaller subset of the complete protocol compatibilities.
Resources
See Getting Started with CDP. The awesome-chrome-devtools page links to many of the tools in the protocol ecosystem, including protocol API libraries in JavaScript, TypeScript, Python, Java, and Go.
Consider subscribing to the chrome-debugging-protocol mailing list.
Monitoring the protocol
This is especially handy to understand how the DevTools frontend makes use of the protocol. You can view all requests/responses and methods as they happen.
Screenshot of the Protocol Monitor
Click the gear icon in the top-right of the DevTools to open the Settings panel. Select Experiments on the left of settings. Turn on "Protocol Monitor", then close and reopen DevTools. Now click the ⋮ menu icon, choose More Tools and then select Protocol monitor.
You can also issue your own commands using Protocol Monitor. If the command does not require any parameters, type the command into the prompt at the bottom of the Protocol Monitor panel and press Enter, for example, Page.captureScreenshot. If the command requires parameters, provide them as JSON, for example, {"cmd":"Page.captureScreenshot","args":{"format": "jpeg"}}.
By clicking on the icon next to the command input (in Chrome 117+), you can open the command editor. After you select a CDP command, the editor creates a structured form based on the protocol definitions that allows you to edit parameters, and view their documentation and types. Send the commands by clicking on the send button or using Ctrl + Enter. Use the context menu in the list of previously sent commands to open one of them in the editor.
Screenshot of CDP Editor
Alternatively, you can execute commands from the DevTools console. First, open devtools-on-devtools, then within the inner DevTools window, use Main.MainImpl.sendOverProtocol() in the console:
let Main = await import('./devtools-frontend/front_end/entrypoints/main/main.js'); // or './entrypoints/main/main.js' or './main/main.js' depending on the browser version
await Main.MainImpl.sendOverProtocol('Emulation.setDeviceMetricsOverride', {
mobile: true,
width: 412,
height: 732,
deviceScaleFactor: 2.625,
});
const data = await Main.MainImpl.sendOverProtocol("Page.captureScreenshot");
DevTools protocol via Chrome extension
To allow chrome extensions to interact with the protocol, we introduced chrome.debugger extension API that exposes this JSON message transport interface. As a result, you can not only attach to the remotely running Chrome instance, but also instrument it from its own extension.
Chrome Debugger Extension API provides a higher level API where command domain, name and body are provided explicitly in the sendCommand call. This API hides request ids and handles binding of the request with its response, hence allowing sendCommand to report result in the callback function call. One can also use this API in combination with the other Extension APIs.
If you are developing a Web-based IDE, you should implement an extension that exposes debugging capabilities to your page and your IDE will be able to open pages with the target application, set breakpoints there, evaluate expressions in console, live edit JavaScript and CSS, display live DOM, network interaction and any other aspect that Developer Tools is instrumenting today.
Opening embedded Developer Tools will terminate the remote connection and thus detach the extension.
Frequently Asked Questions
How is the protocol defined?
The canonical protocol definitions live in the Chromium source tree: (browser_protocol.pdl and js_protocol.pdl). They are maintained manually by the DevTools engineering team. The declarative protocol definitions are used across tools; for instance, a binding layer is created within Chromium for the Chrome DevTools to interact with, and separately bindings generated for Chrome Headless’s C++ interface.
Can I get the protocol as JSON?
These canonical .pdl files are mirrored on GitHub in the devtools-protocol repo where JSON versions, TypeScript definitions and closure typedefs are generated. It's published regularly to NPM.
Also, if you've set --remote-debugging-port=9222 with Chrome, the complete protocol version it speaks is available at localhost:9222/json/protocol.
How do I access the browser target?
The endpoint is exposed as webSocketDebuggerUrl in /json/version. Note the browser in the URL, rather than page. If Chrome was launched with --remote-debugging-port=0 and chose an open port, the browser endpoint is written to both stderr and the DevToolsActivePort file in browser profile folder.
Does the protocol support multiple simultaneous clients?
Chrome 63 introduced support for multiple clients. See this article for details.
Upon disconnection, the outgoing client will receive a detached event. For example: {"method":"Inspector.detached","params":{"reason":"replaced_with_devtools"}}. View the enum of possible reasons. (For reference: the original patch). After disconnection, some apps have chosen to pause their state and offer a reconnect button.
HTTP Endpoints
If started with a remote-debugging-port, these HTTP endpoints are available on the same port. (Chromium implementation)
GET /json/version
Browser version metadata
{
"Browser": "Chrome/72.0.3601.0",
"Protocol-Version": "1.3",
"User-Agent": "Mozilla/5.0 (Macintosh; Intel Mac OS X 10_13_6) AppleWebKit/537.36 (KHTML, like Gecko) Chrome/72.0.3601.0 Safari/537.36",
"V8-Version": "7.2.233",
"WebKit-Version": "537.36 (@cfede9db1d154de0468cb0538479f34c0755a0f4)",
"webSocketDebuggerUrl": "ws://localhost:9222/devtools/browser/b0b8a4fb-bb17-4359-9533-a8d9f3908bd8"
}
GET /json or /json/list
A list of all available websocket targets.
[ {
"description": "",
"devtoolsFrontendUrl": "/devtools/inspector.html?ws=localhost:9222/devtools/page/DAB7FB6187B554E10B0BD18821265734",
"id": "DAB7FB6187B554E10B0BD18821265734",
"title": "Yahoo",
"type": "page",
"url": " ",
"webSocketDebuggerUrl": "ws://localhost:9222/devtools/page/DAB7FB6187B554E10B0BD18821265734"
} ]
GET /json/protocol/
The current devtools protocol, as JSON:
{
"domains": [
{
"domain": "Accessibility",
"experimental": true,
"dependencies": [
"DOM"
],
"types": [
{
"id": "AXValueType",
"description": "Enum of possible property types.",
"type": "string",
"enum": [
"boolean",
"tristate",
// ...
PUT /json/new?{url}
Opens a new tab. Responds with the websocket target data for the new tab.
GET /json/activate/{targetId}
Brings a page into the foreground (activate a tab).