Tomcat线程池深度优化指南:高并发场景下的maxConnections计算与监控体系
Tomcat线程池深度优化指南:高并发场景下的maxConnections计算与监控体系
- 一、maxConnections黄金计算公式深度解析
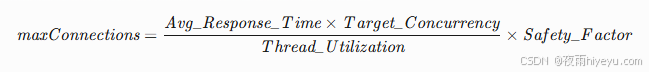
- 1.1 核心公式推导
- 1.2 参数详解与取值指南
- 1.3 不同业务场景计算案例
- 案例1:电商下单接口(CPU密集型)
- 案例2:文件上传服务(I/O密集型)
- 1.4 操作系统级优化
- 二、线程池多维度监控体系
- 2.1 Prometheus+Grafana监控看板
- 数据采集配置
- Grafana看板核心指标
- 告警规则配置
- 2.2 线程级深度监控
- 线程状态分析脚本
- 线程热点检测
- 三、动态调优策略
- 3.1 基于流量模式的弹性配置
- 弹性扩缩脚本
- 3.2 连接泄漏检测
- 四、高并发场景优化实战
- 4.1 百万连接架构设计
- 4.2 配置模板
- 4.3 压力测试模型
- 五、故障应急手册
- 5.1 连接拒绝故障处理流程
- 5.2 性能劣化快速诊断
- 六、云原生环境适配
- 6.1 Kubernetes部署优化
- 6.2 自动弹性扩缩容
- 七、最佳实践总结
- 7.1 参数调优黄金法则
- 7.2 监控指标健康阈值
- 7.3 版本兼容性矩阵
一、maxConnections黄金计算公式深度解析
1.1 核心公式推导
1.2 参数详解与取值指南
| 参数 | 含义 | 测量方法 | 推荐值 |
|---|---|---|---|
| Avg_Response_Time | 平均响应时间(ms) | APM工具监控 | 生产环境实测 |
| Target_Concurrency | 目标并发量 | 压测获取QPS峰值 | QPS×Avg_Response_Time/1000 |
| Thread_Utilization | 线程利用率 | (Busy_Threads / maxThreads)×100% | 70%~80% |
| Safety_Factor | 安全系数 | 根据业务稳定性要求 | 1.2~1.5 |
1.3 不同业务场景计算案例
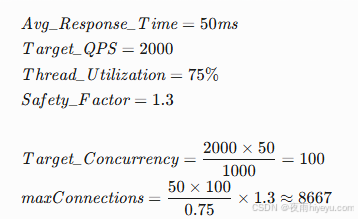
案例1:电商下单接口(CPU密集型)
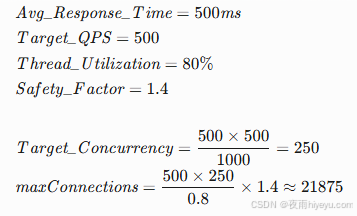
案例2:文件上传服务(I/O密集型)
1.4 操作系统级优化
# Linux内核参数优化(/etc/sysctl.conf)
net.core.somaxconn=65535
net.ipv4.tcp_max_syn_backlog=65535
net.ipv4.tcp_syncookies=1
net.ipv4.tcp_tw_reuse=1
net.ipv4.tcp_fin_timeout=30
fs.file-max=1000000# 用户级限制(/etc/security/limits.conf)
* soft nofile 1000000
* hard nofile 1000000
tomcat soft nproc 65535
tomcat hard nproc 65535
二、线程池多维度监控体系
2.1 Prometheus+Grafana监控看板
数据采集配置
# jmx_exporter.yml
lowercaseOutputName: true
rules:- pattern: 'Catalina<name=(\w+), type=ThreadPool><>(\w+):'name: tomcat_threadpool_$2labels:pool: "$1"- pattern: 'Catalina<name=(\w+), type=GlobalRequestProcessor><>(\w+):'name: tomcat_connector_$2labels:protocol: "$1"
Grafana看板核心指标
告警规则配置
# prometheus/rules/tomcat.rules.yml
groups:
- name: tomcat-alertrules:- alert: ThreadPoolExhaustedexpr: tomcat_threadpool_currentThreadCountBusy / tomcat_threadpool_maxThreads > 0.9for: 5mlabels:severity: criticalannotations:summary: "线程池过载 ({{ $labels.instance }})"description: "线程使用率超过90%"- alert: ConnectionQueueFullexpr: tomcat_threadpool_backlog / tomcat_threadpool_maxThreads > 0.8for: 3mlabels:severity: warningannotations:summary: "连接队列积压 ({{ $labels.instance }})"description: "等待队列超过线程数80%"
2.2 线程级深度监控
线程状态分析脚本
#!/bin/bash
# thread_analyzer.shPID=$(ps aux | grep tomcat | grep -v grep | awk '{print $2}')
jstack $PID > thread_dump.txt# 分析线程状态
WAITING=$(grep -c "WAITING" thread_dump.txt)
BLOCKED=$(grep -c "BLOCKED" thread_dump.txt)
RUNNABLE=$(grep -c "RUNNABLE" thread_dump.txt)echo "线程状态统计:"
echo "  RUNNABLE: $RUNNABLE"
echo "  WAITING : $WAITING"
echo "  BLOCKED : $BLOCKED"# 检测死锁
grep -A 1 "deadlock" thread_dump.txt | grep -B 1 "java.lang.Thread.State"
线程热点检测
// 注册MBean监控
public class ThreadMonitor implements ThreadMonitorMBean {public String getHotThreads(int topN) {ThreadMXBean threadBean = ManagementFactory.getThreadMXBean();long[] ids = threadBean.getAllThreadIds();// 获取线程CPU时间Map<Long, Long> times = new HashMap<>();for(long id : ids) {long cpuTime = threadBean.getThreadCpuTime(id);if(cpuTime > 0) times.put(id, cpuTime);}// 排序取TopNreturn times.entrySet().stream().sorted(Map.Entry.comparingByValue(Comparator.reverseOrder())).limit(topN).map(e -> "ThreadID: " + e.getKey() + " CPU: " + e.getValue()/1000000 + "ms").collect(Collectors.joining("\n"));}
}
三、动态调优策略
3.1 基于流量模式的弹性配置
<!-- 使用环境变量动态配置 -->
<Connector executor="tomcatThreadPool"maxConnections="${env.CONN_MAX:-10000}" acceptCount="${env.QUEUE_SIZE:-500}"maxThreads="${env.MAX_THREADS:-800}"
/>
弹性扩缩脚本
#!/bin/bash
# adjust_pool.sh# 获取当前QPS
QPS=$(curl -s http://localhost:8080/metrics | grep 'tomcat_global_request_processor_request_count' | cut -d' ' -f2)# 计算新线程数
MAX_THREADS=$(( ($QPS * 50 / 1000) + 100 ))# 更新配置
sed -i "s/<maxThreads>[0-9]*</<maxThreads>$MAX_THREADS</" $CATALINA_HOME/conf/server.xml# 优雅重启
$CATALINA_HOME/bin/shutdown.sh && $CATALINA_HOME/bin/startup.sh
3.2 连接泄漏检测
public class LeakDetectionFilter implements Filter {private static final ThreadLocal<Long> startTime = new ThreadLocal<>();@Overridepublic void doFilter(ServletRequest request, ServletResponse response, FilterChain chain) {startTime.set(System.currentTimeMillis());try {chain.doFilter(request, response);} finally {long duration = System.currentTimeMillis() - startTime.get();if(duration > 30000) { // 30秒超时log.warn("潜在连接泄漏: {}ms, URI={}", duration, ((HttpServletRequest)request).getRequestURI());}startTime.remove();}}
}
四、高并发场景优化实战
4.1 百万连接架构设计
4.2 配置模板
<Connector protocol="org.apache.coyote.http11.Http11Nio2Protocol"port="8080"maxConnections="50000"acceptorThreadCount="2" maxThreads="1000"minSpareThreads="50"connectionTimeout="30000"keepAliveTimeout="30000"maxKeepAliveRequests="100"acceptCount="5000"processorCache="5000"socket.rxBufSize="65536"socket.txBufSize="65536"socket.directBuffer="true"socket.appReadBufSize="65536"socket.appWriteBufSize="65536"socket.bufferPool="50000"socket.processorCache="5000"useSendfile="false" ><UpgradeProtocol className="org.apache.coyote.http2.Http2Protocol" />
</Connector>
4.3 压力测试模型
# JMeter分布式压测命令
jmeter -n -t load_test.jmx -R 192.168.1.101,192.168.1.102 -l result.jtl# 梯度增压参数
ThreadGroup.scheduler=true
ThreadGroup.duration=3600
ThreadGroup.delay=1000
ThreadGroup.ramp_time=300
五、故障应急手册
5.1 连接拒绝故障处理流程
5.2 性能劣化快速诊断
# 一键诊断脚本
#!/bin/bash
# tomcat_diag.shecho "========== 系统状态 =========="
top -b -n 1 | head -20
echo ""
echo "========== 网络连接 =========="
netstat -ant | awk '{print $6}' | sort | uniq -c
echo ""
echo "========== 线程池状态 =========="
curl -s http://localhost:8080/manager/status?XML=true | xmllint --format -
echo ""
echo "========== 内存状态 =========="
jstat -gc $(pgrep java) 1000 5
六、云原生环境适配
6.1 Kubernetes部署优化
# tomcat-deployment.yaml
apiVersion: apps/v1
kind: Deployment
spec:template:spec:containers:- name: tomcatimage: tomcat:9.0resources:limits:cpu: "4"memory: 8Girequests:cpu: "2"memory: 4Gienv:- name: MAX_THREADSvalue: "800"- name: MAX_CONNECTIONSvalue: "10000"ports:- containerPort: 8080livenessProbe:httpGet:path: /manager/text/serverinfoport: 8080initialDelaySeconds: 120periodSeconds: 10readinessProbe:httpGet:path: /manager/text/threaddumpport: 8080initialDelaySeconds: 30periodSeconds: 5
6.2 自动弹性扩缩容
# hpa.yaml
apiVersion: autoscaling/v2
kind: HorizontalPodAutoscaler
metadata:name: tomcat-hpa
spec:scaleTargetRef:apiVersion: apps/v1kind: Deploymentname: tomcatminReplicas: 3maxReplicas: 20metrics:- type: Podspods:metric:name: tomcat_threadpool_utilizationtarget:type: AverageValueaverageValue: 70
七、最佳实践总结
7.1 参数调优黄金法则
- 线程数设置:
maxThreads = \frac{CPU\_Cores \times Target\_CPU\_Utilization \times (1 + Wait\_Ratio)}{Task\_Time}
- Wait_Ratio = I/O等待时间 / 计算时间
- Target_CPU_Utilization ≈ 0.8
- 连接数公式:
maxConnections = \frac{maxThreads}{1 - Target\_Response\_Time\_Percentile}
- 目标响应时间百分位:P99建议0.99,P95建议0.95
7.2 监控指标健康阈值
| 指标 | 警告阈值 | 危险阈值 | 检查项 |
|---|---|---|---|
| 线程利用率 | >75% | >90% | 增加maxThreads |
| 队列使用率 | >60% | >80% | 增大acceptCount |
| 连接拒绝率 | >0.1% | >1% | 检查maxConnections |
| P99响应时间 | >500ms | >1000ms | 优化业务逻辑 |
| 错误率 | >0.5% | >2% | 排查异常请求 |
7.3 版本兼容性矩阵
| Tomcat版本 | JDK版本 | 推荐协议 | 特性支持 |
|---|---|---|---|
| 9.x | 8/11/17 | NIO2 | 全特性支持 |
| 8.5.x | 7/8/11 | NIO | 生产稳定版 |
| 7.x | 6/7/8 | BIO/NIO | 逐步淘汰 |
通过本指南的系统化配置,Tomcat线程池可稳定支撑数万并发连接,建议结合业务场景定期进行压力测试验证。