echarts tooltip高亮某个值,某一项选中高亮状态
需求:
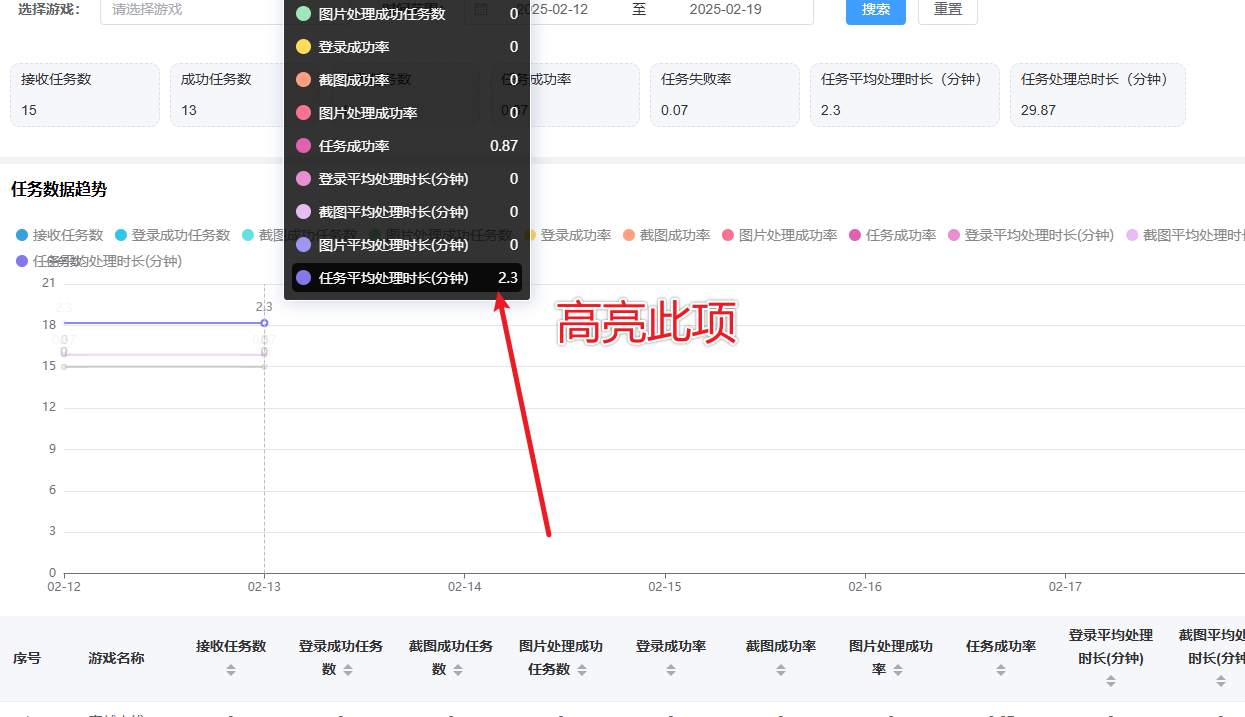
当有多组数据的时候,常常需要对比同一x轴的不同线上的点的数据,并且当数据组过多的时候,也就是线过多的时候,需要明确知道我们当前选中的线是哪条。
解决方案:
通过设置显示x轴的tooltip可以显示同一x轴点上面的各个线上面的数据,通过自定义tooltip和监听事件可以设置高亮当前鼠标悬停或点击的线对应的数据组。
组件完整代码
useECharts文档:https://pure-admin-utils.netlify.app/hooks/useECharts/useECharts
<script setup lang="ts">
import { ref, computed } from "vue";
import { useDark, useECharts } from "@pureadmin/utils";const { isDark } = useDark();
const theme = computed(() => (isDark.value ? "dark" : "light"));const chartRef = ref();
const { resize, setOptions } = useECharts(chartRef, {theme
});
// 大数据显示设置
const otherSettingShowNumber = 60;
const loading = ref(true);
function renderECharts() {const yData = [{name: "接收任务数",data: [15, 15]},{name: "登录成功任务数",data: [0, 0]},{name: "截图成功任务数",data: [0, 0]},{name: "图片处理成功任务数",data: [0, 0]},{name: "登录成功率",data: [0, 0]},{name: "截图成功率",data: [0, 0]},{name: "图片处理成功率",data: [0, 0]},{name: "任务成功率",data: [0.87, 0.87]},{name: "登录平均处理时长(分钟)",data: [0, 0]},{name: "截图平均处理时长(分钟)",data: [0, 0]},{name: "图片平均处理时长(分钟)",data: [0, 0]},{name: "任务平均处理时长(分钟)",data: [2.3, 2.3]}];const xData = ["2025-02-12","2025-02-13","2025-02-14","2025-02-15","2025-02-16","2025-02-17","2025-02-18","2025-02-19"];loading.value = true;const target: any = {};const options: any = {animation: !(xData.length >= otherSettingShowNumber), // 数据过大关闭动画tooltip: {trigger: "axis",backgroundColor: "var(--el-overlay-color)",borderWidth: 1,padding: 8,appendTo: document.body,extraCssText: "box-shadow: 2px 2px 16px 1px rgba(0, 39, 102, 0.16);",formatter: function (params) {let content = `<div style='font-size: 14px; color: #fff;'>${params[0].name}</div>`;if (Array.isArray(params)) {for (let i = 0; i < params.length; i++) {const isHighlight =target.currentDataIndex === params[i].dataIndex &&target.currentSeriesIndex === params[i].seriesIndex;content += `<div style='display: flex; align-items: center; justify-content: space-between; padding: 4px; margin-top: 4px; color: #fff; width: 100%; border-radius: 5px; background-color: ${isHighlight ? "var(--el-overlay-color)" : "transparent"}'><div style='display: flex; align-items: center; margin-right: 30px;'><div style='width: 15px; height: 15px; border-radius: 10px; background: ${params[i].color}; margin-right: 8px;'></div><div style='font-size: 14px;'>${params[i].seriesName}</div></div><div style='font-size: 14px;'>${params[i].value}</div></div>`;}}return content;}},toolbox: {show: xData.length >= otherSettingShowNumber,left: "right",itemSize: 12,top: 18,feature: {dataZoom: {title: {zoom: "区域缩放",back: "区域缩放还原"},yAxisIndex: "none"},myRestore: {show: true,title: "还原",icon: "path://M512 981.333333c-209.866667 0-396.693333-126.026667-466.293333-314.08a35.52 35.52 0 0 1 23.626666-44.426666 38.613333 38.613333 0 0 1 48 20.693333c58.666667 158.933333 217.013333 265.493333 394.666667 265.6s336-106.666667 394.666667-266.133333a37.6 37.6 0 0 1 28.853333-23.626667 38.986667 38.986667 0 0 1 35.786667 11.946667 34.773333 34.773333 0 0 1 7.146666 35.36c-69.386667 188.373333-256.48 314.666667-466.453333 314.666666z m431.36-574.08a37.92 37.92 0 0 1-35.946667-24.266666C849.386667 222.56 690.613333 114.88 512 114.72S174.72 222.346667 116.746667 382.773333A38.72 38.72 0 0 1 69.333333 403.733333a35.786667 35.786667 0 0 1-24.106666-44.373333C113.333333 169.866667 301.013333 42.666667 512 42.666667s398.666667 127.306667 467.146667 316.96a34.56 34.56 0 0 1-4.906667 32.64 38.933333 38.933333 0 0 1-30.88 14.986666z",onclick: () => {renderECharts(); // 重新渲染图表}}}},legend: {right: 20,icon: "circle",itemWidth: 12,itemHeight: 12,itemGap: 12,textStyle: {color: "#888",fontSize: 14,lineHeight: 14,rich: {a: {verticalAlign: "middle"}},padding: [0, 0, -2, 0]}},grid: {left: "3%",right: "2%",bottom: "3%",containLabel: true},xAxis: {type: "category",boundaryGap: false,axisLabel: {interval: 0, // 显示所有标签rotate: xData.length >= otherSettingShowNumber ? 45 : 0, // 解决xAxis无法展示全部标签的问题formatter: function (value) {return value.split("-").slice(1).join("-"); // 仅显示月-日}},data: xData},yAxis: {type: "value",name: "任务数"},series: yData.map(item => ({...item,type: "line",stack: "Total",smooth: true,emphasis: {focus: "self"},label: {show: true,position: "top",formatter: "{c}",color: "#888",fontSize: 12}}))};setOptions({ ...options },{// 渲染完成name: "rendered",callback: () => {loading.value = false;}},{name: "mousemove",callback: e => {target.currentSeriesIndex = e.seriesIndex;target.currentDataIndex = e.dataIndex;}},{name: "mouseout",callback: () => {target.currentSeriesIndex = 0;target.currentDataIndex = 0;}});resize();
}defineExpose({renderECharts
});
</script><template><div ref="chartRef" v-loading="loading" class="w-full h-[30vh]" />
</template>