WPF实现曲线数据展示【案例:震动数据分析】
wpf实现曲线数据展示,函数曲线展示,实例:震动数据分析为例。

如上图所示,如果你想实现上图中的效果,请详细参考我的内容,创作不易,给个赞吧。
一共有两种方式来实现,一种是使用第三方的框架来实现,另外一种是自己通过原创代码来一步步实现,本文主要介绍这两种曲线的实现方式。
1.首先我创建一个wpf的解决方案项目。

2.在NuGet中添加 DynamicDataDisplay 项目支持

为了展示我们的UI界面,我们还添加了一个第三方的样式框架 Panuon.UI.Silver

3.我们在MainWindow.xaml文件中添加如下代码
<d3:ChartPlotter x:Name="plotter"><d3:Header x:Name="HeaderTitle" Visibility="Visible" Content="这是曲线的标题" FontSize="14" HorizontalAlignment="Center" /><d3:VerticalAxisTitle Content="Value" FontSize="14" Visibility="Collapsed"/><d3:HorizontalAxisTitle Content="时间" FontSize="14" Visibility="Collapsed"/></d3:ChartPlotter>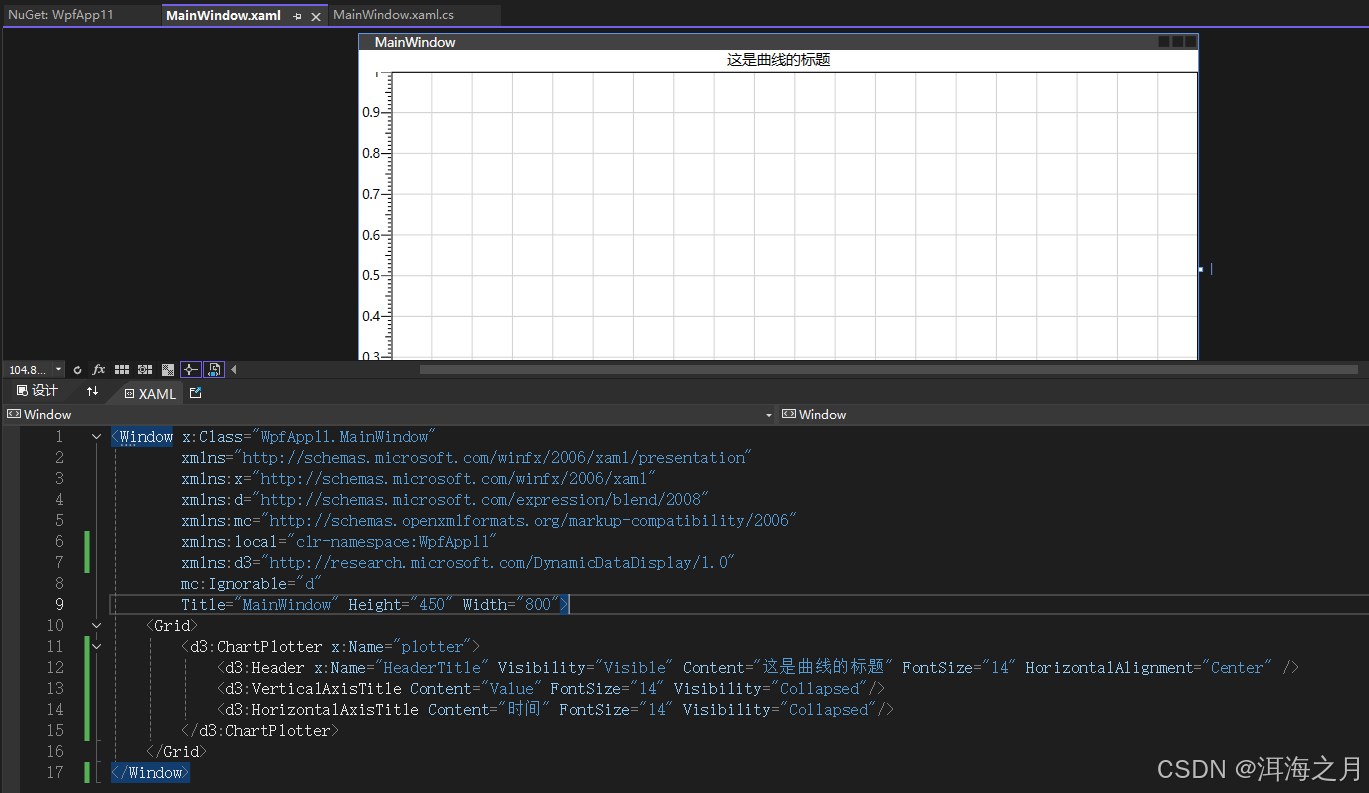
4.接下来我们就开始实现后台代码部分
- MainWindow.xaml
<Window x:Class="WpfApp11.MainWindow"xmlns="http://schemas.microsoft.com/winfx/2006/xaml/presentation"xmlns:x="http://schemas.microsoft.com/winfx/2006/xaml"xmlns:pu="clr-namespace:Panuon.UI.Silver;assembly=Panuon.UI.Silver"xmlns:d="http://schemas.microsoft.com/expression/blend/2008"xmlns:mc="http://schemas.openxmlformats.org/markup-compatibility/2006"xmlns:local="clr-namespace:WpfApp11"xmlns:d3="http://research.microsoft.com/DynamicDataDisplay/1.0"mc:Ignorable="d"Title="MainWindow" Height="450" Width="800"><Grid><StackPanel Panel.ZIndex="1" Margin="50,40,0,0" HorizontalAlignment="Left" VerticalAlignment="Top" Orientation="Vertical"><CheckBox x:Name="XCheckBox" IsChecked="True"pu:CheckBoxHelper.CheckBoxStyle="Standard" pu:CheckBoxHelper.BoxHeight="20" pu:CheckBoxHelper.BoxWidth="20" pu:CheckBoxHelper.CornerRadius="15"pu:CheckBoxHelper.CheckedBackground="{Binding ColorX}"><CheckBox.Content><DockPanel><TextBlock VerticalAlignment="Center" FontSize="14" FontWeight="Bold" Text="X:" Foreground="{Binding ColorX}"/><TextBlock x:Name="txtFhr1" Text="{Binding ValueX}" FontSize="32" FontWeight="Bold" Foreground="{Binding ColorX}"/></DockPanel></CheckBox.Content></CheckBox><CheckBox x:Name="YCheckBox" IsChecked="True" pu:CheckBoxHelper.CheckedBackground="{Binding ColorY}" pu:CheckBoxHelper.CheckBoxStyle="Standard" pu:CheckBoxHelper.BoxHeight="20" pu:CheckBoxHelper.BoxWidth="20" pu:CheckBoxHelper.CornerRadius="15"><CheckBox.Content><DockPanel><TextBlock VerticalAlignment="Center" FontSize="14" FontWeight="Bold" Text="Y:" Foreground="{Binding ColorY}"/><TextBlock x:Name="txtFhr2" Text="{Binding ValueY}" FontSize="32" FontWeight="Bold" Foreground="{Binding ColorY}" /></DockPanel></CheckBox.Content></CheckBox><CheckBox x:Name="ZCheckBox" IsChecked="True" pu:CheckBoxHelper.CheckedBackground="{Binding ColorZ}" pu:CheckBoxHelper.CheckBoxStyle="Standard" pu:CheckBoxHelper.BoxHeight="20" pu:CheckBoxHelper.BoxWidth="20" pu:CheckBoxHelper.CornerRadius="15"><CheckBox.Content><DockPanel><TextBlock VerticalAlignment="Center" FontSize="14" FontWeight="Bold" Text="Z:" Foreground="{Binding ColorZ}"/><TextBlock x:Name="txtFhr3" Text="{Binding ValueZ}" FontSize="32" FontWeight="Bold" Foreground="{Binding ColorZ}"/></DockPanel></CheckBox.Content></CheckBox><TextBlock VerticalAlignment="Center" FontSize="14" Text="单位:1g≈9.80 m/s²" Margin="0,10"/></StackPanel><d3:ChartPlotter x:Name="plotter" MouseMove="Plotter_MouseMove" Panel.ZIndex="0"><d3:Header x:Name="HeaderTitle" Visibility="Visible" Content="这是曲线的标题" FontSize="14" HorizontalAlignment="Center" /><d3:VerticalAxisTitle Content="Value" FontSize="14" Visibility="Collapsed"/><d3:HorizontalAxisTitle Content="时间" FontSize="14" Visibility="Collapsed"/></d3:ChartPlotter></Grid> </Window> - MainWindow.cs
using Microsoft.Research.DynamicDataDisplay.DataSources; using Microsoft.Research.DynamicDataDisplay; using System; using System.Windows; using System.Windows.Controls; using System.Windows.Media; using System.Windows.Threading; using Microsoft.Research.DynamicDataDisplay.Charts; using System.Windows.Input; using Panuon.UI.Silver;namespace WpfApp11 {/// <summary>/// MainWindow.xaml 的交互逻辑/// </summary>public partial class MainWindow : Window{private readonly DispatcherTimer dispatcherTimer = new DispatcherTimer();private readonly LineGraph lineGraphX = new LineGraph();private readonly LineGraph lineGraphY = new LineGraph();private readonly LineGraph lineGraphZ = new LineGraph();private readonly ObservableDataSource<Point> xPoint = new ObservableDataSource<Point>();private readonly ObservableDataSource<Point> yPoint = new ObservableDataSource<Point>();private readonly ObservableDataSource<Point> zPoint = new ObservableDataSource<Point>();private readonly FontView fontView = new FontView();public MainWindow(){InitializeComponent();lineGraphX = plotter.AddLineGraph(xPoint, Colors.Red, 1.2, "X"); //#FFFF0000lineGraphY = plotter.AddLineGraph(yPoint, Colors.Green, 1.2, "Y"); //FF008000lineGraphZ = plotter.AddLineGraph(zPoint, Colors.Blue, 1.2, "Z");//FF0000FF //LineLegendItem.xaml标签HorizontalDateTimeAxis horizontalAxis = new HorizontalDateTimeAxis();horizontalAxis.ShowMinorTicks = false;horizontalAxis.LabelProvider = new DateTimeAxisControl().LabelProvider;horizontalAxis.IsDefaultAxis = true;horizontalAxis.ShowMayorLabels = false;horizontalAxis.LabelProvider.SetCustomView((info, uiElement) =>{(uiElement as TextBlock).Text = info.Tick.ToString("HH:mm:ss"); //时间轴日期格式});plotter.ContextMenu = PopulateContextMenu(plotter);plotter.HorizontalAxis.Remove(); //去除默认plotter.Children.Add(horizontalAxis); //加入新的Loaded += MainWindow_Loaded;this.XCheckBox.DataContext = fontView;this.YCheckBox.DataContext = fontView;this.ZCheckBox.DataContext = fontView;this.XCheckBox.Checked += XCheckBox_Checked;this.XCheckBox.Unchecked += XCheckBox_Checked;this.YCheckBox.Checked += YCheckBox_Checked;this.YCheckBox.Unchecked += YCheckBox_Checked;this.ZCheckBox.Checked += ZCheckBox_Checked;this.ZCheckBox.Unchecked += ZCheckBox_Checked;}#region CheckedEventprivate void XCheckBox_Checked(object sender, RoutedEventArgs e){CheckBox checkBox = sender as CheckBox;if (checkBox != null){if ((bool)checkBox.IsChecked){fontView.ColorX = fontView.IsColorX;}else{fontView.ColorX = fontView.UnColor;}}if (lineGraphX.Visibility == Visibility.Hidden){lineGraphX.Visibility = Visibility.Visible;}else{lineGraphX.Visibility = Visibility.Hidden;}}private void YCheckBox_Checked(object sender, RoutedEventArgs e){CheckBox checkBox = sender as CheckBox;if (checkBox != null){if ((bool)checkBox.IsChecked){fontView.ColorY = fontView.IsColorY;}else{fontView.ColorY = fontView.UnColor;}}if (lineGraphY.Visibility == Visibility.Hidden){lineGraphY.Visibility = Visibility.Visible;}else{lineGraphY.Visibility = Visibility.Hidden;}}private void ZCheckBox_Checked(object sender, RoutedEventArgs e){CheckBox checkBox = sender as CheckBox;if (checkBox != null){if ((bool)checkBox.IsChecked){fontView.ColorZ = fontView.IsColorZ;}else{fontView.ColorZ = fontView.UnColor;}}if (lineGraphZ.Visibility == Visibility.Hidden){lineGraphZ.Visibility = Visibility.Visible;}else{lineGraphZ.Visibility = Visibility.Hidden;}}#endregion/// <summary>/// 重写右键菜单/// </summary>/// <param name="plotter"></param>/// <returns></returns>/// <exception cref="NotImplementedException"></exception>private ContextMenu PopulateContextMenu(IInputElement target){ContextMenu result = new ContextMenu();StateIcon homeIcon = new StateIcon() { Icon = (char)Convert.ToInt32("f015", 16) + string.Empty };StateIcon saveIcon = new StateIcon() { Icon = (char)Convert.ToInt32("f2d2", 16) + string.Empty };StateIcon copyIcon = new StateIcon() { Icon = (char)Convert.ToInt32("f01a", 16) + string.Empty };StateIcon queryIcon = new StateIcon() { Icon = (char)Convert.ToInt32("f022", 16) + string.Empty };StateIcon logIcon = new StateIcon() { Icon = (char)Convert.ToInt32("f07c", 16) + string.Empty };MenuItem fitToViewMenuItem = new MenuItem{Header = "主图",ToolTip = "初始化显示,显示主图中心位置",Icon = homeIcon,Command = ChartCommands.FitToView,CommandTarget = target};MenuItem savePictureMenuItem = new MenuItem{Header = "保存",ToolTip = "保存曲线图",Icon = saveIcon,Command = ChartCommands.SaveScreenshot,CommandTarget = target};MenuItem copyPictureMenuItem = new MenuItem{Header = "拷贝",ToolTip = "拷贝,复制",Icon = copyIcon,Command = ChartCommands.CopyScreenshot,CommandTarget = target};result.Items.Add(fitToViewMenuItem);result.Items.Add(copyPictureMenuItem);result.Items.Add(savePictureMenuItem);return result;}private void MainWindow_Loaded(object sender, RoutedEventArgs e){dispatcherTimer.Interval = TimeSpan.FromMilliseconds(100);dispatcherTimer.Tick += (sender1, e1) => Timer_Tick(sender1, e1);dispatcherTimer.IsEnabled = true;}/// <summary>/// 定时器刷新界面数据/// </summary>/// <param name="sender"></param>/// <param name="e"></param>private void Timer_Tick(object sender, EventArgs e){var axis = new HorizontalDateTimeAxis();DateTime dateTime = DateTime.Now;Random random = new Random();double a, b, c;do{a = random.NextDouble() * 10;b = random.NextDouble() * 10;c = random.NextDouble() * 10;}while (a == b || b == c || a == c);Point x = new Point(axis.ConvertToDouble(dateTime), a);xPoint.AppendAsync(this.Dispatcher, x);Point y = new Point(axis.ConvertToDouble(dateTime), b);yPoint.AppendAsync(this.Dispatcher, y);Point z = new Point(axis.ConvertToDouble(dateTime), c);zPoint.AppendAsync(this.Dispatcher, z);}/// <summary>/// 鼠标选中时,X轴和Y轴的值/// </summary>/// <param name="sender"></param>/// <param name="e"></param>private void Plotter_MouseMove(object sender, MouseEventArgs e){try{DateTime dateTime = DateTime.Now;var axis = new HorizontalDateTimeAxis();axis.ConvertToDouble(dateTime);ChartPlotter chart = sender as ChartPlotter;Point point = e.GetPosition(this).ScreenToData(chart.Transform);TimeSpan ts = TimeSpan.FromMilliseconds(Math.Floor(point.X * 1000000));DateTime formattedDate = DateTime.MinValue.Add(ts);this.HeaderTitle.Content = $"速度:{point.Y.ToString("N5")} 时间:{formattedDate:HH:mm:ss,fff}";// 目标时间DateTime targetTime = formattedDate;//var select = this.Data.OrderBy(v => Math.Abs((v.DateTime - targetTime).TotalMilliseconds)).First(); // 获取与目标时间最接近的 Entity// 显示选中 Entity//this.SelectedEntity.Content = select.ToString();}catch (Exception){}}}} - FontView.cs
using System;
using System.Collections.Generic;
using System.ComponentModel;
using System.Linq;
using System.Text;
using System.Threading.Tasks;namespace WpfApp11
{internal class FontView : INotifyPropertyChanged{/// <summary>/// 曲线颜色/// </summary>public string UnColor => "#DCDCDC";public string IsColorX => "#FFFF0000"; //"#009C26";public string IsColorY => "#FF008000"; //"#8080C0";public string IsColorZ => "#FF0000FF"; //"#000000";public FontView(){_colorX = this.IsColorX;_colorY = this.IsColorY;_colorZ = this.IsColorZ;}private string _colorX = string.Empty;private string _colorY = string.Empty;private string _colorZ = string.Empty;public string ColorX{get { return this._colorX; }set{if (this._colorX != value){this._colorX = value;OnPropertyChanged(nameof(ColorX));}}}public string ColorY{get { return this._colorY; }set{if (this._colorY != value){this._colorY = value;OnPropertyChanged(nameof(ColorY));}}}public string ColorZ{get { return this._colorZ; }set{if (this._colorZ != value){this._colorZ = value;OnPropertyChanged(nameof(ColorZ));}}}private string x = "0.000";private string y = "0.000";private string z = "0.000";public string ValueX{get { return this.x; }set{if (this.x != value){this.x = value;OnPropertyChanged(nameof(ValueX));}}}public string ValueY{get { return this.y; }set{if (this.y != value){this.y = value;OnPropertyChanged(nameof(ValueY));}}}public string ValueZ{get { return this.z; }set{if (this.z != value){this.z = value;OnPropertyChanged(nameof(ValueZ));}}}private string node = "000000";private string time = "00:00:00,000";public string Node{get { return this.node; }set{if (this.node != value){this.node = value;OnPropertyChanged(nameof(Node));}}}public string Time{get { return this.time; }set{if (this.time != value){this.time = value;OnPropertyChanged(nameof(Time));}}}public event PropertyChangedEventHandler PropertyChanged;protected virtual void OnPropertyChanged(string propertyName){PropertyChanged?.Invoke(this, new PropertyChangedEventArgs(propertyName));}}
}
以上就是全部代码了 ,创作不易,如果对你有帮助,不如点个赞吧。
附录:
DynamicDataDisplay开源项目源代码:
【CSDN文库 - DynamicDataDisplay】
【GitHub - DynamicDataDisplay】
参考网址:
【DynamicDataDisplay 实时曲线图的使用和沿轴移动的效果 - CSDN博客】
【WPF开发随笔收录-DrawingVisual绘制高性能曲线图 - 流浪g - 博客园】
【WPF中DynamicDataDisplay的使用总结 - 低音弦 - 博客园】
【WPF实时绘制心率曲线 - 源代码实现不使用框架 - 博客园】