当前位置: 首页 > news >正文

How to monitor Spring Boot apps with the AppDynamics Java Agent

本文介绍如何使用 AppDynamics Java 代理监视 Azure Spring Apps 中的 Spring Boot 应用程序。

使用 AppDynamics Java 代理可以:

  • 监视应用程序
  • 使用环境变量配置 AppDynamics Java 代理
  • 在 AppDynamics 仪表板中检查所有监视数据

How to monitor Spring Boot apps with the AppDynamics Java Agent (Preview) - Azure Spring Apps | Microsoft Learn

如何使用 AppDynamics Java 代理(预览版)监视 Spring Boot 应用 - Azure Spring Apps | Microsoft Learn

激活 AppDynamics Java 进程内代理

对于整个工作流,需要:

  • 在 Azure Spring Apps 中激活 AppDynamics Java 进程内代理以生成应用程序指标数据。
  • 将 AppDynamics 代理连接到 AppDynamics 控制器以收集和可视化控制器中的数据。

示意图显示 AppDynamics 代理与 Azure Spring Apps 中的 Spring Boot 应用的双向箭头,以及指向 AppDynamics 代理的箭头。


Activate the AppDynamics Java in-process agent

For the whole workflow, you need to:

  • Activate the AppDynamics Java in-process agent in Azure Spring Apps to generate application metrics data.
  • Connect the AppDynamics Agent to the AppDynamics Controller to collect and visualize the data in the controller.

Diagram that shows AppDynamics Agent with two-way arrow to Spring Boot Apps in Azure Spring Apps and arrow pointing to AppDynamics Agent.

查看 AppDynamics 仪表板中的报表

本部分显示 AppDynamics 中的各种报表。

以下屏幕截图显示 AppDynamics 仪表板中的应用概述:

AppDynamics 的屏幕截图,显示“应用程序”仪表板。

“应用程序”选项卡显示每个应用的整体信息,如以下使用示例应用程序的屏幕截图所示:

  • api-gateway

    AppDynamics 的屏幕截图,显示了示例 api-gateway 应用的“应用程序”仪表板。

  • customers-service

    AppDynamics 的屏幕截图,显示了示例 customers-service 应用的“应用程序”仪表板。

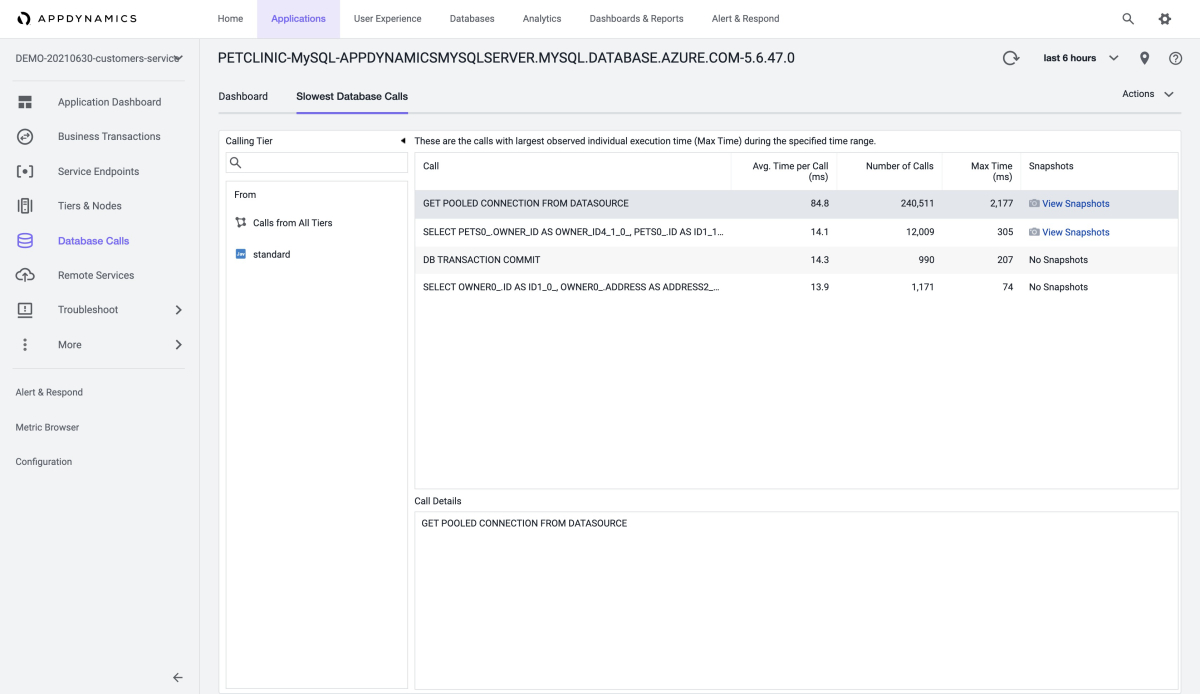
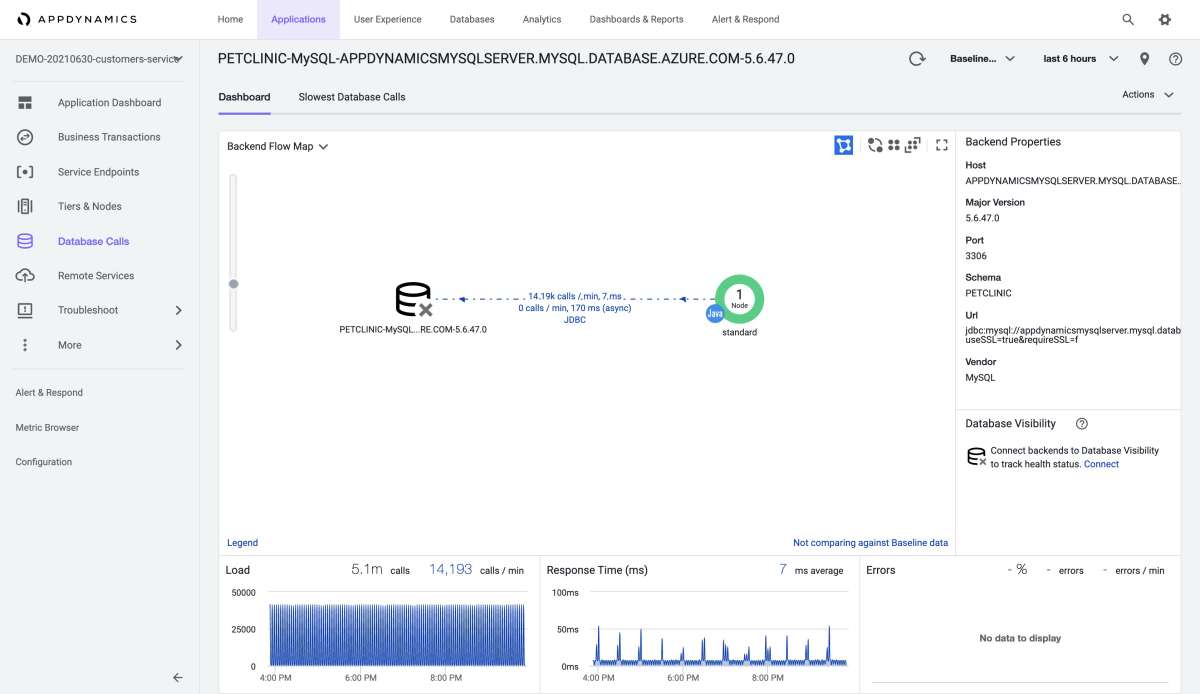
以下屏幕截图显示如何能够从“数据库调用”仪表板获取基本信息。

AppDynamics 的屏幕截图,显示“数据库调用”仪表板。

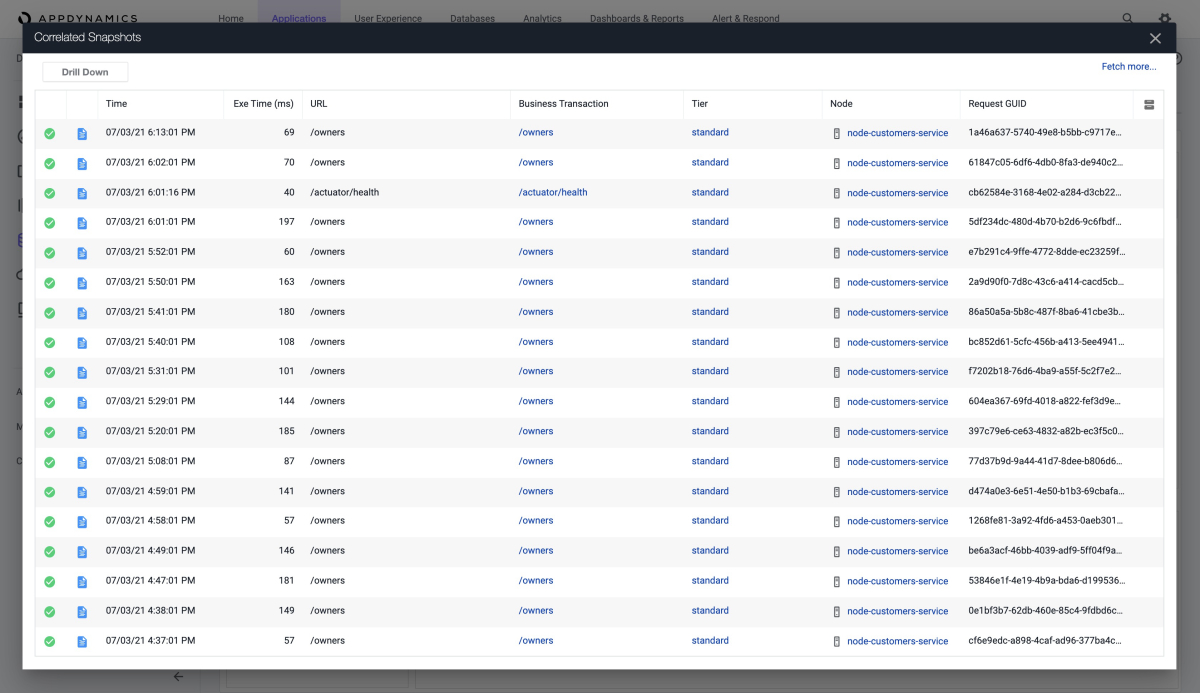
还可以获取有关最慢的数据库调用的信息,如以下屏幕截图所示:

AppDynamics 的屏幕截图,显示“最慢数据库调用”页。

AppDynamics 的屏幕截图,显示了从“最慢数据库调用”页访问的“相关快照”页。

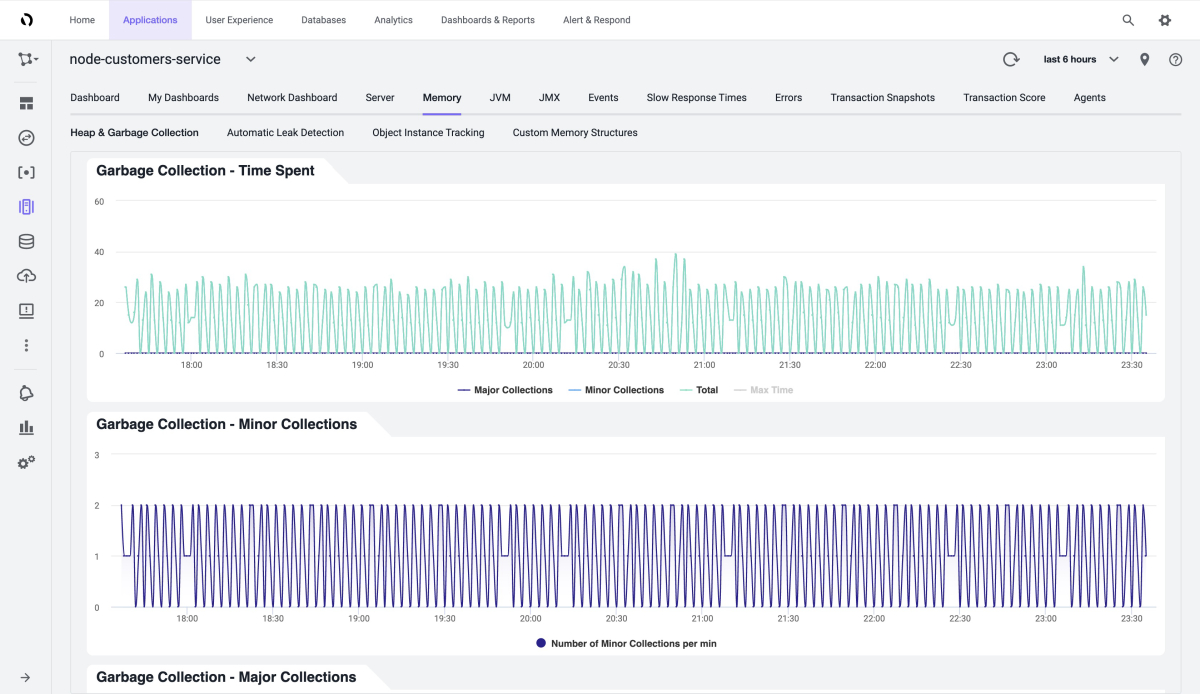
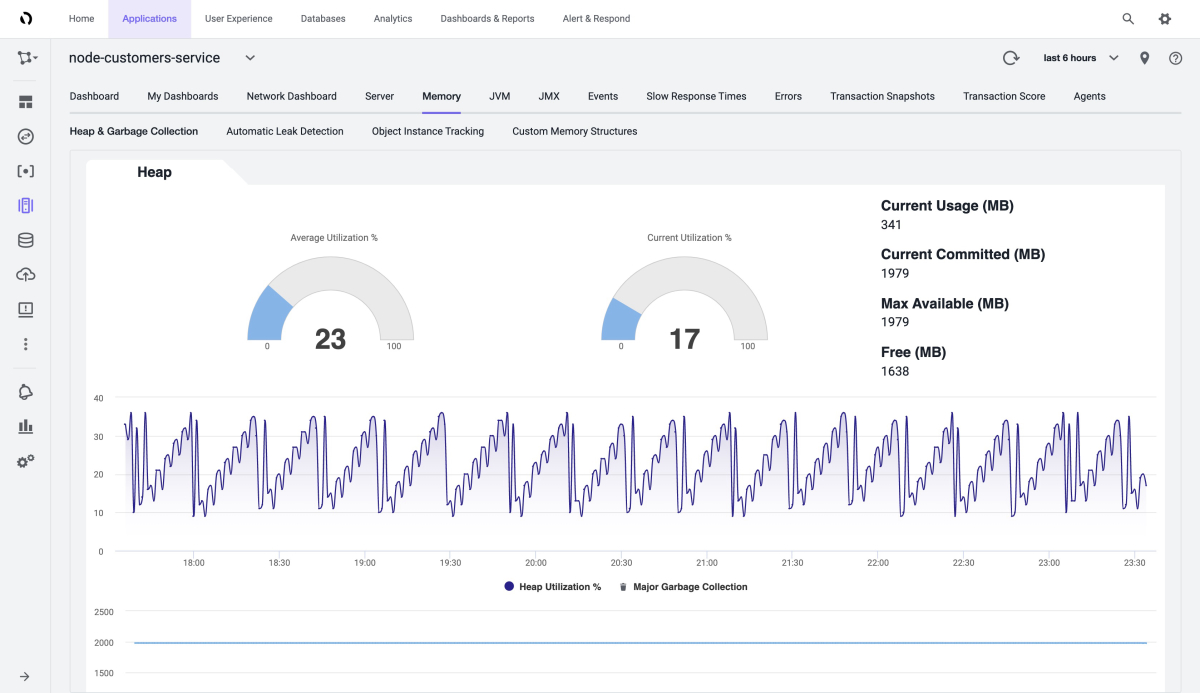
以下屏幕截图显示“内存”页的“堆”部分中的内存使用情况分析:

AppDynamics 的屏幕截图,显示“内存”页的“堆”部分。

还可以查看垃圾回收过程,如以下屏幕截图所示:
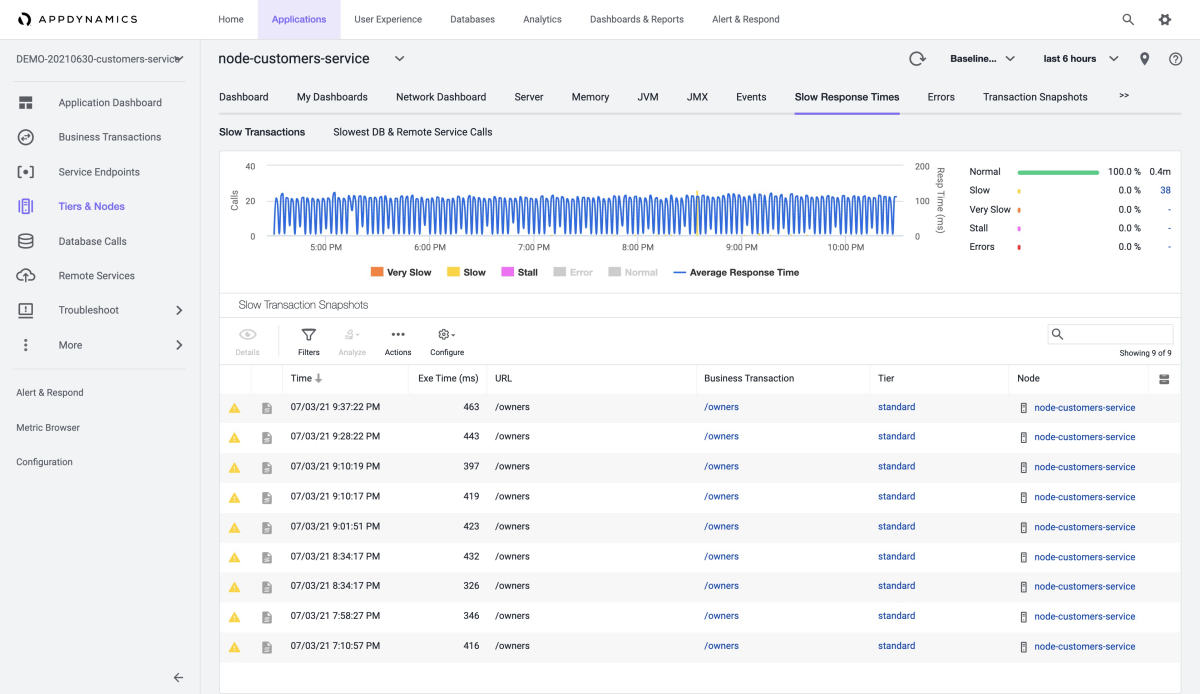
AppDynamics 的屏幕截图,显示“内存”页的“垃圾回收”部分。

以下屏幕截图显示“速度缓慢的事务”页:

AppDynamics 的屏幕截图,显示“慢速事务”页。

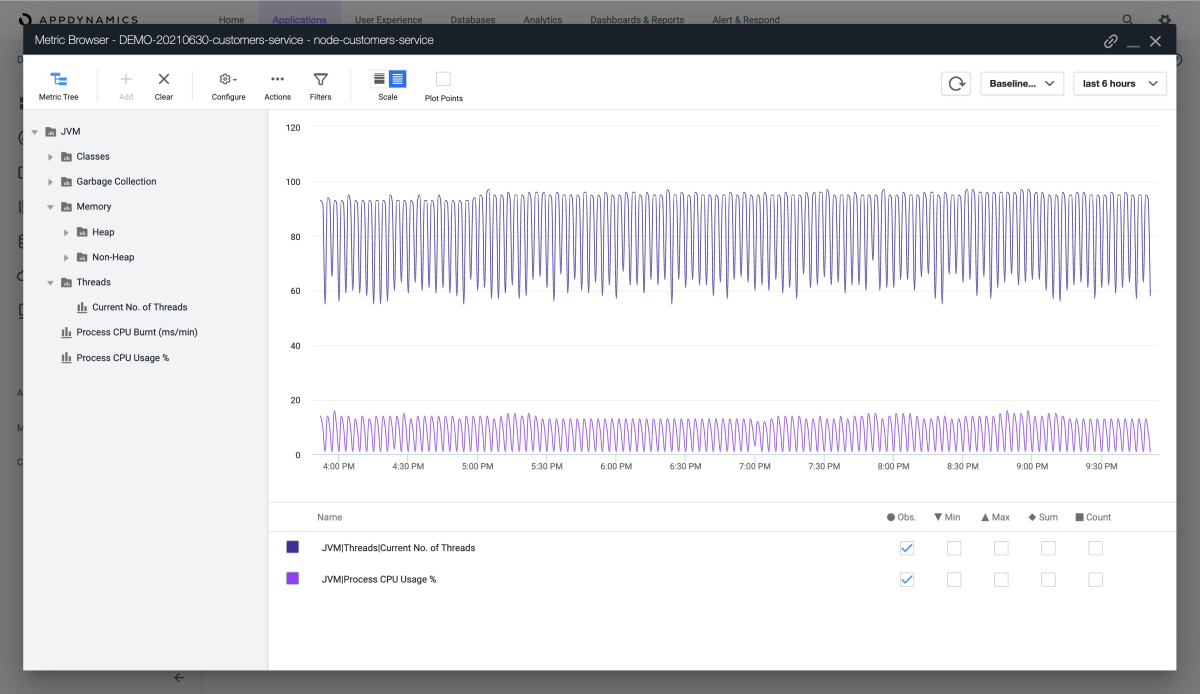
可以为 JVM 定义更多指标,如以下“指标浏览器”屏幕截图所示:

AppDynamics 的屏幕截图,显示“指标浏览器”。

查看 AppDynamics 代理日志

默认情况下,Azure Spring Apps 将 AppDynamics 代理的信息级日志输出到 STDOUT。 这些日志将与应用程序日志混合。 可以从应用程序日志中找到显式代理版本。

也可以从以下位置获取 AppDynamics 代理的日志:

  • Azure Spring Apps 日志
  • Azure Spring Apps Application Insights
  • Azure Spring Apps LogStream

了解 AppDynamics 代理升级

AppDynamics 代理定期(每季度)与 JDK 一起升级。 代理升级可能会影响以下场景:

  • 升级前使用 AppDynamics 代理的现有应用程序保持不变,但需要重启或重新部署才能正常使用新版 AppDynamics 代理。
  • 升级后创建的应用程序使用新版 AppDynamics 代理。

Review reports in the AppDynamics dashboard

This section shows various reports in AppDynamics.

The following screenshot shows an overview of your apps in the AppDynamics dashboard:

Screenshot of AppDynamics that shows the Applications dashboard.

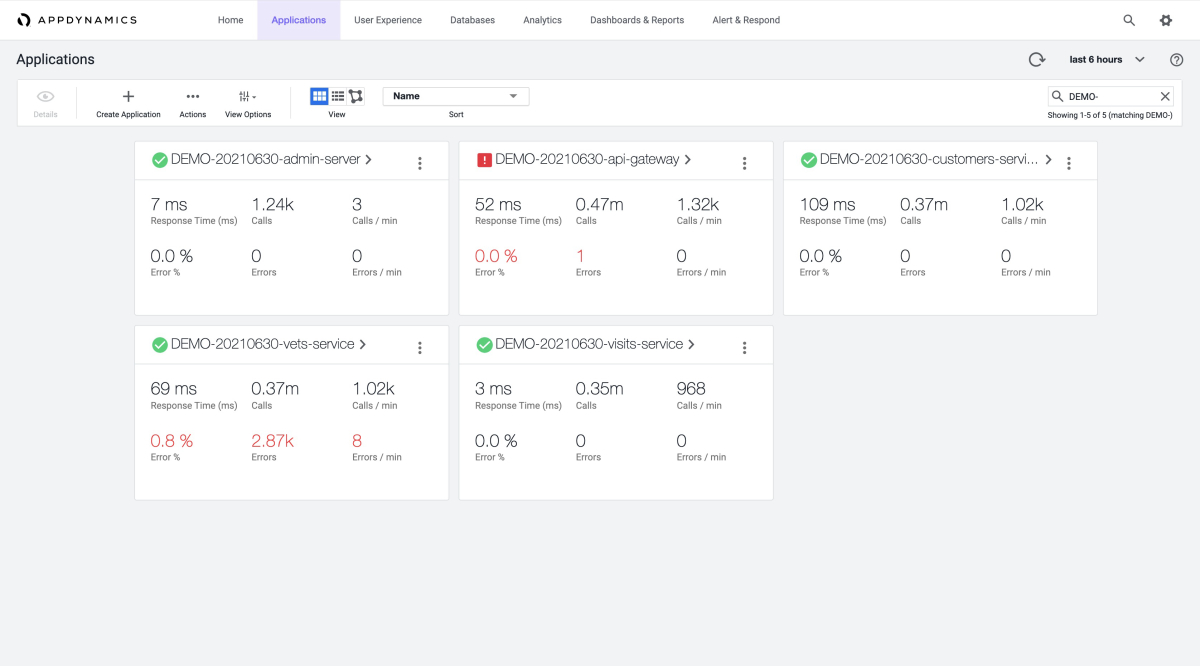
The Applications tab shows the overall information for each of your apps, as shown in the following screenshots using example applications:

  • api-gateway

    Screenshot of AppDynamics that shows the Application dashboard for the example api-gateway app.

  • customers-service

    Screenshot of AppDynamics that shows the Application dashboard for the example customers-service app.

The following screenshot shows how you can get basic information from the Database Calls dashboard.

Screenshot of AppDynamics that shows the Database Calls dashboard.

You can also get information about the slowest database calls, as shown in these screenshots:

Screenshot of AppDynamics that shows the Slowest Database Calls page.

Screenshot of AppDynamics that shows the Correlated Snapshots page accessed from the Slowest Database Calls page.

The following screenshot shows memory usage analysis in the Heap section of the Memory page:

Screenshot of AppDynamics that shows the Heap section of the Memory page.

You can also see the garbage collection process, as shown in this screenshot:

Screenshot of AppDynamics that shows the Garbage Collection section of the Memory page.

The following screenshot shows the Slow Transactions page:

Screenshot of AppDynamics that shows the Slow Transactions page.

You can define more metrics for the JVM, as shown in this screenshot of the Metric Browser:

Screenshot of AppDynamics that shows the Metric Browser.


http://www.lryc.cn/news/495592.html

相关文章:

  • Linux学习笔记12 systemd的其他命令
  • NGO-CNN-BiGRU-Attention北方苍鹰算法优化卷积双向门控循环单元时间序列预测,含优化前后对比
  • 【分布式】分布式缓存
  • 深度学习中的迁移学习:应用与实践
  • 28.UE5实现对话系统
  • Redis中的分布式锁(步步为营)
  • CentOS 7安装mysql+JDK+Tomcat完成流程
  • C++笔记之不同框架中事件循环的核心函数:io_run()、ros_spin()、app_exec()
  • C++异常处理
  • 【数据结构】哈希 ---万字详解
  • 4399大数据面试题及参考答案(数据分析和数据开发)
  • 快速理解倒排索引在ElasticSearch中的作用
  • C++趣味编程玩转物联网:基于树莓派Pico控制无源蜂鸣器-实现音符与旋律的结合
  • 《RuoYi基于SpringBoot+Vue前后端分离的Java快速开发框架学习》系列博客_Part4_三模态融合
  • springboot365高校疫情防控web系统(论文+源码)_kaic
  • STM32 USART串口数据包
  • 【LC】3232. 判断是否可以赢得数字游戏
  • Linux基础学习--vi与vim
  • JavaScript 高级教程:异步编程、面向对象与性能优化
  • qt QToolBox详解
  • 翁知宜荣获“易学名师”与“国学文化传承人”称号
  • 20241128解决Ubuntu20.04安装libwxgtk3.0-dev异常的问题
  • sql分类
  • stm32里一个定时器可以提供多路信号吗?
  • Java安全—原生反序列化重写方法链条分析触发类
  • 2023考研王道计算机408数据结构+操作系统+计算机组成原理+计算机网络
  • YOLOv8-ultralytics-8.2.103部分代码阅读笔记-files.py
  • 「Mac畅玩鸿蒙与硬件34」UI互动应用篇11 - 颜色选择器
  • ELK(Elasticsearch + logstash + kibana + Filebeat + Kafka + Zookeeper)日志分析系统
  • 07.ES11 08.ES12