linux perf 环境部署和基本测试(基于Ubuntu20.04)
1,linux 安装perf
sudo apt-ge install linux-tools-common
sudo apt-get install linux-tools-$(uname -r) linux-tools-generic -y
2 补充安装
sudo apt-get install python3-q-text-as-data
3,perf常用命令
lark@ubuntu:~$ perf
usage: perf [--version] [--help] [OPTIONS] COMMAND [ARGS]
The most commonly used perf commands are:
annotate Read perf.data (created by perf record) and display annotated code
archive Create archive with object files with build-ids found in perf.data file
bench General framework for benchmark suites
buildid-cache Manage build-id cache.
buildid-list List the buildids in a perf.data file
c2c Shared Data C2C/HITM Analyzer.
config Get and set variables in a configuration file.
daemon Run record sessions on background
data Data file related processing
diff Read perf.data files and display the differential profile
evlist List the event names in a perf.data file
ftrace simple wrapper for kernel's ftrace functionality
inject Filter to augment the events stream with additional information
iostat Show I/O performance metrics
kallsyms Searches running kernel for symbols
kmem Tool to trace/measure kernel memory properties
kvm Tool to trace/measure kvm guest os
list List all symbolic event types
lock Analyze lock events
mem Profile memory accesses
record Run a command and record its profile into perf.data
report Read perf.data (created by perf record) and display the profile
sched Tool to trace/measure scheduler properties (latencies)
script Read perf.data (created by perf record) and display trace output
stat Run a command and gather performance counter statistics
test Runs sanity tests.
timechart Tool to visualize total system behavior during a workload
top System profiling tool.
version display the version of perf binary
probe Define new dynamic tracepoints
trace strace inspired toolSee 'perf help COMMAND' for more information on a specific command.
举例代码main.c
#include <stdio.h>
#include <stdlib.h>void long_test()
{int i, j;while(1){;}
}void foo2()
{int i;for (i = 0; i < 100; i++) long_test();
}void foo1()
{int i;for (i = 0; i < 1000; i++) long_test();
}int main(void) {foo1();foo2();
}
编译:
gcc main.c -o main运行 :./main
4, perf top命令 实时查看进程CPU和调用堆栈
lark@ubuntu:~$ sudo perf top -a

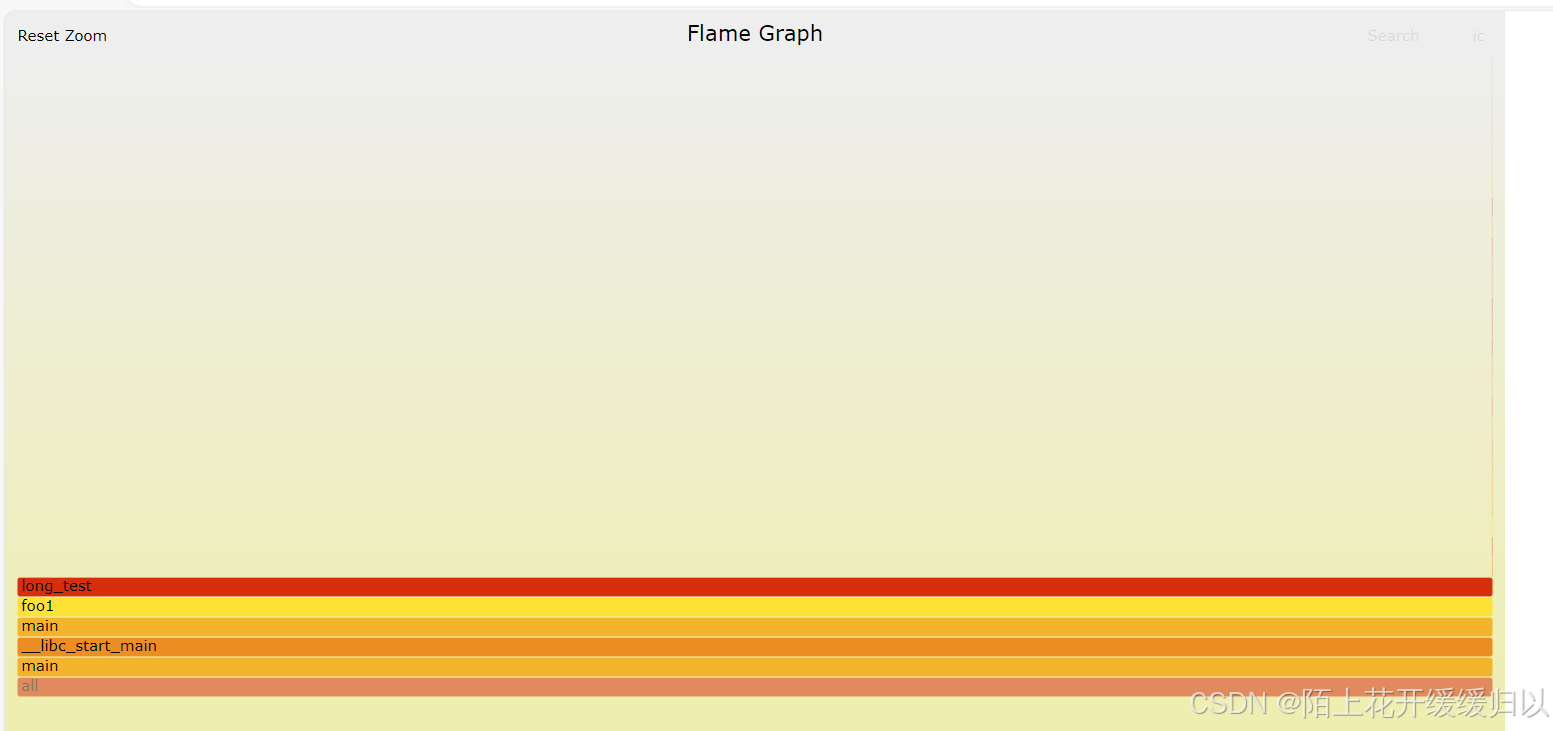
5,构建火焰图
下载库安装
git clone https://github.com/brendangregg/FlameGraph.git
执行文件生成火焰图
ps -axf | grep main
sudo perf record -p 2915  -g -- sleep 10 //采样10s//采样的数据画成火焰图
sudo perf script -i perf.data &> perf.unfold
sudo ./FlameGraph/stackcollapse-perf.pl perf.unfold &> perf.folded
sudo ./FlameGraph/flamegraph.pl perf.folded > perf.svg
google浏览器打开 火焰图。
perf record 命令可以统计每个调用栈出现的百分比
lark@ubuntu:~/test$ sudo perf report -n --stdio
# To display the perf.data header info, please use --header/--header-only options.
#
#
# Total Lost Samples: 0
#
# Samples: 20K of event 'cpu-clock:pppH'
# Event count (approx.): 5069000000
#
# Children Self Samples Command Shared Object Symbol
# ........ ........ ............ ....... ................. ...................................
#
100.00% 0.00% 0 main libc-2.31.so [.] __libc_start_main
|
---__libc_start_main
main
foo1
long_test100.00% 0.00% 0 main main [.] main
|
---main
foo1
上面可以看到main->foo1的栈占用率 100%。