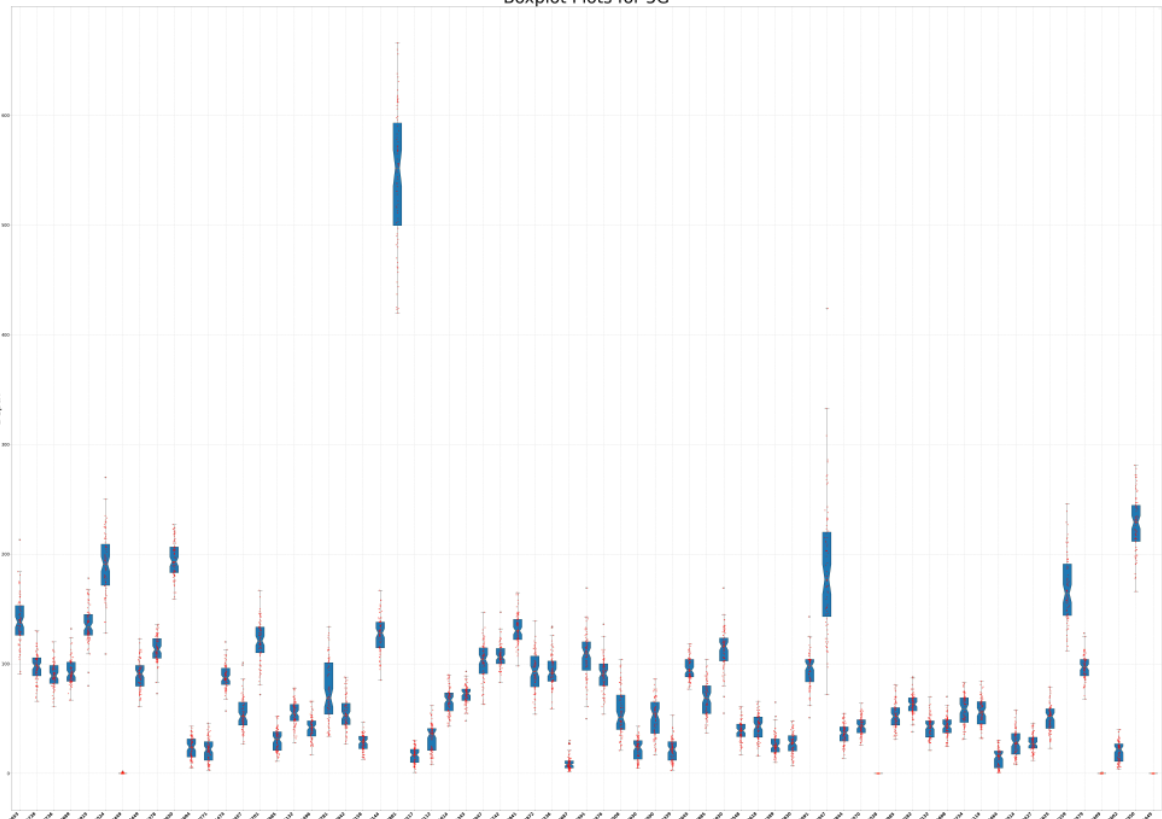
boxplot 绘制箱线图,添加数据点
先看效果图
import matplotlib.pyplot as plt
#! 解决不显示的问题:中文设置为宋体格式
plt.rcParams['font.family'] = ["Times New Roman", 'SimSun']def plot_boxplot(data_list, out_file, x_custom_labels):# 画图fig, ax = plt.subplots(figsize=(90, 60))ax.boxplot(data_list,notch=True,vert=True, patch_artist=True)# 添加数据点for i, d in enumerate(data_list):y = dx = np.random.normal(i+1, 0.04, len(y))ax.plot(x, y, 'r.', alpha=0.5, markersize=10)#刻度值字体大小设置(x轴和y轴同时设置)plt.tick_params(labelsize=20)# 自定义 X 轴标签ax.set_xticklabels(x_custom_labels, rotation=45, ha='right', fontweight='bold')plt.xticks(fontweight='bold' )# 添加网格线ax.yaxis.grid(True, linestyle='--', which='major', color='grey', alpha=.45)ax.xaxis.grid(True, linestyle='--', which='major', color='grey', alpha=.45)plt.title(f'Boxplot Plots for {down_lvl}G', fontsize=80)plt.xlabel('Site', fontsize=50)plt.ylabel('Depth', fontsize=50)plt.legend()# # 调整子图间距plt.tight_layout()# 显示图形plt.show()plt.savefig(out_file)