python | x-y 网格切片
写在前面
通常, 我们处理的毕竟完善的nc产品,一般呈现未timexlatxlon的维度,且lon和lat都是规则的网格,我们可以方便的使用xarray.sel()选择合适的区域进行切片。但是,部分nc产品比如卫星轨道或者模式输出的数据,可能并没有处理为规则的网格产品,其经纬度信息以x和y表示了分辨率对应的网格格点数量。
如下面这种情况:
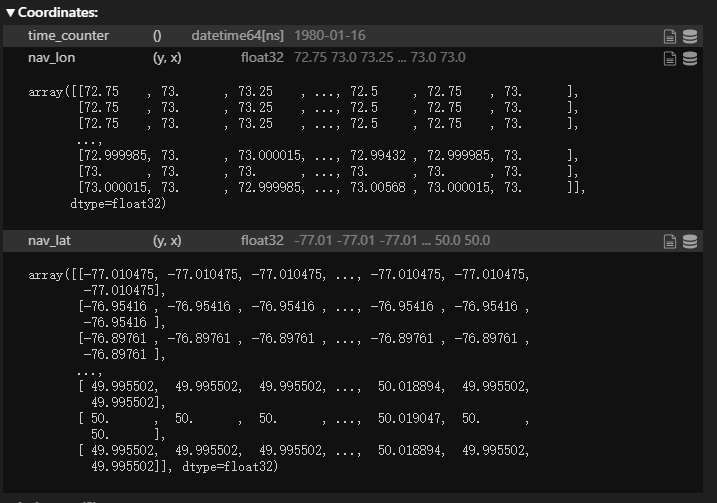
那么,在这种分布下,如何进行区域的切片呢。
python – 索引切片
对于上面这种网格,可以理解为由经纬度meshgrid后生成的还算是规则的网格。我们可以通过索引的方式取出对应的区域的数据。
这里主要用到numpy.where()的方法
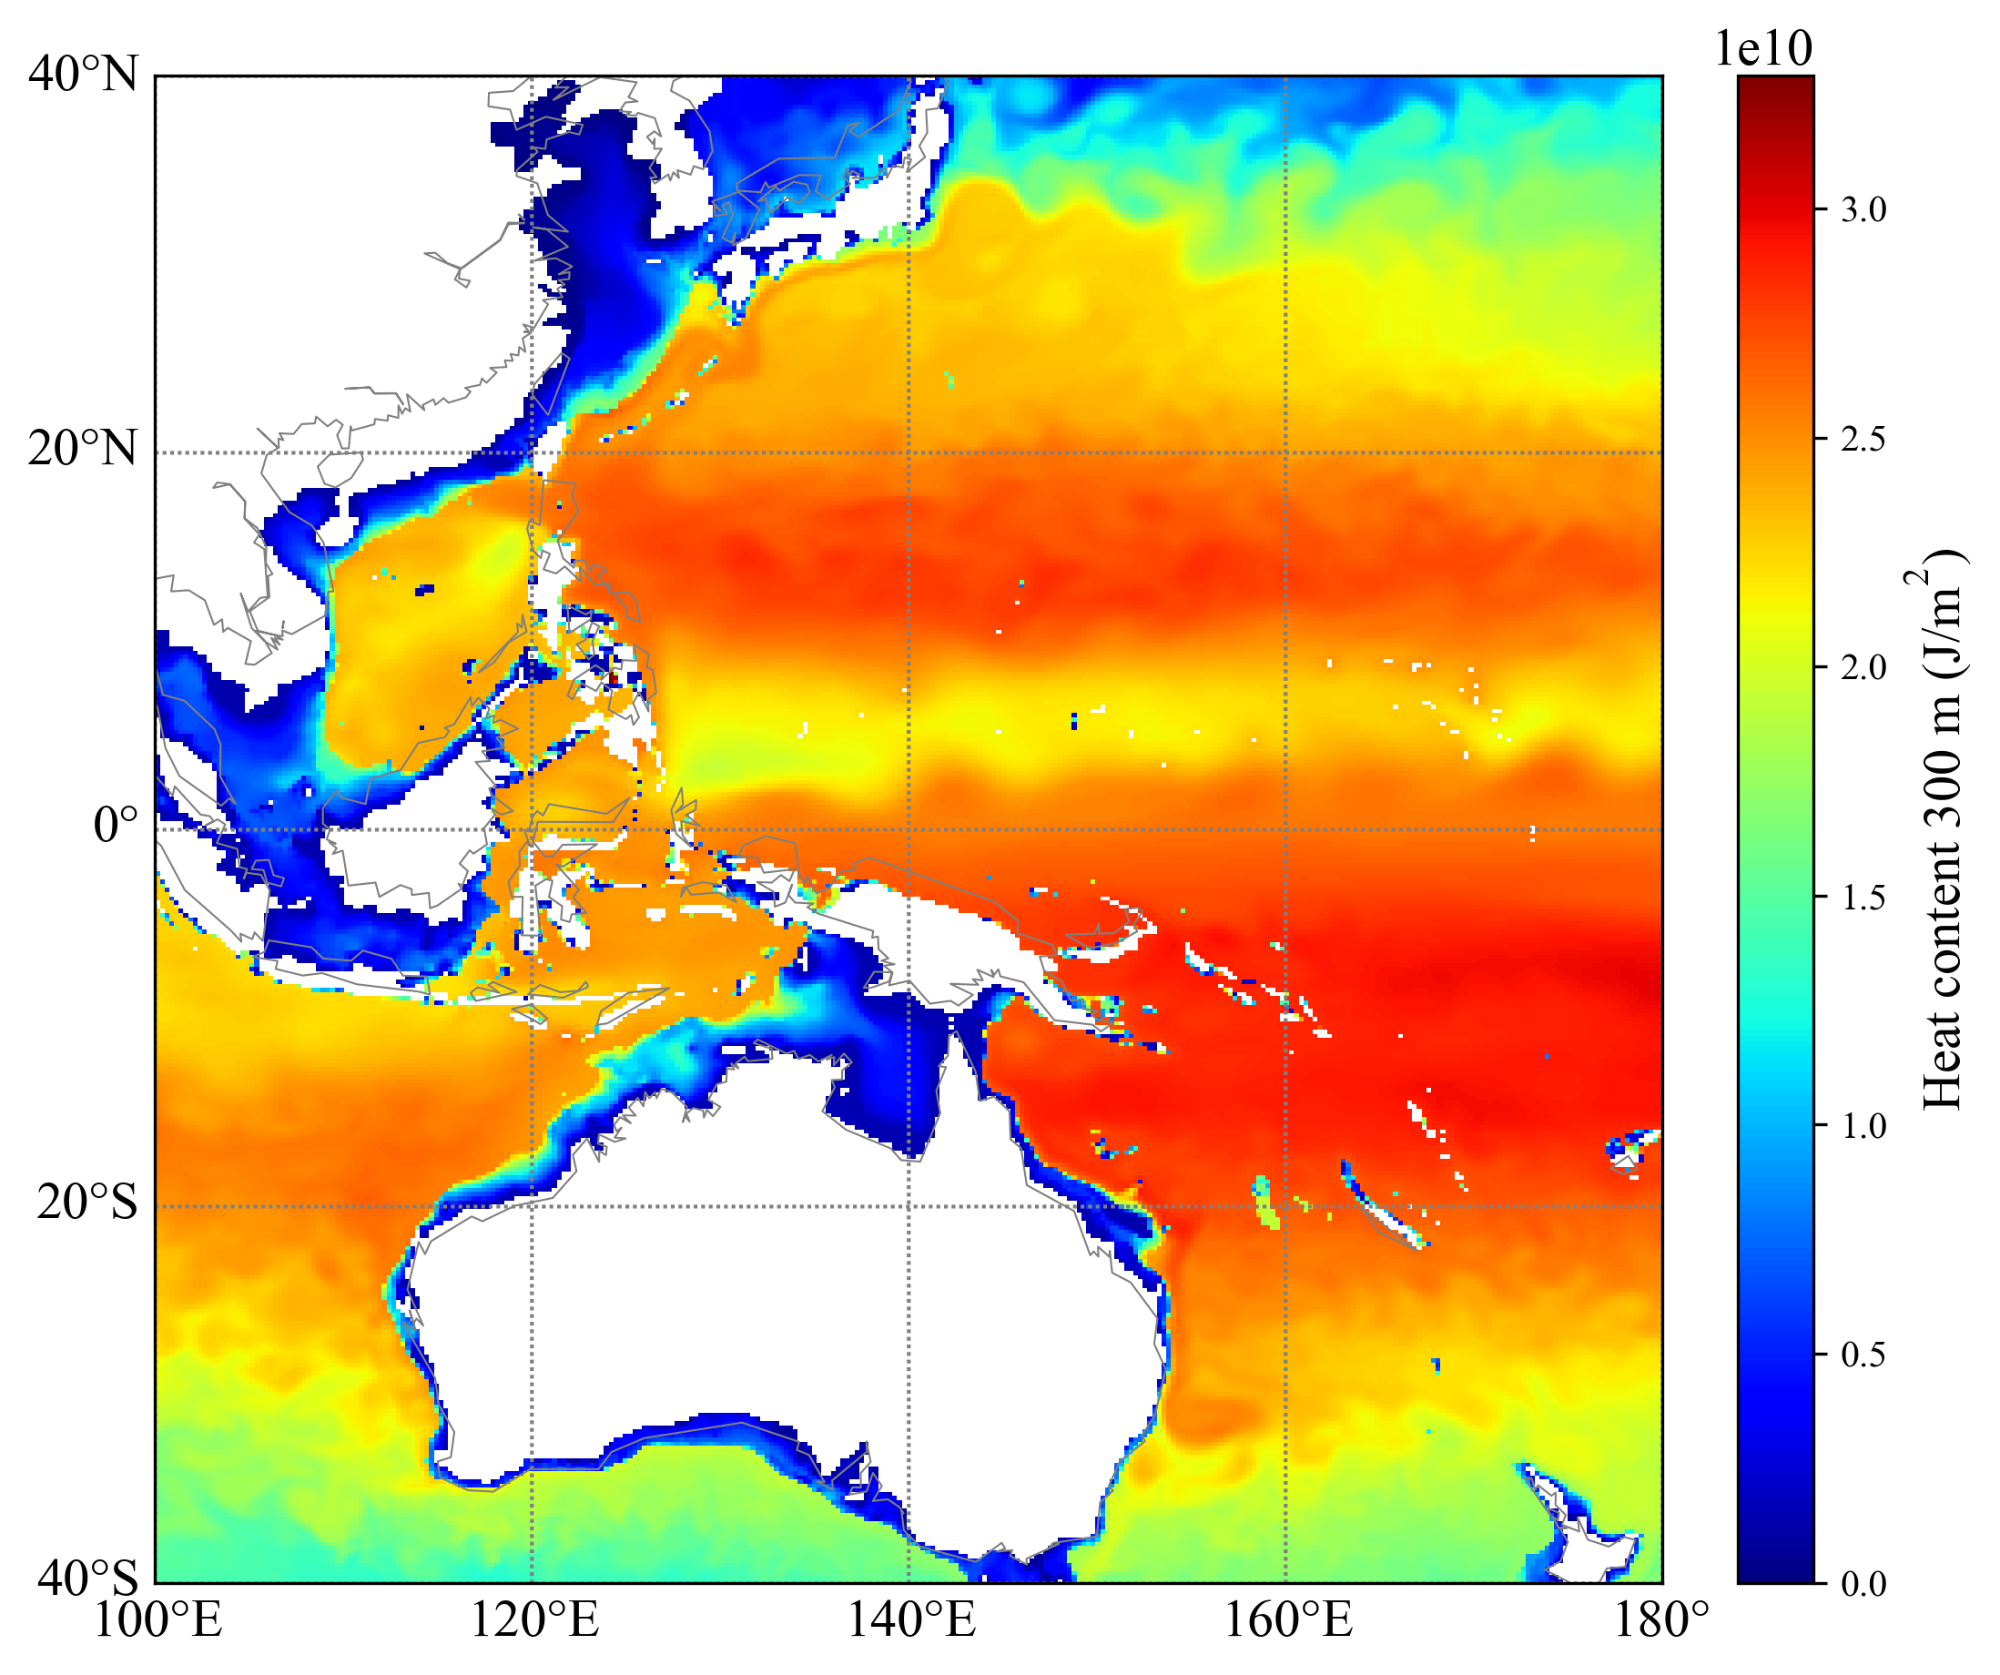
比如说我想要要截取数据范围为:Area = [100, 180, -40, 40] ,前两个表示经度范围,后两个表示纬度
找到在上述经纬度范围内对应的x-y的索引所在的数值,然后将数据提取出来
import matplotlib.ticker as ticker
import xarray as xr
import matplotlib.pyplot as plt
import numpy as np
from matplotlib import colors
import pandas as pd
from matplotlib import gridspec
from matplotlib.colors import ListedColormap
import matplotlib.cm as cm
import matplotlib.colors as mcolors
import os
import glob
from datetime import datetime, timedelta
import cmaps
from cartopy.mpl.ticker import LongitudeFormatter, LatitudeFormatter
import cftime
import cartopy.crs as ccrs
import cartopy.feature as cfeature
import matplotlib.patches as patches
from mpl_toolkits.basemap import Basemappath = r'I:/heat.nc'
data = xr.open_dataset(path)
print(data)lat   = data.nav_lat.data
lon   = data.nav_lon.data
data  = data.sohtc300[0]def slice_region(Area,data,lat,lon):# 查找经纬度范围内的数据点的索引rows_cols = np.where( (lat > Area[2]) & (lat< Area[3]) & (lon > Area[0]) & (lon< Area[1]) ) print(rows_cols)r1 = np.min(rows_cols[0][:]); r2 = np.max(rows_cols[0][:])  c1 = np.min(rows_cols[1][:]); c2 = np.max(rows_cols[1][:])lats  = lat[r1:r2+1, c1:c2+1]  lons  = lon[r1:r2+1, c1:c2+1]  data_s = data[r1:r2+1, c1:c2+1]plt.figure(dpi=200)data_s.plot()return lats,lons,data_s
绘图验证
lats,lons,data_s = slice_region(Area, data, lat, lon)plt.rcParams['font.family'] = 'Times New Roman'
plt.rcParams['font.size'] = 14fig, ax = plt.subplots(figsize=(8,6), dpi=300)
cmap = "jet"# 绘制底图
map = Basemap(projection='cyl', lon_0=0, llcrnrlon=Area[0], llcrnrlat=Area[2], urcrnrlon=Area[1], urcrnrlat=Area[3])
map.drawcoastlines(color='grey', linewidth=0.5)
map.drawparallels(np.linspace(Area[2], Area[3], 5), labels=[1, 0, 0, 0], color='grey')
map.drawmeridians(np.linspace(Area[0], Area[1], 5), labels=[0, 0, 0, 1], color='grey')
mp = map.pcolor(lons, lats, data_s, cmap=cmap, shading='auto')# 添加colorbar
cbar = map.colorbar(mp, location='right', pad="5%")
cbar.set_label('Heat content 300 m (J/m$^2$)')
cbar.ax.yaxis.set_tick_params(labelsize=10)  # 设置colorbar刻度标签的字体大小# 增加颜色棒、构图调整
fig.subplots_adjust(top=0.98, bottom=0.06, left=0.1, right=0.88)
plt.show()
总结
在python中实现对于x-y网格的区域截取,相关数据和代码放到了GitHub上,感兴趣的朋友可以试试
GitHub: https://github.com/Blissful-Jasper/jianpu_record