vscode配置xdebug断点调试详细教程
注:环境为本地windows开发环境,编辑器为vscode,PHP集成环境工具为EServer
vscode安装扩展并配置
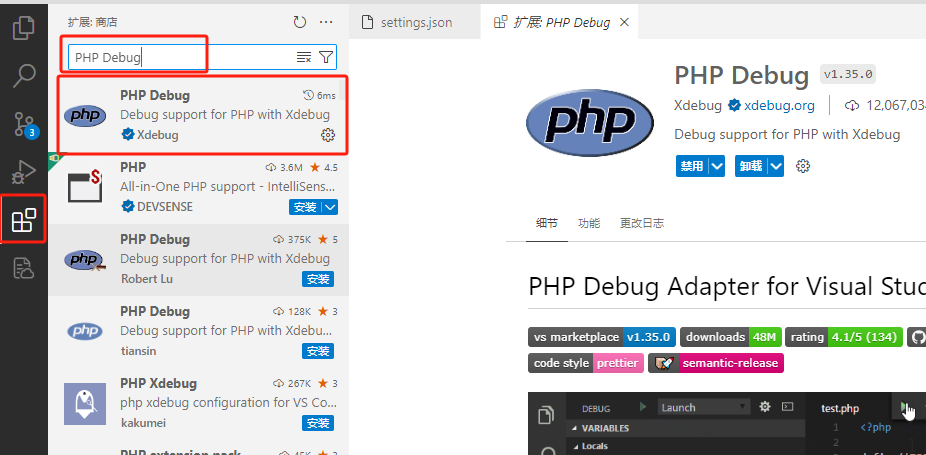
安装PHP Debug
扩展中搜索 PHP Debug 并安装:
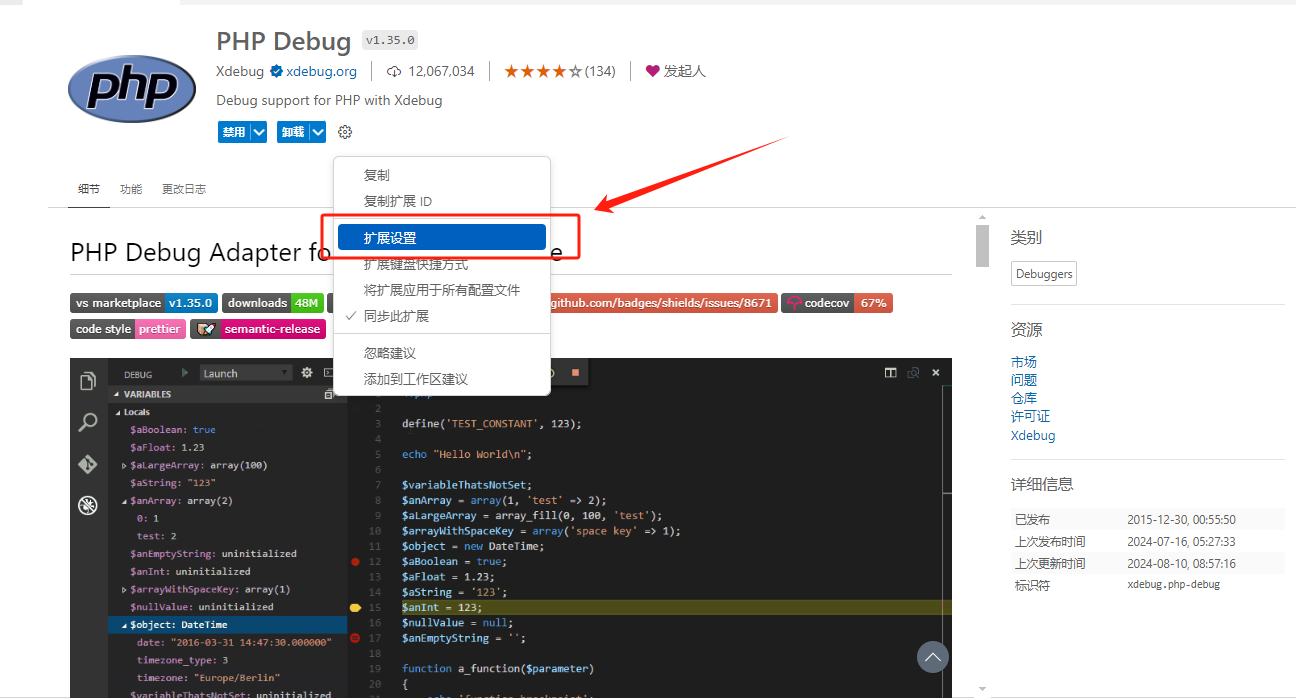
配置PHP Debug
1、点击扩展设置
2、在设置中,点击 setting.json
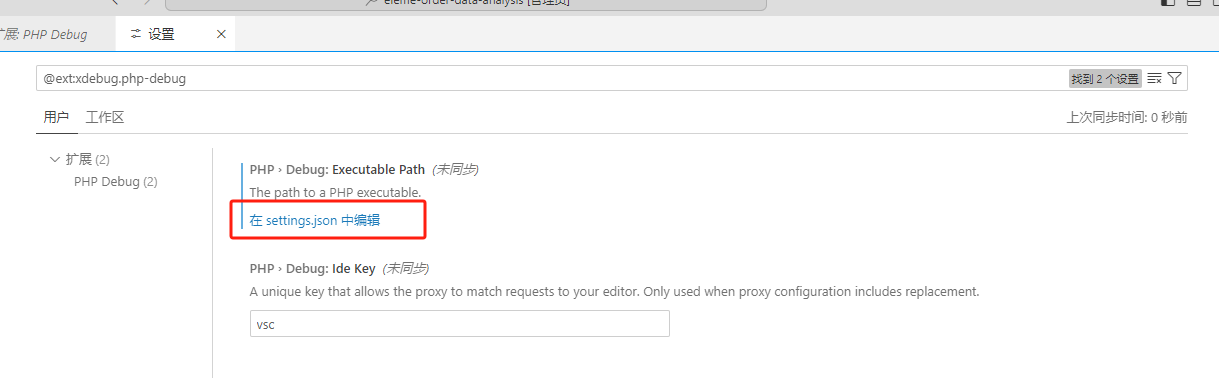
3、编辑 setting.json ,主要配置下 php.validate.executablePath 和 php.debug.executablePath ,配置为你本地 php 目录,以下是完整内容:
请注意端口,要与后面的 php.ini 中的端口相同,例如在该配置中 port 为9003,php.ini 中设置也要为9003
{"php.validate.executablePath": "E:\\EServer\\core\\software\\php\\php-7.4\\php.exe", // 不要直接cody,需要配置为你本地php目录"php.executablePath": "E:\\EServer\\core\\software\\php\\php-7.4\\php.exe", // 不要直接cody,需要配置为你本地php目录"workbench.colorTheme": "Visual Studio Light","editor.fontSize": 18,"window.zoomLevel": 1,"git.suggestSmartCommit": false,"workbench.iconTheme": "vs-minimal","intelephense.phpdoc.classTemplate": {"summary": "$1","tags": ["@package ${1:$SYMBOL_NAMESPACE}"]},"editor.wordSeparators": "`~!@#%^&*()-=+[{]}\\|;:'\",.<>/?","php.debug.executablePath": "E:\\EServer\\core\\software\\php\\php-7.4\\php.exe", // 不要直接cody,需要配置为你本地 php 目录"launch": {"configurations": [{"name": "Listen for XDebug","type": "php","request": "launch","port": 9003},{"name": "Launch currently open script","type": "php","request": "launch","program": "${file}","cwd": "${fileDirname}","port": 9003}],"compounds": []}
}
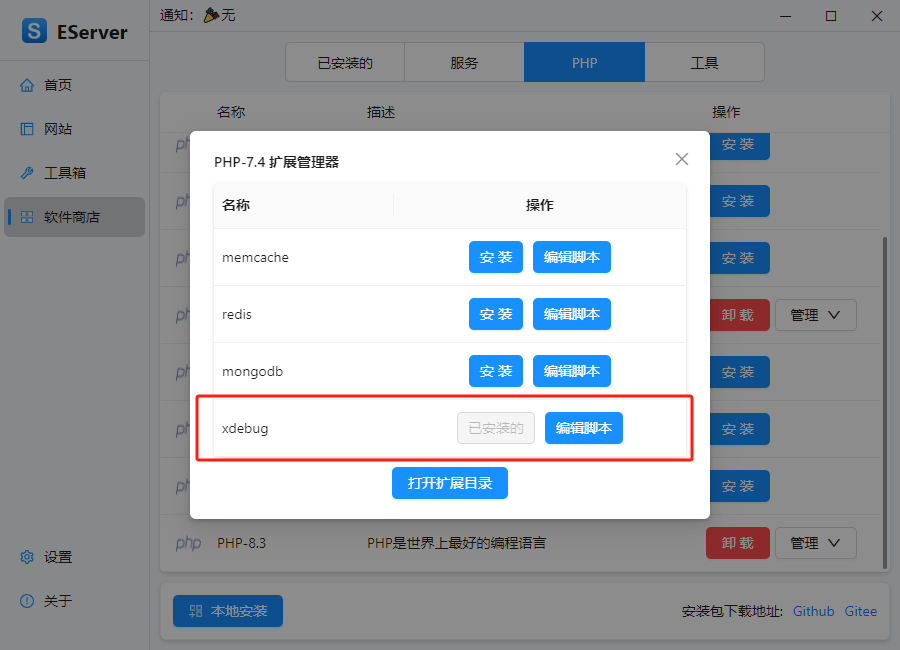
安装xdebug并配置
我这里使用的工具为 EServer ,其他工具请自行搜索安装 xdebug ,以下为 EServer 的扩展安装方法:
找到 xdebug 扩展直接点击安装即可
安装完成后,打开对应php版本的 php.ini 文件:
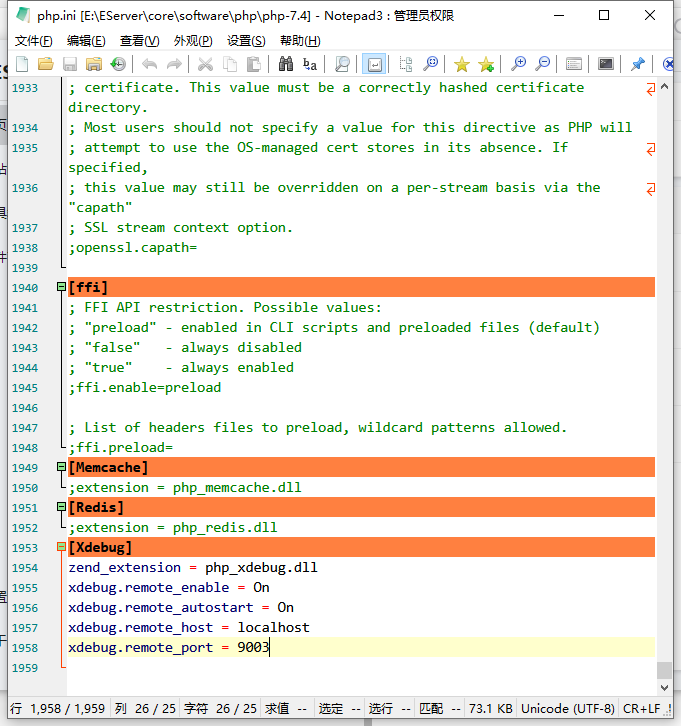
配置php.ini:
[Xdebug]
zend_extension = php_xdebug.dll
xdebug.remote_enable = On
xdebug.remote_autostart = On // 需要新增该配置
xdebug.remote_host = localhost
xdebug.remote_port = 9003 // 注意端口号要与前面xdebug中的配置相同
完成
添加断点,并按 F5 开启debug:
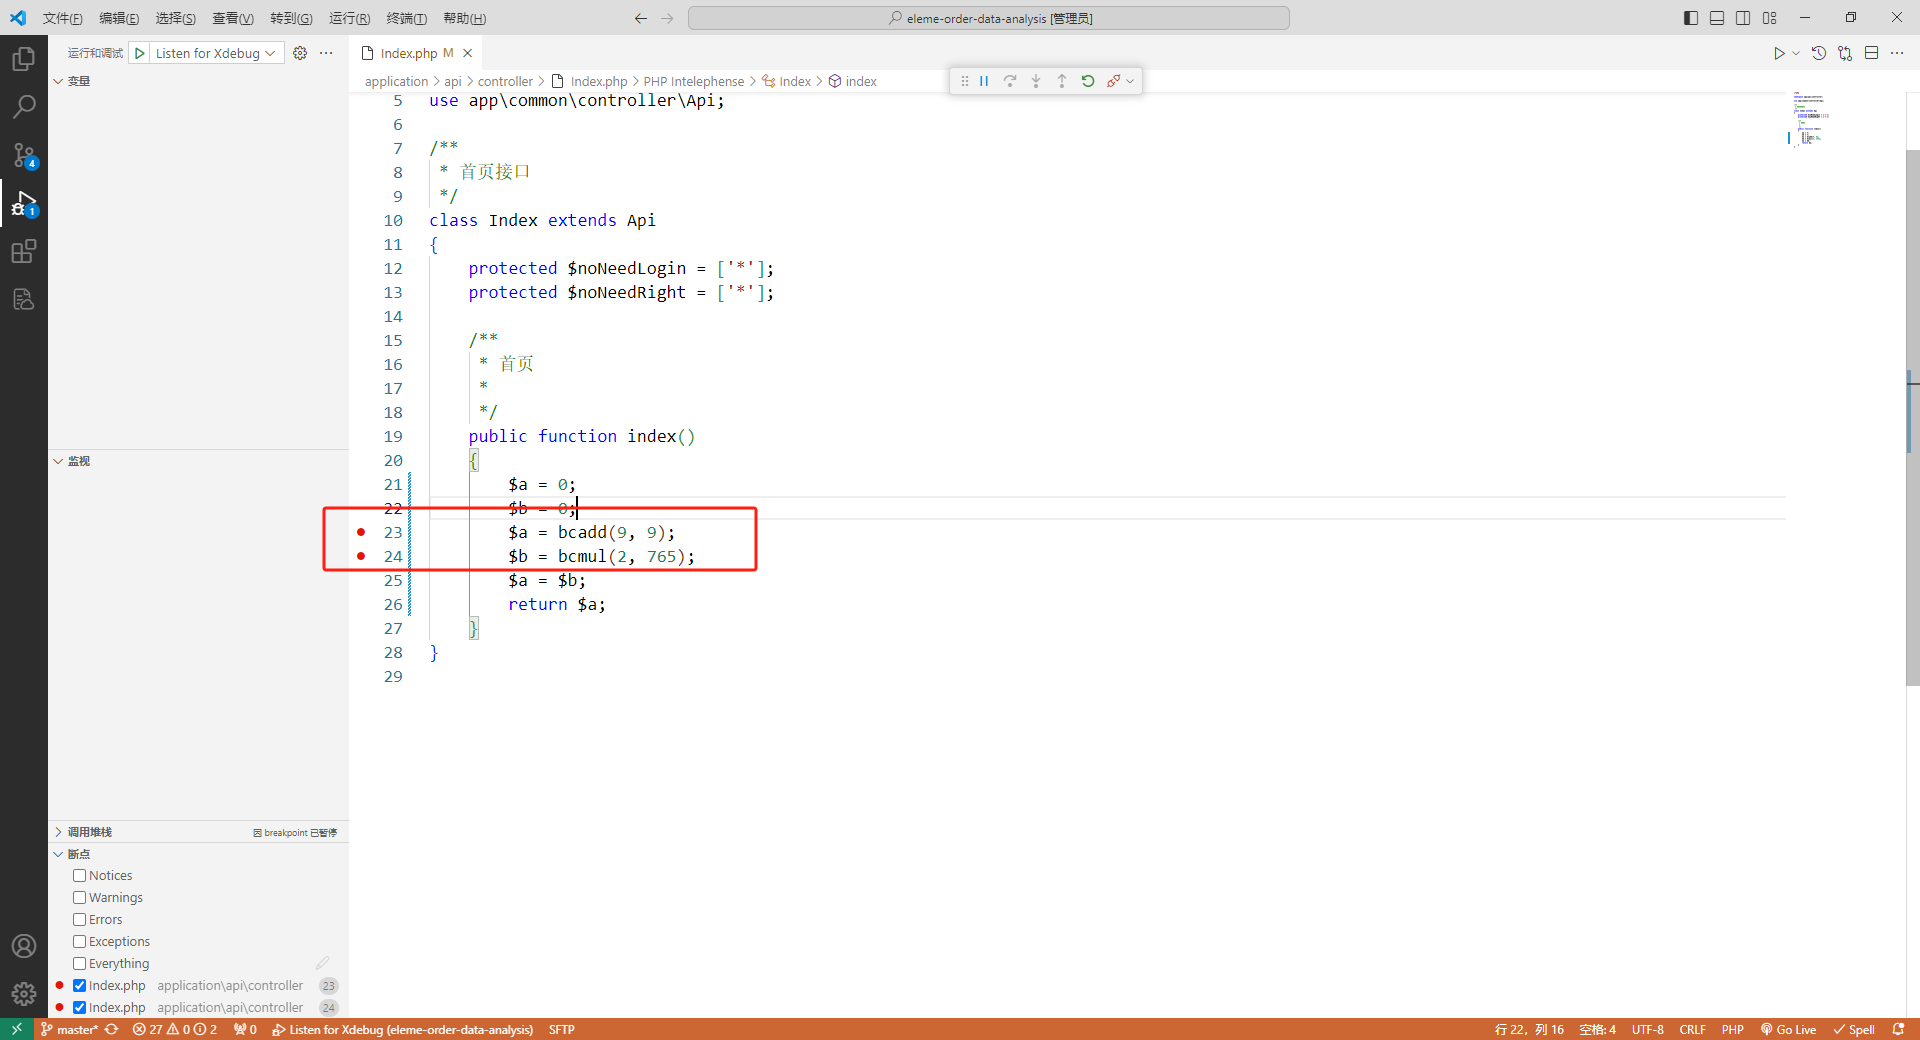
访问 url ,即可看到断点内容了。