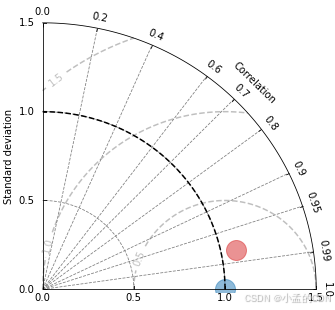
matplotlib绘制泰勒雷达图
import matplotlib.pyplot as plt
import numpy as np
from numpy.core.fromnumeric import shape
import pandas as pd
import dask.dataframe as dd
from matplotlib.projections import PolarAxes
import mpl_toolkits.axisartist.floating_axes as FA
import mpl_toolkits.axisartist.grid_finder as GF
from matplotlib.transforms import Affine2Dclass TaylorDiagram:"""ref: pandas.DataFrame one columnsamples: pandas.DataFrame multiple columns"""def __init__(self, ax, ref, samples, Normalize=False, markers=[], colors=[], scale=1.2, ms=10, pkwargs={}):self.points = []self.Normalize = Normalizeself.pkwargs = pkwargsself.markers = markers if len(markers) else ['o', 'o', 's', 'v', 'o', 's', 'v'] * 100self.colors = colors if len(colors) else ['tab:blue', 'tab:red', 'tab:red', 'tab:red', 'tab:green', 'tab:green', 'tab:green', '#1abc9c', '#2ecc71', '#3498db', '#9b59b6', '#34495e']self.ms = msself.ref = refself.scale = scaleself.samples = samplesself.fig = plt.gcf() self.step_up(ax) self.plot_sample() def calc_loc(self, x, y):R = x.corr(other=y, method='pearson')theta = np.arccos(R)r = y.std()return theta, r / self._refstd if self.Normalize else rdef step_up(self, ax):ax.axis('off')ll, bb, ww, hh = ax.get_position().boundstr = PolarAxes.PolarTransform()Rlocs = np.array([0, 0.2, 0.4, 0.6, 0.7, 0.8, 0.9, 0.95, 0.99, 1])Tlocs = np.arccos(Rlocs) gl1 = GF.FixedLocator(Tlocs) tf1 = GF.DictFormatter(dict(zip(Tlocs, map(str, Rlocs)))) self._refstd = self.ref.std()self.stdmax = max([self.samples[col].std() for col in self.samples.columns] + [self._refstd])self.Smax = (1 if self.Normalize else self.stdmax)* self.scaleself.refstd = 1 if self.Normalize else self._refstdSlocs = np.linspace(0, self.Smax, 4)gl2 = GF.FixedLocator(Slocs) tf2 = GF.DictFormatter(dict(zip(Slocs, map(lambda i: '%.1f' % i, Slocs)))) grid_helper = FA.GridHelperCurveLinear(tr, extremes=(0, np.pi / 2, 0, self.Smax),grid_locator1=gl1, tick_formatter1=tf1,grid_locator2=gl2, tick_formatter2=tf2,)ax = self.fig.add_axes([ll, bb, ww, hh], facecolor='none', axes_class=FA.FloatingAxes, grid_helper=grid_helper)ax.axis["top"].set_axis_direction("bottom")ax.axis["top"].toggle(ticklabels=True, label=True)ax.axis["top"].major_ticklabels.set_axis_direction("top")ax.axis["top"].label.set_axis_direction("top")ax.axis["top"].label.set_text("Correlation")ax.axis["top"].major_ticklabels.set_pad(8)ax.axis["left"].set_axis_direction("bottom")ax.axis["left"].toggle(ticklabels=True)ax.axis["right"].set_axis_direction("top")ax.axis["right"].toggle(ticklabels=True, label=True)ax.axis["right"].label.set_text("Standard deviation")ax.axis["right"].major_ticklabels.set_axis_direction("left")ax.axis["right"].major_ticklabels.set_pad(8)ax.axis['bottom'].set_visible(False)ax.grid(linestyle='--', color='gray')self._ax = axself.ax = ax.get_aux_axes(tr)t = np.linspace(0, np.pi/2)r = np.zeros_like(t) + self.refstdself.ax.plot(t, r, 'k--')rs, ts = np.meshgrid(np.linspace(0, self.Smax, 100), np.linspace(0, np.pi/2, 100))rms = (self.refstd**2 + rs**2 - 2*self.refstd*rs*np.cos(ts))**0.5contours = self.ax.contour(ts, rs, rms, levels=np.linspace(0, self.scale, 4) if self.Normalize else 4,colors='gray', linestyles='--', alpha=.5)self.ax.clabel(contours, contours.levels, inline=True, fmt='%.1f', fontsize=10)p, = self.ax.plot(0, self.refstd, linestyle='', marker=self.markers[0], color=self.colors[0],markersize=self.ms, alpha=0.5, **self.pkwargs)p.set_label(self.ref.name)p.set_clip_on(True) self.points.append(p)def plot_sample(self):stds = []for col, marker, color in zip(self.samples.columns, self.markers[1:], self.colors[1:]):t, s = self.calc_loc(self.ref, self.samples[col])p, = self.ax.plot(t, s, linestyle='', marker=marker, color=color, markersize=self.ms, alpha=.5, **self.pkwargs)p.set_label(col)self.points.append(p)stds.append(s)self.ax.set_xlim(xmax=max(stds))def add_legend(self):ll, bb, ww, hh = self.ax.get_position().boundsself.ax.legend(ncol=len(self.samples) + 1, loc='lower center', frameon=False, bbox_to_anchor=(ll, bb - hh*0.3, ww, hh*0.1))
if __name__ == "__main__":print('read data')df =pd.read_csv(r'C:\Users\Administrator\Desktop\123.csv')
fig, axes = plt.subplots(1, 1, figsize=(5, 5))td = TaylorDiagram(axes,df.iloc[:, 0], df.iloc[:,1:], ms=20, Normalize=True, scale=1.5)plt.show()