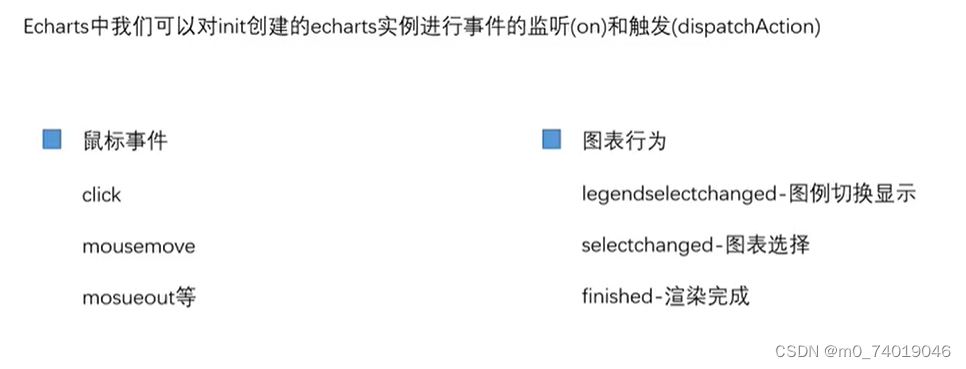
echarts-事件
echarts部分事件
添加点击事件
添加点击事件:
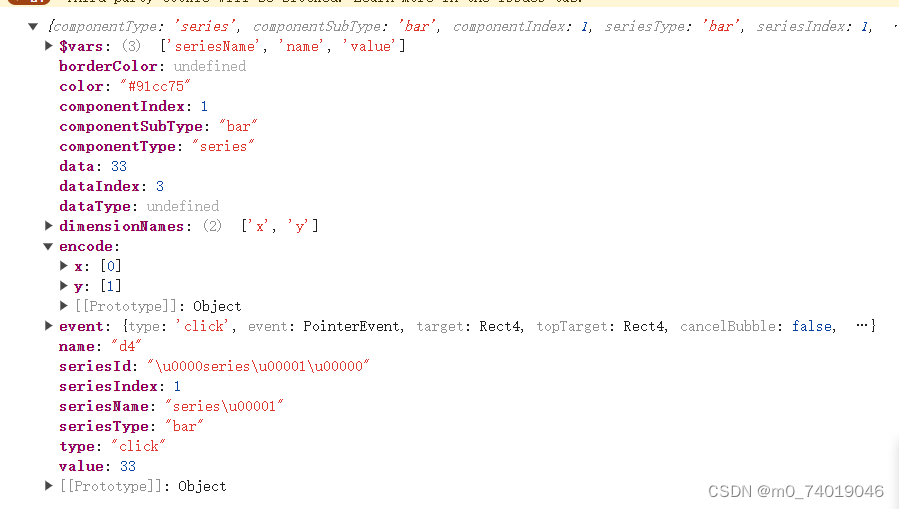
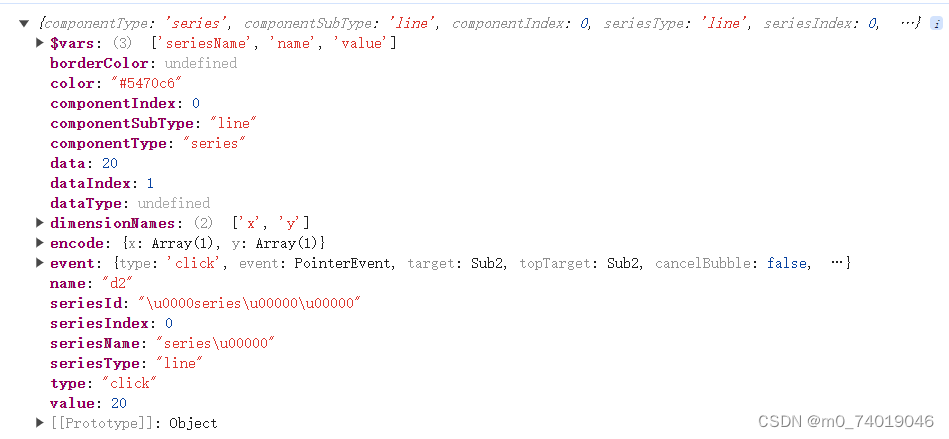
let options = {tooltip: {},xAxis: {type: "category",data: ["d1", "d2", "d3", "d4"],},yAxis: {},series: [{type: "line",data: d1,},{type: "bar",data: d2,},],};myEcharts.on("click", (value) => {console.log(value);});
bar:
line:
过滤项
事件主要有两种写法:
myecharts.on(事件,监听执行的方法,this指向?) 或
myecharts.on(事件,过滤条件,监听执行的方法,this指向?)
第二种写法可以添加过滤条件,让特定的图表触发。
由于echarts的事件是绑定整个echarts的,所以如果想给不同的图表绑定不同的点击事件,就需要使用过滤项。
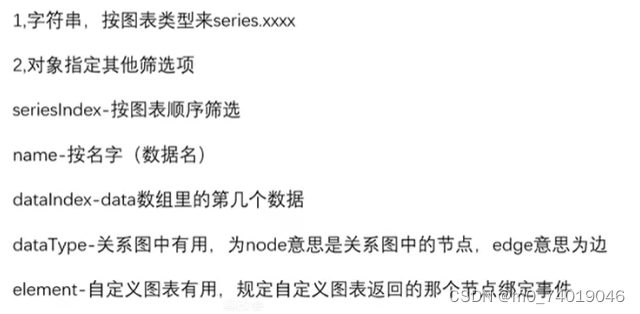
- 按照图标类型
series.类型
myEcharts.on("click", "series.line", (value) => {console.log("line");});myEcharts.on("click", "series.bar", (value) => {console.log("bar");});
- 图标顺序 seriesIndex
myEcharts.on("click",{seriesIndex: 0,},(value) => {console.log("line");});myEcharts.on("click",{seriesIndex: 1,},(value) => {console.log("bar");});
- name 是data中数据的name,可以针对某一条数据触发
series: [{type: "line",data: [{name: "lineD1",value: 10,},20,30,40,],},{type: "bar",data: d2,},],myEcharts.on("click",{name: "lineD1",},(value) => {console.log("line");});
- dataIndex data数组中的第几个数据
myEcharts.on("click",{seriesIndex: 0,dataIndex: 1,},(value) => {console.log("line");});
- dataType 在关系图中有用,如果设为node就是节点触发,edge就是边触发。
series: [{type: "line",data: [{name: "lineD1",value: 10,},20,30,40,],},{type: "bar",data: d2,},{type: "graph",data: [{name: "1",x: 10,y: 10,value: 10,},{name: "2",x: 100,y: 100,value: 20,},],links: [{source: "1",target: "2",},],},],myEcharts.on("click",{dataType: "node",},(value) => {console.log("line");});
- element 自定义图表, 规定自定义图表返回的那个节点绑定事件。
{type: "custom",renderItem() {return {type: "circle",// coordinateSystem: "none",name: "c1",shape: {cx: 20,cy: 10,r: 50,},style: {fill: "blue",},};},},myEcharts.on("click",{element:"c1"}, (value) => {console.log("c1");});使用echarts之外的按钮去触发
事件触发 dispatchAction(obj),只能触发图表行为。
 let options = {tooltip: {},legend: {show: true,},xAxis: {type: "category",data: ["d1", "d2", "d3", "d4"],},yAxis: {},series: [{type: "line",name: "line",data: [{name: "lineD1",value: 10,},20,30,40,],},{type: "bar",name: "bar",data: d2,},],};
const cli = () => {myEcharts.dispatchAction({ type: "legendUnSelect", name: "line" });
};
<button @click="cli">点击图例</button>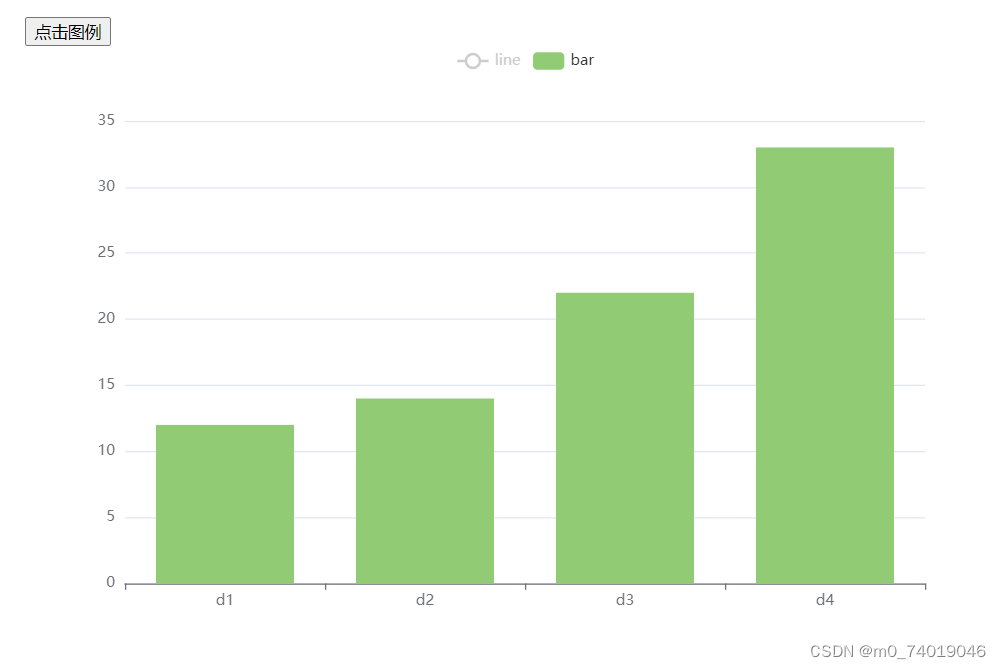
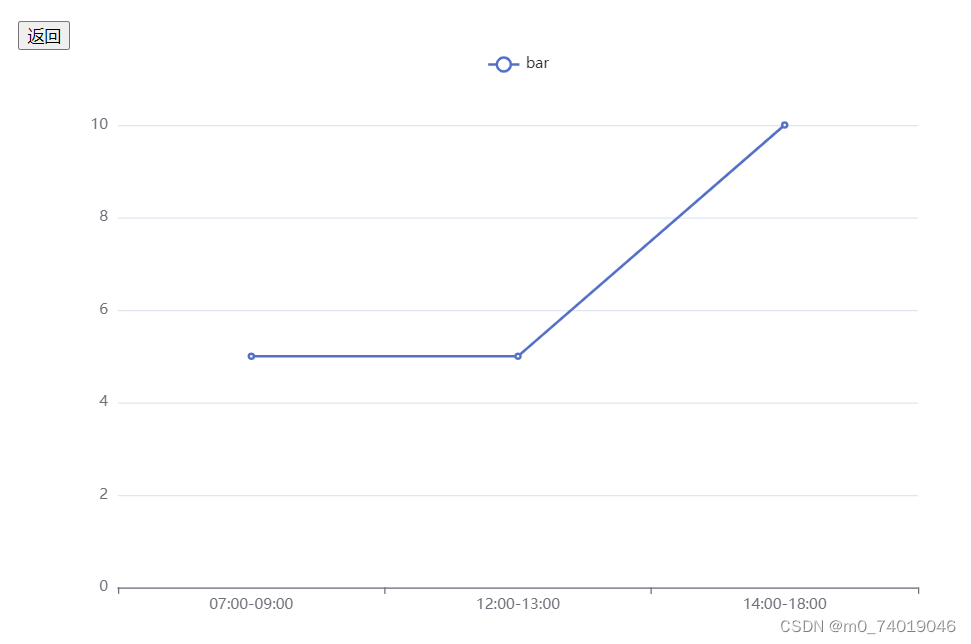
例子 点击柱状图展开详细的折线图
let myEcharts;
let options;
const data = [{data: "2024-05-05",value: 20,detail: [{time: "07:00-09:00",value: 5,},{time: "12:00-13:00",value: 5,},{time: "14:00-18:00",value: 10,},],},{data: "2024-06-06",value: 10,detail: [{time: "08:00-09:00",value: 5,},{time: "12:50-13:00",value: 4,},{time: "16:00-18:00",value: 1,},],},{data: "2024-07-07",value: 15,detail: [{time: "08:00-10:00",value: 5,},{time: "11:00-132:00",value: 5,},{time: "15:00-15:50",value: 10,},],},{data: "2024-08-08",value: 5,detail: [{time: "07:00-09:00",value: 2,},{time: "12:00-13:00",value: 2,},{time: "14:00-18:00",value: 1,},],},
];
onMounted(() => {let canvas = document.getElementById("canvas");echarts.registerMap("china", china);myEcharts = echarts.init(canvas, null, {width: 800,height: 500,devicePixelRatio: window.devicePixelRatio,locale: "ZH",});options = {tooltip: {},legend: {show: true,},xAxis: {type: "category",data: data.map((item) => item.data),},yAxis: {},series: [{type: "bar",name: "bar",data: data.map((item) => item.value),},],};myEcharts.on("click", "series.bar", (value) => {//匹配出当前点击的对象const date = value.name;const item = data.find((item) => {console.log(item.data);if (item.data == date) {return item;}});const detail = item.detail;//将detail渲染成折线myEcharts.setOption({xAxis: {type: "category",data: detail.map((item) => item.time),},yAxis: {},series: [{type: "line",data: detail.map((item) => item.value),},],});});rednderEcharts(options);
});function rednderEcharts(options) {myEcharts.setOption(options);
}
const cli = () => {rednderEcharts(options);
};
</script><template><button @click="cli">返回</button><div id="canvas" width="400" height="400"></div>
</template>
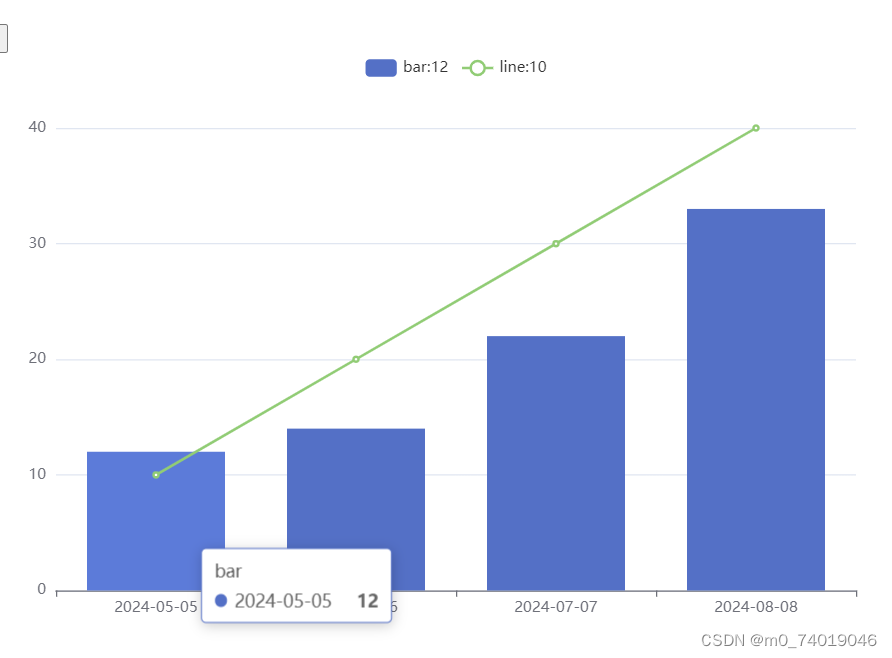
例子 随着鼠标移动,legend显示具体的数值
options = {tooltip: {},legend: {show: true,formatter: (value) => {console.log(value);if (value == "line") {return (value +":" +d1.reduce((pre, now) => {return pre + now;}));} else {return (value +":" +d2.reduce((pre, now) => {return pre + now;}));}},},xAxis: {type: "category",data: data.map((item) => item.data),},yAxis: {},series: [{type: "bar",name: "bar",data: d2,},{type: "line",name: "line",data: d1,},],};myEcharts.on("mouseout", "series.bar", (value) => {myEcharts.setOption({legend: {show: true,formatter: (value) => {console.log(value);if (value == "line") {return (value +":" +d1.reduce((pre, now) => {return pre + now;}));} else {return (value +":" +d2.reduce((pre, now) => {return pre + now;}));}},},});});myEcharts.on("mouseover", "series.bar", (value) => {console.log(value);let _data = value.data;let _index = value.dataIndex;let _linedata = d1[_index];myEcharts.setOption({legend: {formatter(value) {if (value == "line") {return value + ":" + _linedata;} else {return value + ":" + _data;}},},});});
动画
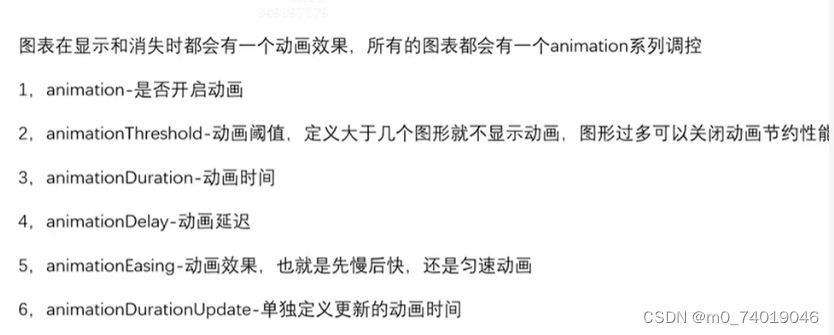
series: [{type: "bar",name: "bar",data: d2,animation: false,animationThreshold: 5,},{type: "line",name: "line",data: d1,},],