ECharts 环形图组件封装
一、ECharts引入
1.安装echarts包
npm install echarts --save2.引入echarts
这里就演示全局引入了,挂载到vue全局,后面使用时,直接使用 $echarts
import * as echarts from 'echarts'
Vue.prototype.$echarts = echarts
二、写echarts组件
这里演示环形图表吧,刚好项目中用了,兄弟们有时间可以去echarts 官网去看看API
TIPS: 官网地址贴着了 ECharts 官网
几个注意点简单说下:
ECharts 的DOM盒子需要设定尺寸
要不然渲染不出来的;需要设置样式,那就套盒子,写样式;
数据改变时重新渲染问题;
当传入的数据改变时,需要重新渲染,这里我用watch 来监听 props 的值,改变时,就重新执行渲染函数;
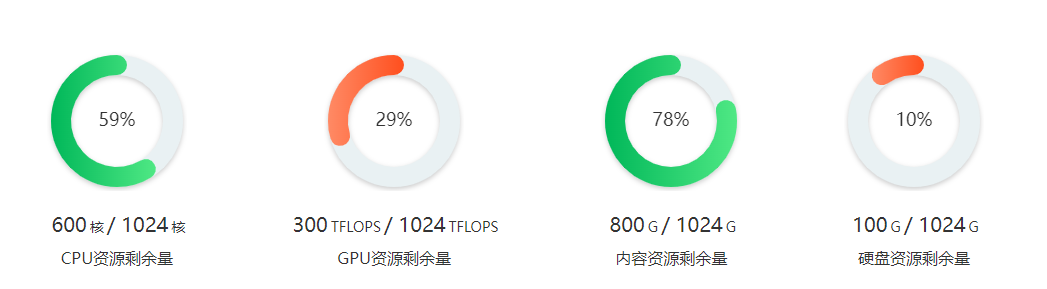
先贴个效果吧:
下面就代码吧:
父组件中(引用组件)
这里的数据,后台在父组件中去请求后台去;这里不多赘述了哈;
 <div class="charts_box" v-if=" active == 1"><div class="charts" v-for="(item,index) in echartsList" :key="index"><EchartsBar :data="item" /></div>
</div>
echarts 组件
<template><div><div class="charts_item"><div class="echartsBar"><div ref="chart" style="width:140px;height:140px"></div></div><div class="info"><p>{{ this.data.residue }}</p><span v-if="data.name == 'CPU资源剩余量'">核</span><span v-else-if=" data.name =='GPU资源剩余量'">TFLOPS</span><span v-else>G</span><p>/</p><p>{{ this.data.total }}</p><span v-if="data.name =='CPU资源剩余量'">核</span><span v-else-if="data.name =='GPU资源剩余量'">TFLOPS</span><span v-else>G</span></div><div class="titleName" v-if="data.name =='CPU资源剩余量'">CPU资源剩余量</div><div class="titleName" v-else-if="data.name =='GPU资源剩余量'">GPU资源剩余量</div><div class="titleName" v-else-if="data.name =='内容资源剩余量'">内容资源剩余量</div><div class="titleName" v-else-if="data.name =='硬盘资源剩余量'">硬盘资源剩余量</div></div></div>
</template><script>
export default {name: "EchartsBar",components: {},props: {data: {type: Object,default: () => {return {name: "请传值",residue: 0,total: 100};}}},data() {return {};},watch: {// 当数据发生改变时,重新渲染echartsdata: {handler() {this.getEchartsData();},deep: true,immediate: true}},mounted() {this.getEchartsData();},methods: {getEchartsData() {const chart = this.$refs.chart;if (chart) {const myChart = this.$echarts.init(chart);const option = {title: {text: Math.round((this.data.residue / this.data.total) * 100) + "%",textStyle: {color: "#333333",fontSize: 18,fontWeight: "normal"},// subtext: "总分:100分",// subtextStyle: {//   color: "#909090"// },// itemGap: -10, // 主副标题距离left: "center",top: "center"},angleAxis: {max: this.data.total, // 满分clockwise: false, // 逆时针// 隐藏刻度线axisLine: {show: false},axisTick: {show: false},axisLabel: {show: false},splitLine: {show: false}},radiusAxis: {type: "category",// 隐藏刻度线axisLine: {show: false},axisTick: {show: false},axisLabel: {show: false},splitLine: {show: false}},polar: {center: ["50%", "50%"],radius: "160%" //图形大小},series: [{type: "bar",data: [{name: "资源剩余量",value: this.data.residue,itemStyle: {normal: {color:// 比分比低于30%时,显示橘色,否则显示绿色Math.round((this.data.residue / this.data.total) * 100) >= 30? this.$echarts.graphic.LinearGradient(1, 0, 0, 0, [{offset: 0,color: "#4FE884"},{offset: 1,color: "#00B759"}]): this.$echarts.graphic.LinearGradient(1, 0, 0, 0, [{offset: 0,color: "#ff4f1e"},{offset: 1,color: "#ff8a65"}])}}}],coordinateSystem: "polar",roundCap: true,barWidth: 20,barGap: "-100%", // 两环重叠z: 2},{// 灰色环type: "bar",data: [{value: this.data.total,itemStyle: {color: "#e9f1f3",shadowColor: "rgba(0, 0, 0, 0.2)",shadowBlur: 5,shadowOffsetY: 2}}],coordinateSystem: "polar",roundCap: true,barWidth: 20,barGap: "-100%", // 两环重叠z: 1}]};myChart.setOption(option);window.addEventListener("resize", function() {myChart.resize();});}}}
};
</script>
<style scoped lang='less'>
.charts_item {width: 100%;display: flex;flex-direction: column;justify-content: center;justify-items: center;.echartsBar {margin: 0 auto;}.info {width: 100%;display: flex;justify-content: center;align-items: baseline;color: #333333;padding: 20px 0 10px 0;p {text-align: center;font-size: 20px;font-weight: 500;padding: 0 3px;}span {font-size: 14px;font-weight: 400;}}.titleName {margin: 0 auto;font-size: 16px;color: #333333;text-align: center;}
}
</style>
觉得还行,收藏点赞哈
~~~~~~~~~~~~~~~~~~~~~~~~~~~~~~~END~~~~~~~~~~~~~~~~~~~~~~~~~~~~