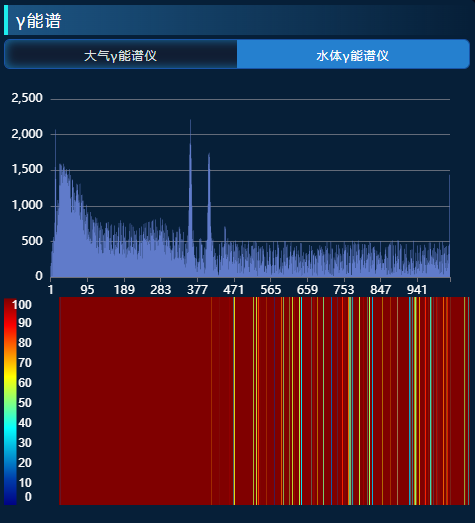
vue3 + ts实现canvas绘制的waterfall
实际运行效果(仅包含waterfall图表部分)
component.vue
<template><div ref="heatmap" :style="{ height: props.containerHeight + 'px' }" />
</template><script setup>
import ColorMap from "colormap";
import { round } from "lodash";
import { ref, reactive, watch, onMounted, watchEffect } from "vue";
const props = defineProps({height: {type: Number,default: 50, // 代表一个屏幕有多少帧},minDb: {type: Number, // 最小值default: 0,},maxDb: {type: Number, // 最大值default: 1000,},containerHeight: {type: Number,default: 210, // 容器高度},legendWidth: {// 左侧色条宽度type: Number,default: 50,},isOnline: {type: Boolean, // 判断是否在线default: false,},sdata: {type: Array,default: () => [], // 实际要显示的数据},startVal: {type: Number,default: 0, // 数据开始的位置},
});
// 图表容器 DOM 的引用
const heatmap = ref(null);
const state = reactive({canvasCtx: null,fallsCanvasCtx: null,legendCanvasCtx: null,canvasWidth: 0,colormap: [],
});
const firstRender = ref(true);
const renderNum = ref(0);
const plotData = ref([]);
let playControl = reactive({ cycleStart: props.startVal });
const requestChartsData = () => {// const data = Array.from({ length: 20000 }, () => -Math.floor(Math.random() * 100) + 1);plotData.value = props.sdata;
};const initComponent = () => {if (!heatmap.value) {return;}// 获取容器宽高const { clientWidth, clientHeight } = heatmap.value;// 初始化颜色图const colormap = initColormap();// 创建画布const { fallsCanvasCtx, canvasCtx, legendCanvasCtx, canvas } = createCanvas(clientWidth,clientHeight);// 绘制左边颜色图图例drawLegend(canvasCtx, legendCanvasCtx, colormap);state.canvasCtx = canvasCtx;state.colormap = colormap;state.fallsCanvasCtx = fallsCanvasCtx;state.legendCanvasCtx = legendCanvasCtx;state.canvasDom = canvas;
};const initColormap = () => {return ColorMap({colormap: "jet",nshades: 150,format: "rba",alpha: 1,});
};const createCanvas = (width, height) => {// 创建用来绘制的画布const fallsCanvas = document.createElement("canvas");fallsCanvas.width = 0;fallsCanvas.height = height;const fallsCanvasCtx = fallsCanvas.getContext("2d");// 创建最终展示的画布const canvas = document.createElement("canvas");canvas.className = "main_canvas";canvas.height = height - 2;canvas.width = width;heatmap.value.appendChild(canvas); // 唯一显示的canvasconst canvasCtx = canvas.getContext("2d");// 创建图例图层画布const legendCanvas = document.createElement("canvas");legendCanvas.width = 1;const legendCanvasCtx = legendCanvas.getContext("2d");return {fallsCanvasCtx,canvasCtx,legendCanvasCtx,canvas,};
};// 更新瀑布图 传入要渲染的数据
const updateChart = (start) => {let data = plotData.value.slice(start, start + 1024);console.log("start", start, data);updateWaterFallPlot(data);
};
const updateWaterFallPlot = (data) => {const len = data.length;if (len !== state.canvasWidth) {state.canvasWidth = len;state.fallsCanvasCtx.canvas.width = len;}if (len === 0) {return;}renderNum.value++;// removePrevImage()// 先在用于绘制的画布上绘制图像addWaterfallRow(data);// 再将画好的图像显示再页面中drawFallsOnCanvas(len);if (renderNum.value > props.height) {// state.canvasDom.height = renderNum.value * props.containerHeight / props.height}
};const removePrevImage = () => {const { canvas } = state.fallsCanvasCtx;state.fallsCanvasCtx.clearRect(0, 0, canvas.width, canvas.height);
};// 在用于绘制的画布上绘制图像
const addWaterfallRow = (data) => {// 先将已生成的图像向下移动一个像素if (!firstRender.value) {state.fallsCanvasCtx.drawImage(state.fallsCanvasCtx.canvas, // 当前cavas0,0,data.length,props.height,0,1,data.length,props.height);} else {firstRender.value = false;}// 再画一行的数据const imageData = rowToImageData(data);state.fallsCanvasCtx.putImageData(imageData, 0, 0);
};// 绘制单行图像
const rowToImageData = (data) => {const imageData = state.fallsCanvasCtx.createImageData(data.length, 1);for (let i = 0; i < imageData.data.length; i += 4) {const cIndex = getCurrentColorIndex(data[i / 4]);const color = state.colormap[cIndex];imageData.data[i + 0] = color[0];imageData.data[i + 1] = color[1];imageData.data[i + 2] = color[2];imageData.data[i + 3] = 255;}return imageData;
};// 将绘制好的图像显示在主页面中
const drawFallsOnCanvas = (len) => {const canvasWidth = state.canvasCtx.canvas.width;const canvasHeight = state.canvasCtx.canvas.height;if (!state.fallsCanvasCtx.canvas.width) return;state.canvasCtx.drawImage(state.fallsCanvasCtx.canvas,-1,0,len + 1,props.height,props.legendWidth + 5,0,canvasWidth - props.legendWidth,canvasHeight);
};
// 获取数据对应的颜色图索引
const getCurrentColorIndex = (data) => {const outMin = 0;const outMax = state.colormap.length - 1;if (data <= props.minDb) {return outMin;} else if (data >= props.maxDb) {return outMax;} else {return round(((data - props.minDb) / (props.maxDb - props.minDb)) * outMax);}
};// 绘制颜色图图例
const drawLegend = (canvasCtx, legendCanvasCtx, colormap) => {const imageData = legendCanvasCtx.createImageData(1, colormap.length);// 遍历颜色图集合for (let i = 0; i < colormap.length; i++) {const color = colormap[i];imageData.data[imageData.data.length - i * 4 + 0] = color[0];imageData.data[imageData.data.length - i * 4 + 1] = color[1];imageData.data[imageData.data.length - i * 4 + 2] = color[2];imageData.data[imageData.data.length - i * 4 + 3] = 255;}legendCanvasCtx.putImageData(imageData, 0, 0);canvasCtx.drawImage(legendCanvasCtx.canvas,0, // source x0, // source y1, // source widthcolormap.length, // souce height0, // d x 目标0, // d y 目标props.legendWidth / 4, // d widthcanvasCtx.canvas.height // d height);canvasCtx.font = "12px Arial";canvasCtx.textAlign = "end";canvasCtx.fillStyle = "#fff";const x = (props.legendWidth * 3) / 4 - 10;canvasCtx.fillText(props.maxDb, x, 12);canvasCtx.fillText(props.minDb, x, props.containerHeight - 6);const dur = (props.maxDb - props.minDb) / 10;for (let i = 1; i < 10; i++) {canvasCtx.fillText(props.minDb + dur * i,x,(props.containerHeight * (10 - i)) / 10 + i);}
};watch(() => props.maxDb,() => {const x = (props.legendWidth * 3) / 4 - 10;state.canvasCtx.clearRect(0, 0, x, props.containerHeight);state.canvasCtx.fillText(props.maxDb, x, 12);state.canvasCtx.fillText(props.minDb, x, props.containerHeight - 6);const dur = (props.maxDb - props.minDb) / 10;for (let i = 1; i < 10; i++) {state.canvasCtx.fillText(props.minDb + dur * i,x,(props.containerHeight * (10 - i)) / 10 + i);}},{ immediate: false, deep: true }
);
watch(() => props.sdata, // 监控数据变化(newval, oldval) => {requestChartsData();updateWaterFallPlot(props.sdata);},{ immediate: false, deep: true }
);
onMounted(() => {initComponent();if (!props.isOnline) {requestChartsData();// watchEffect(() => {updateChart(playControl.cycleStart);// });setInterval(() => {updateChart(playControl.cycleStart);}, 1000);}
});
</script>
父组件引用
<Waterfallv-if="showlargeline":sdata="probes[selectProbeIndex].series[0].data":startVal="0":isOnline="false":height="50":minDb="0":maxDb="100":containerHeight="210"></Waterfall>