Echarts 自适应宽高,或指定宽高进行自适应
文章目录
- 需求
- 分析
需求
有一个按钮实现对Echarts的指定缩放与拉长,形成自适应效果
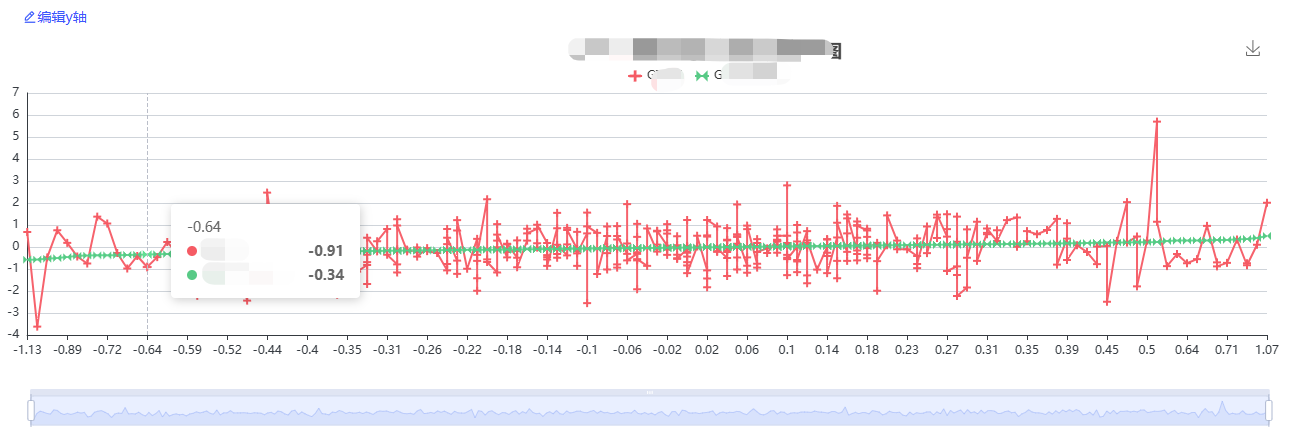
拉长后效果图
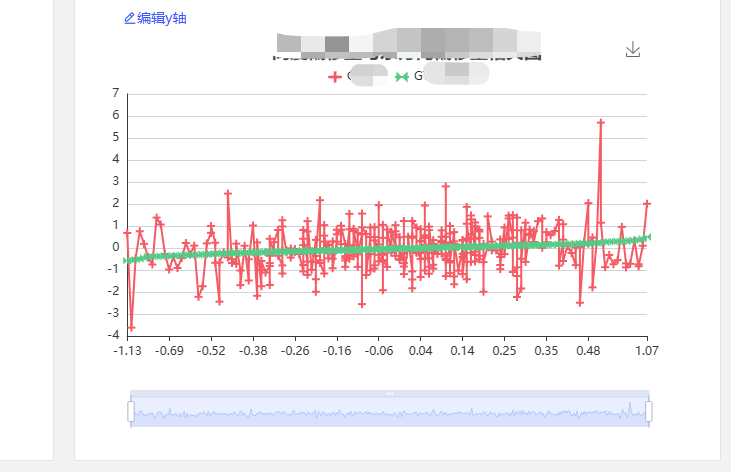
该块元素缩短后效果图
分析
因为我习惯使用 ref 来获取组件的 DOM 元素,然后进行挂载
<div ref="echartsRef" id="myDiv" :style="{ width, height }"></div>echartInstance = echarts.init(echartsRef.value, 'macarons');
- 小插入————踩坑【别试】
想的是通过document.querySelector 修改宽高,但是并未监听到 ref 的宽高被修改【未成功】
网上有说是要销毁 DOM 重新进行绘制,【未成功】
watch(flagFold, (newVal) => {echartResizes(echartInstance)const myDiv = document.querySelector('#myDiv ')myDiv.style.width = newVal ? '1400px' : '600px'if (echartInstance) {echartInstance.resize();}
})
因此采用如下解决办法
因此在监听变化的时候,要修改 ref 获取到的元素的宽度和高度
<template><div><!-- 使用 ref 来获取组件的 DOM 元素 --><div ref="echartsContainer" :style="{ width: containerWidth + 'px', height: containerHeight + 'px' }"></div></div>
</template><script>
import { ref, onMounted, watch } from 'vue';
import echarts from 'echarts';export default {setup() {// 使用 ref 来创建响应式对象const echartsContainer = ref(null);const containerWidth = ref(0);const containerHeight = ref(0);let echartsInstance;onMounted(() => {// 初始化 ECharts 实例echartsInstance = echarts.init(echartsContainer.value);// 在组件挂载后调整组件宽度和高度adjustSize();});// 监听组件宽度和高度变化watch([() => echartsContainer.value.offsetWidth, () => echartsContainer.value.offsetHeight], ([newWidth, newHeight], [oldWidth, oldHeight]) => {// 当组件宽度或高度发生变化时调用 adjustSize 方法adjustSize();});const adjustSize = () => {// 获取组件宽度和高度containerWidth.value = echartsContainer.value.offsetWidth;containerHeight.value = echartsContainer.value.offsetHeight;// 修改组件宽度和高度echartsInstance.resize({width: containerWidth.value,height: containerHeight.value});};return {echartsContainer,containerWidth,containerHeight};}
}
</script>
- 源码展示
<template><div ref="echartsRef" id="myDiv" :style="{ width, height }"></div>
</template><script lang="ts" setup>
import {ref,reactive,watch,toRefs,onMounted,onBeforeUnmount,computed,watchEffect
} from 'vue';
import * as echarts from 'echarts';
import { echartResize, echartResizes } from "@/utils/echsrts";
import { useToolStore } from '@/store';const ToolStore = useToolStore()const flagFold = computed(() => {return ToolStore.isFold
})
watch(flagFold, (newVal) => {echartResizes(echartInstance)// const myDiv = document.querySelector('#myDiv ')// myDiv.style.width = newVal ? '1400px' : '600px'echartInstance.resize({width: newVal ? 1400 : 600,});if (echartInstance) {echartInstance.resize();}
})/*** @description : 安全监测模块* @author : 'Hukang'* @param : '' * @date : 2024-03-05 14:59:56
*/
const props = defineProps({//子组件接收父组件传递过来的值chartData: Object,width: {type: String,default: '600px',required: false // 是否必传},height: {type: String,default: '580px',required: false // 是否必传}
})
//使用父组件传递过来的值
const { chartData } = toRefs(props)const option = ref({title: {text: ''},tooltip: {trigger: 'axis',axisPointer: {type: 'cross',label: {backgroundColor: '#6a7985'}}},legend: {data: [],right: "5%",top: "0",textStyle: {fontSize: 12, //字体大小color: "#000" //字体颜色}},toolbox: {feature: {saveAsImage: {show: true,title: '点击保存'}},right: '10%', // 从右边缘的距离top: '10%'},grid: {left: '3%',right: '8%',bottom: '8%',top: '15%',containLabel: true},xAxis: {type: "category",boundaryGap: false,data: [],axisLine: {lineStyle: {color: "#000"}},axisTick: {show: true//刻度线},nameTextStyle: {color: "#000",fontSize: 12},axisLabel: {color: "#000",fontSize: 12,formatter: (value, index) => {return value.replace(/(\d{4})-(\d{1,2})-(\d{1,2}).*/, "$1-$2-$3").slice(5);}}},yAxis: [{name: '',type: "value",axisTick: {show: true},nameTextStyle: {color: "#000",fontSize: 12},axisLine: {show: true,lineStyle: {color: "#000"}},splitLine: {lineStyle: {type: "dashed", //虚线color: "rgba(0,0,0,0.8)"},show: true //隐藏},min(v) {return v.min}}],dataZoom: [{show: true,type: 'slider',handleSize: 32, // 两边的按钮大小},{type: 'inside'}],series: [],
})const echartsRef = ref<string>();
let echartInstance;
watch(chartData, (newVal) => {if (newVal) {option.value = newValechartInstance.setOption(option.value);window.addEventListener('resize', () => {if (echartInstance) {echartInstance.resize();}})}
}, { deep: true })onMounted(() => {echartInstance = echarts.init(echartsRef.value, 'macarons');})
onBeforeUnmount(() => {if (echartInstance && echartInstance.dispose) {echartInstance = null;}
})
</script><style scoped lang="less"></style>