vue+Echarts实现多设备状态甘特图
目录
1.效果图
2.代码
3.注意事项
Apache ECharts ECharts官网,可在“快速上手”处查看详细安装方法
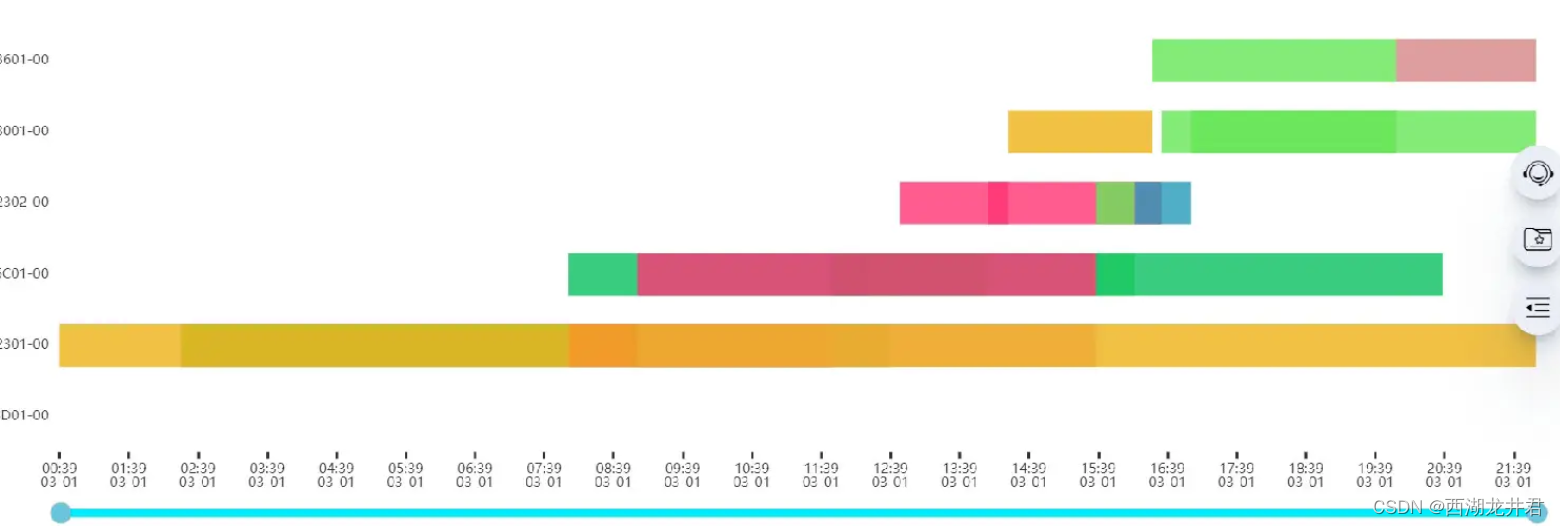
1.效果图
可鼠标滚轮图表和拉动下方蓝色的条条调节时间细节哦
(注:最后一个设备没有数据,所以不显示任何矩形)
2.代码
根据每个设备的不同的状态,和对应状态的持续时间渲染矩形
html部分
<div id="myechart" :style="{ float: 'left', width: '100%', height: '100%' }"></div>js部分
// 甘特图 数据处理及挂载函数,可在获取到数据或者数据更新时调用drawEchart() {// this.newEqp为数据集,从后端获取var data = this.newEqp// 设定状态对应显示的颜色var types = [{ name: '辅料待料', color: '#07c160' },{ name: '下游待料', color: '#269abc' },{ name: '上游待料', color: '#edb217' },{ name: '其他停机', color: '#f68ba7' },{ name: '故障停机', color: '#ff3374' },{ name: '运行', color: '#66E656' },];var startTime;var datatemp = [];// 处理时间,x轴需要月、日、时、分for (let i = 0; i < data.length; i++) {startTime = new Date(data[i].Last_Eqpt_Update_Time).getTime();var typeItem = types.filter(a => a.name == data[i].Eqpt_State_Dsc)[0];datatemp.push({name: typeItem.name,value: [parseInt(data[i].Index),new Date(data[i].Last_Eqpt_Update_Time).getTime(),new Date(data[i].Eqpt_Update_Time).getTime(),//data[i].RUNTIME_TIMESTAMP,//data[i].END_TIME_TIMESTAMP,data[i].Index,data[i].Eqpt_Dsc],itemStyle: {normal: {color: typeItem.color}}});}// console.log("data:", data);// console.log('datatemp', datatemp);// 处理各种状态的起始和结束时间函数function renderItem(params, api) {var categoryIndex = api.value(0);var start = api.coord([api.value(1), categoryIndex]);var end = api.coord([api.value(2), categoryIndex]);var height = api.size([0, 1])[1] * 0.6;var rectShape = echarts.graphic.clipRectByRect({x: start[0],y: start[1] - height / 2,width: end[0] - start[0],height: height},{x: params.coordSys.x,y: params.coordSys.y,width: params.coordSys.width,height: params.coordSys.height});// 返回矩形对象return (rectShape && {type: 'rect',transition: ['shape'],shape: rectShape,style: api.style()});}// 基于echarts的甘特图let myechart = this.$echarts.init(document.getElementById("myechart"))let myechart2 = {textStyle: {color: '#333',fontSize: '0.13rem'},grid: {top: '5%',left: '8%',bottom: '16%',width: '90%'},legend: {show: true,itemWidth: 10,itemHeight: 10,textStyle: {color: '#fff',fontSize: '0.12rem'},data: types.map(function (type) {return type.name;}),},tooltip: {show: true,textStyle: {fontSize: 10},axisPointer: {type: 'cross',crossStyle: {color: '#333'}},formatter: function (params) {return params.value[4] + '\t' + params.name + '\t' + params.marker + (new Date(params.value[1])).getHours() + ':' + (new Date(params.value[1])).getMinutes() + '—' + (new Date(params.value[2])).getHours() + ':' + (new Date(params.value[2])).getMinutes();}},dataZoom: [{type: 'inside',filterMode: 'weakFilter'},{type: "slider",show: true,height: "6",bottom: "4%",labelFormatter: '',backgroundColor: "white",brushSelect: false,minValueSpan: 3600 * 24 * 1000 * 7,handleIcon: 'path://path://M100, 100m -75, 0a75,75 0 1,0 150,0a75,75 0 1,0 -150,0',handleSize: 15,handleColor: '#6bc5da',start: 0,end: 100,handleStyle: {borderCap: 'round',color: "#fff",shadowColor: 'rgba(0, 0, 0, 0.5)',shadowBlur: 1},textStyle: {color: "transparent"},borderColor: 'transparent',backgroundColor: '#D7F4FF',dataBackground: {lineStyle: {width: 0},areaStyle: {color: 'transparent'}},fillerColor: '#00EBFF'}],xAxis: {type: 'time',//min: new Date(startTime).setHours(7, 0, 0, 0),//max: new Date(new Date(startTime).setDate(new Date(startTime).getDate() + 1)).setHours(7, 0, 0, 0),interval: 3600000,scale: true,axisLabel: {formatter: function (val) {return new Date(val).toLocaleTimeString('en-US', { hour: '2-digit', minute: 'numeric', hour12: false });}},splitLine: {show: false},axisLine: {show: false},axisTick: {show: true,lineStyle: {color: '#333',width: 2}},axisLabel: {textStyle: {color: '#333',fontSize: '0.14rem'},show: true}},yAxis: {// y轴数据,这里是设备编号data: this.eqptId,scale: true,splitLine: { show: false },axisLine: {show: false},axisTick: {show: false},axisLabel: {show: true,textStyle: {color: '#333',fontSize: '0.12rem',fontWeight: 'bolder',}}},series: [{type: 'custom',// 图表矩形数据renderItem: renderItem,itemStyle: {opacity: 0.8},encode: {x: [0, 1],y: 0},data: datatemp,}]}myechart.setOption(myechart2)}3.注意事项
甘特图图表可能会不显示,原因一般是在获取到数据之前图表就挂载上了,然后数据更新后并没有更新图表数据。这里本人的方法是在获取到数据的后面调用挂载图表的函数,当然这肯定不是最好的方法。
// 获取图表数据
getCharts().then((res)=>{............// 判断获取到数据后调用处理数据及挂载图表的函数this.drawEchart()if(res.length !== 0){this.drawEchart()}
})