ArcgisForJS如何将ArcGIS Server发布的点要素渲染为热力图?
文章目录
- 0.引言
- 1.ArcGIS创建点要素
- 2.ArcGIS Server发布点要素
- 3.ArcgisForJS将ArcGIS创建的点要素渲染为热力图
0.引言
ArcGIS For JS 是一个强大的地理信息系统(GIS)工具,它允许开发者使用 JavaScript 语言来创建各种 GIS 应用。ArcGIS Server 是 ArcGIS For JS 的一个组件,它提供了一个强大的服务,用于发布和处理地理空间数据。在 ArcGIS For JS 中,你可以使用 ArcGIS Server API 发布点要素数据,并通过 ArcGIS Server API 的热力图功能将其渲染为热力图。
1.ArcGIS创建点要素
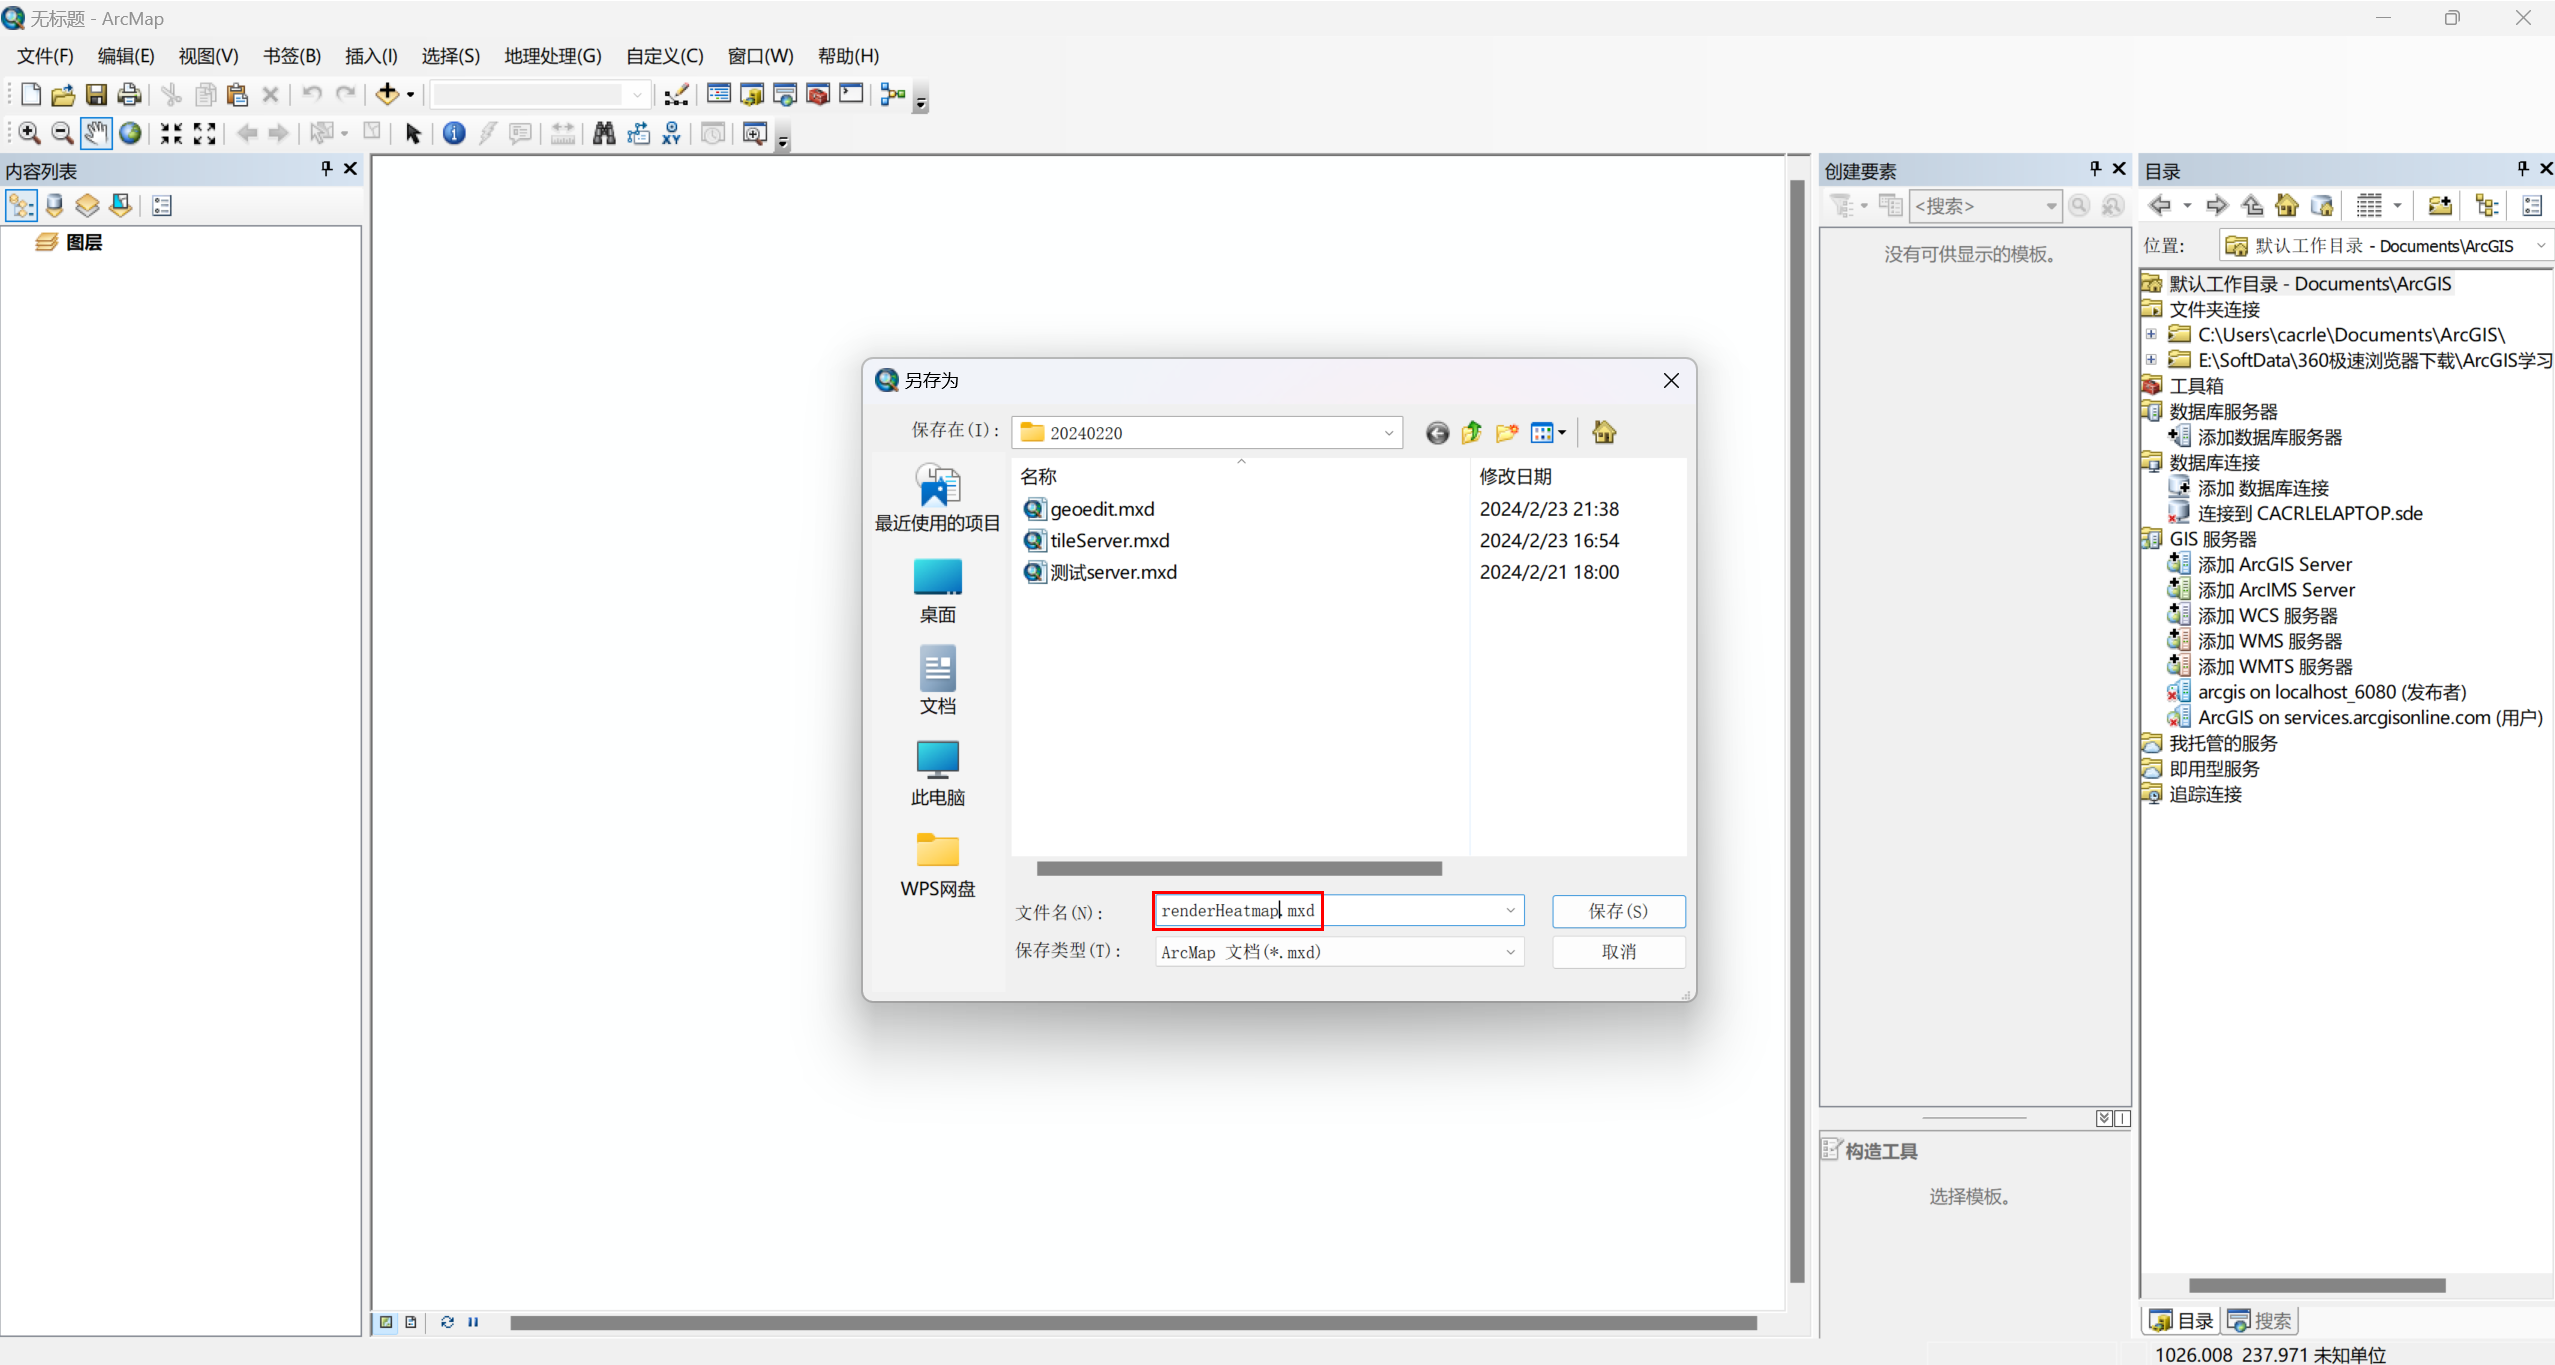
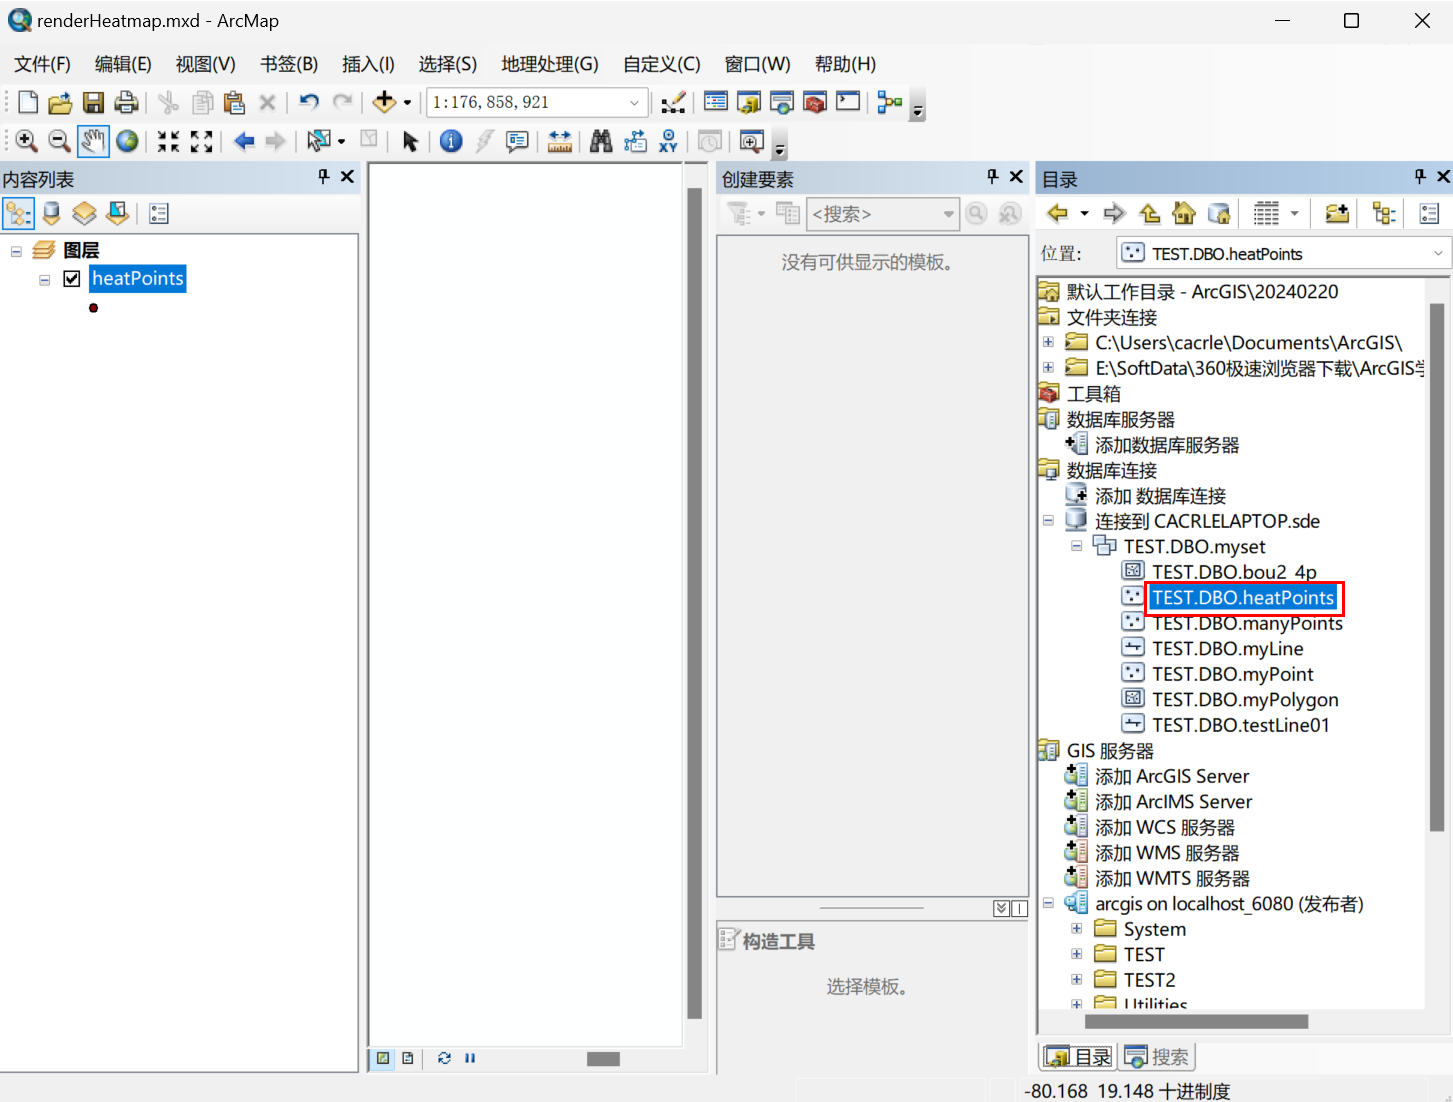
(1)新建一个mxd地图文档,命名为renderHeatmap;
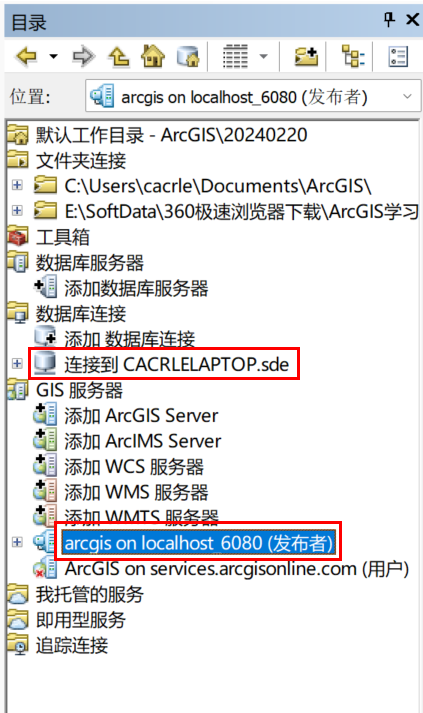
(2)双击连接地理数据库和ArcGIS Server
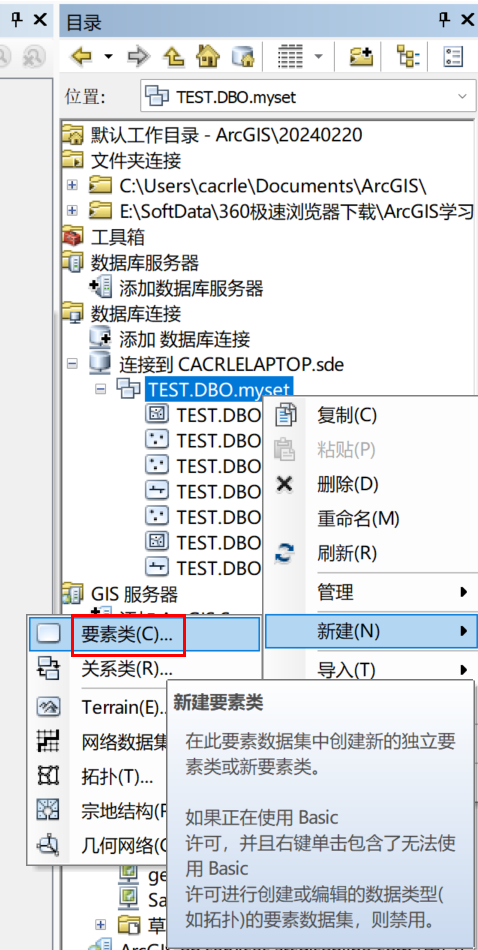
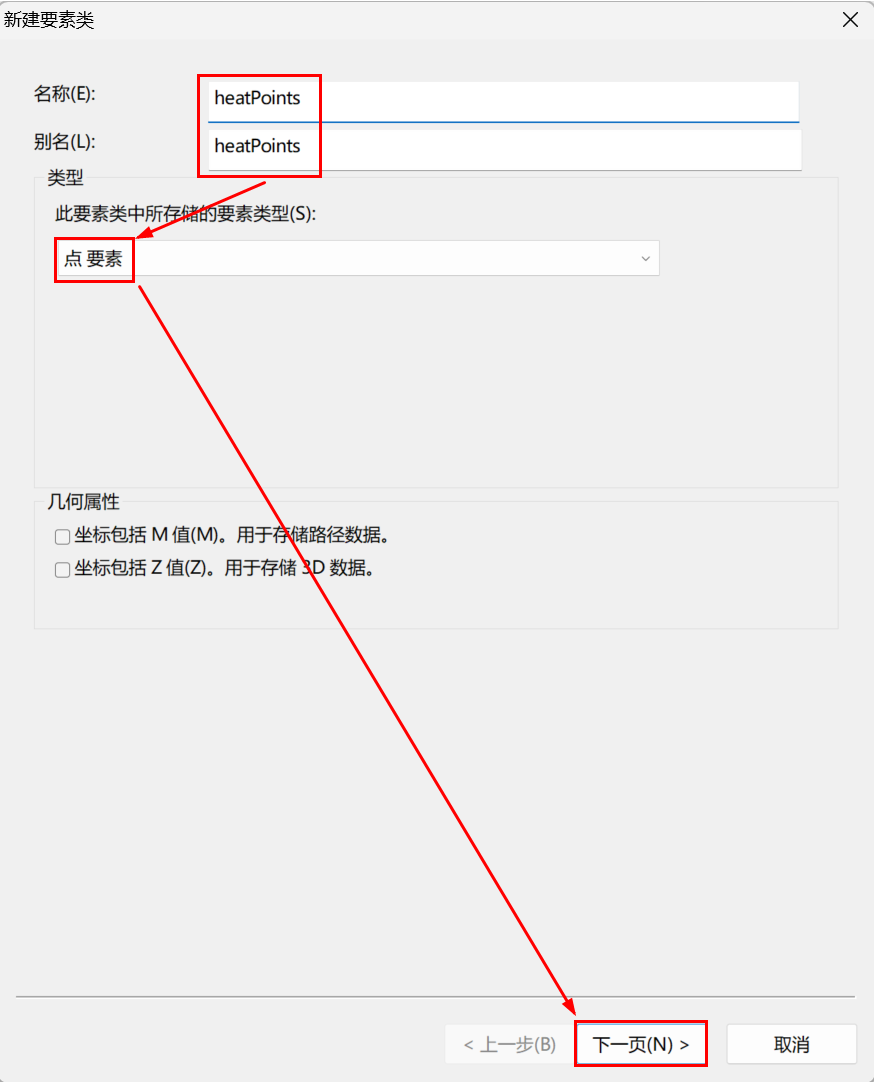
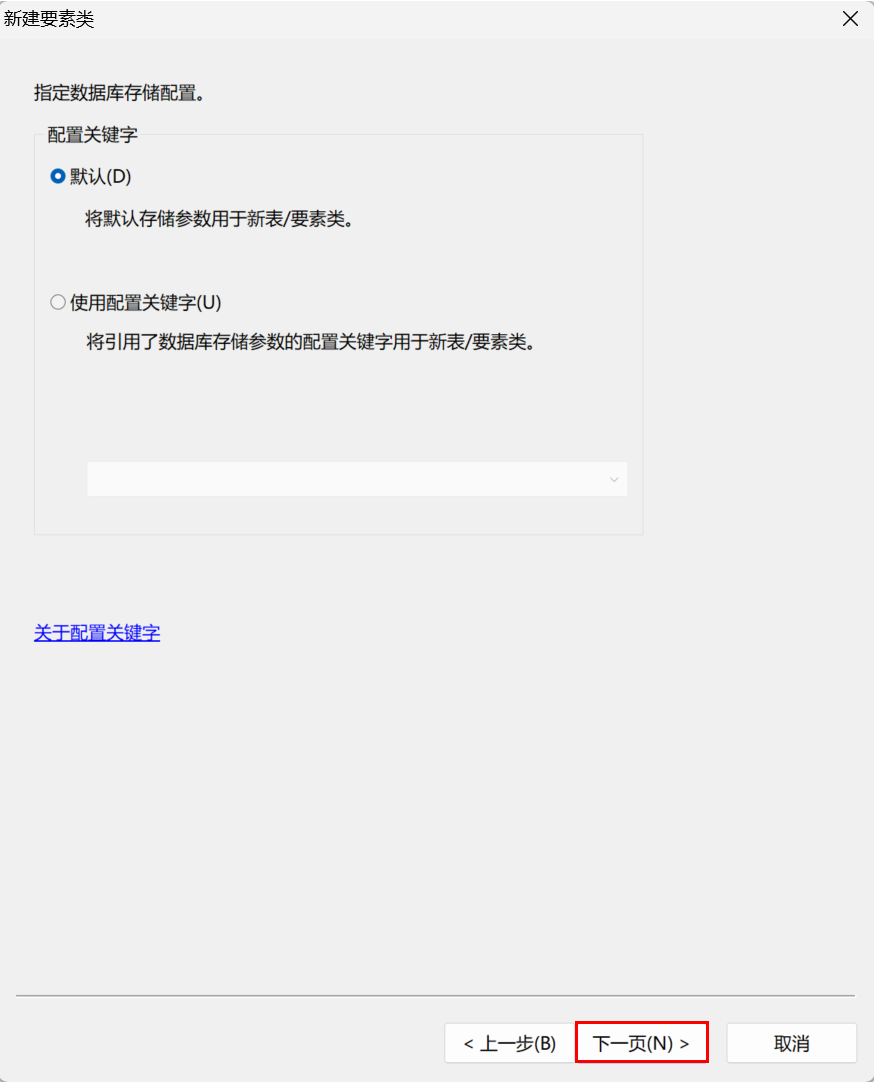
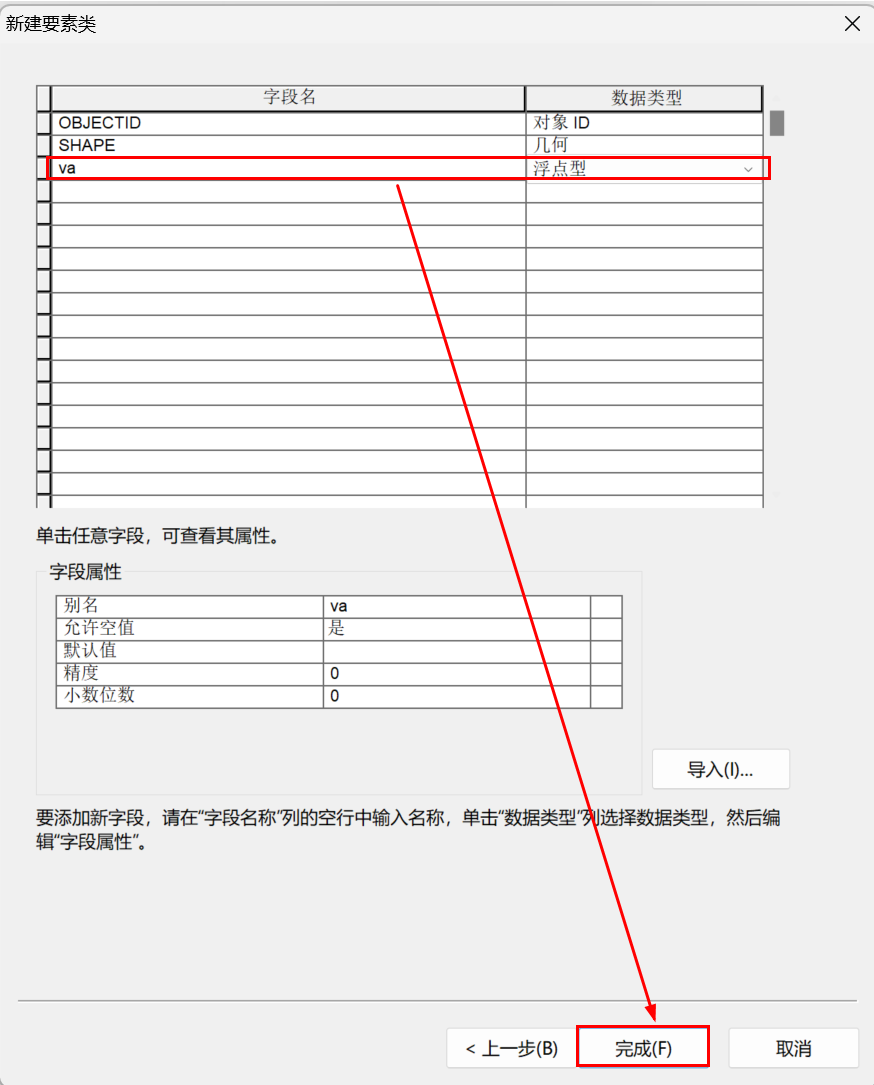
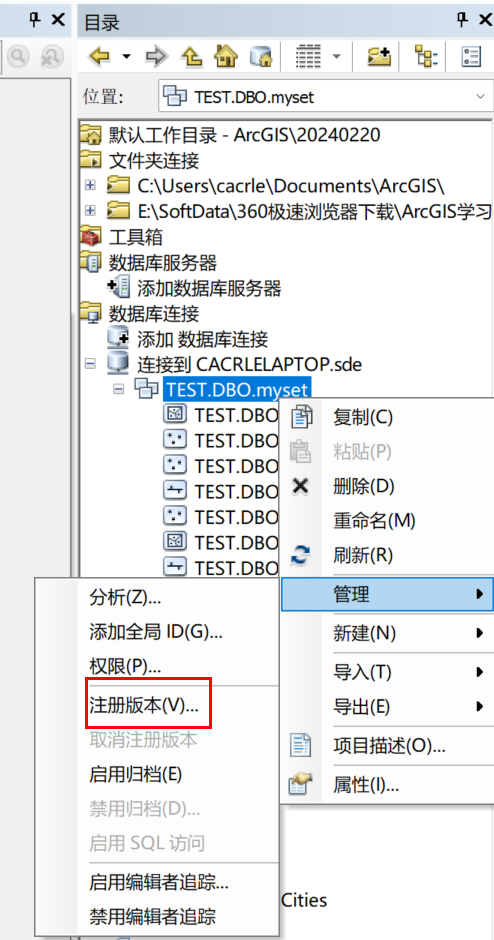
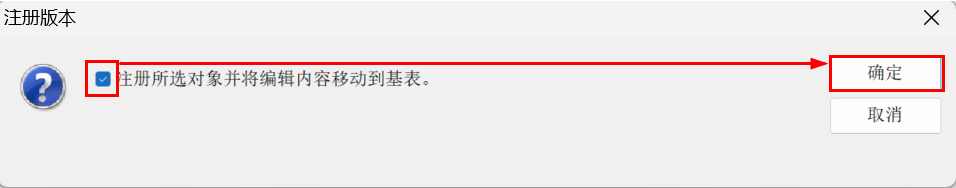
(3)点要素创建并注册
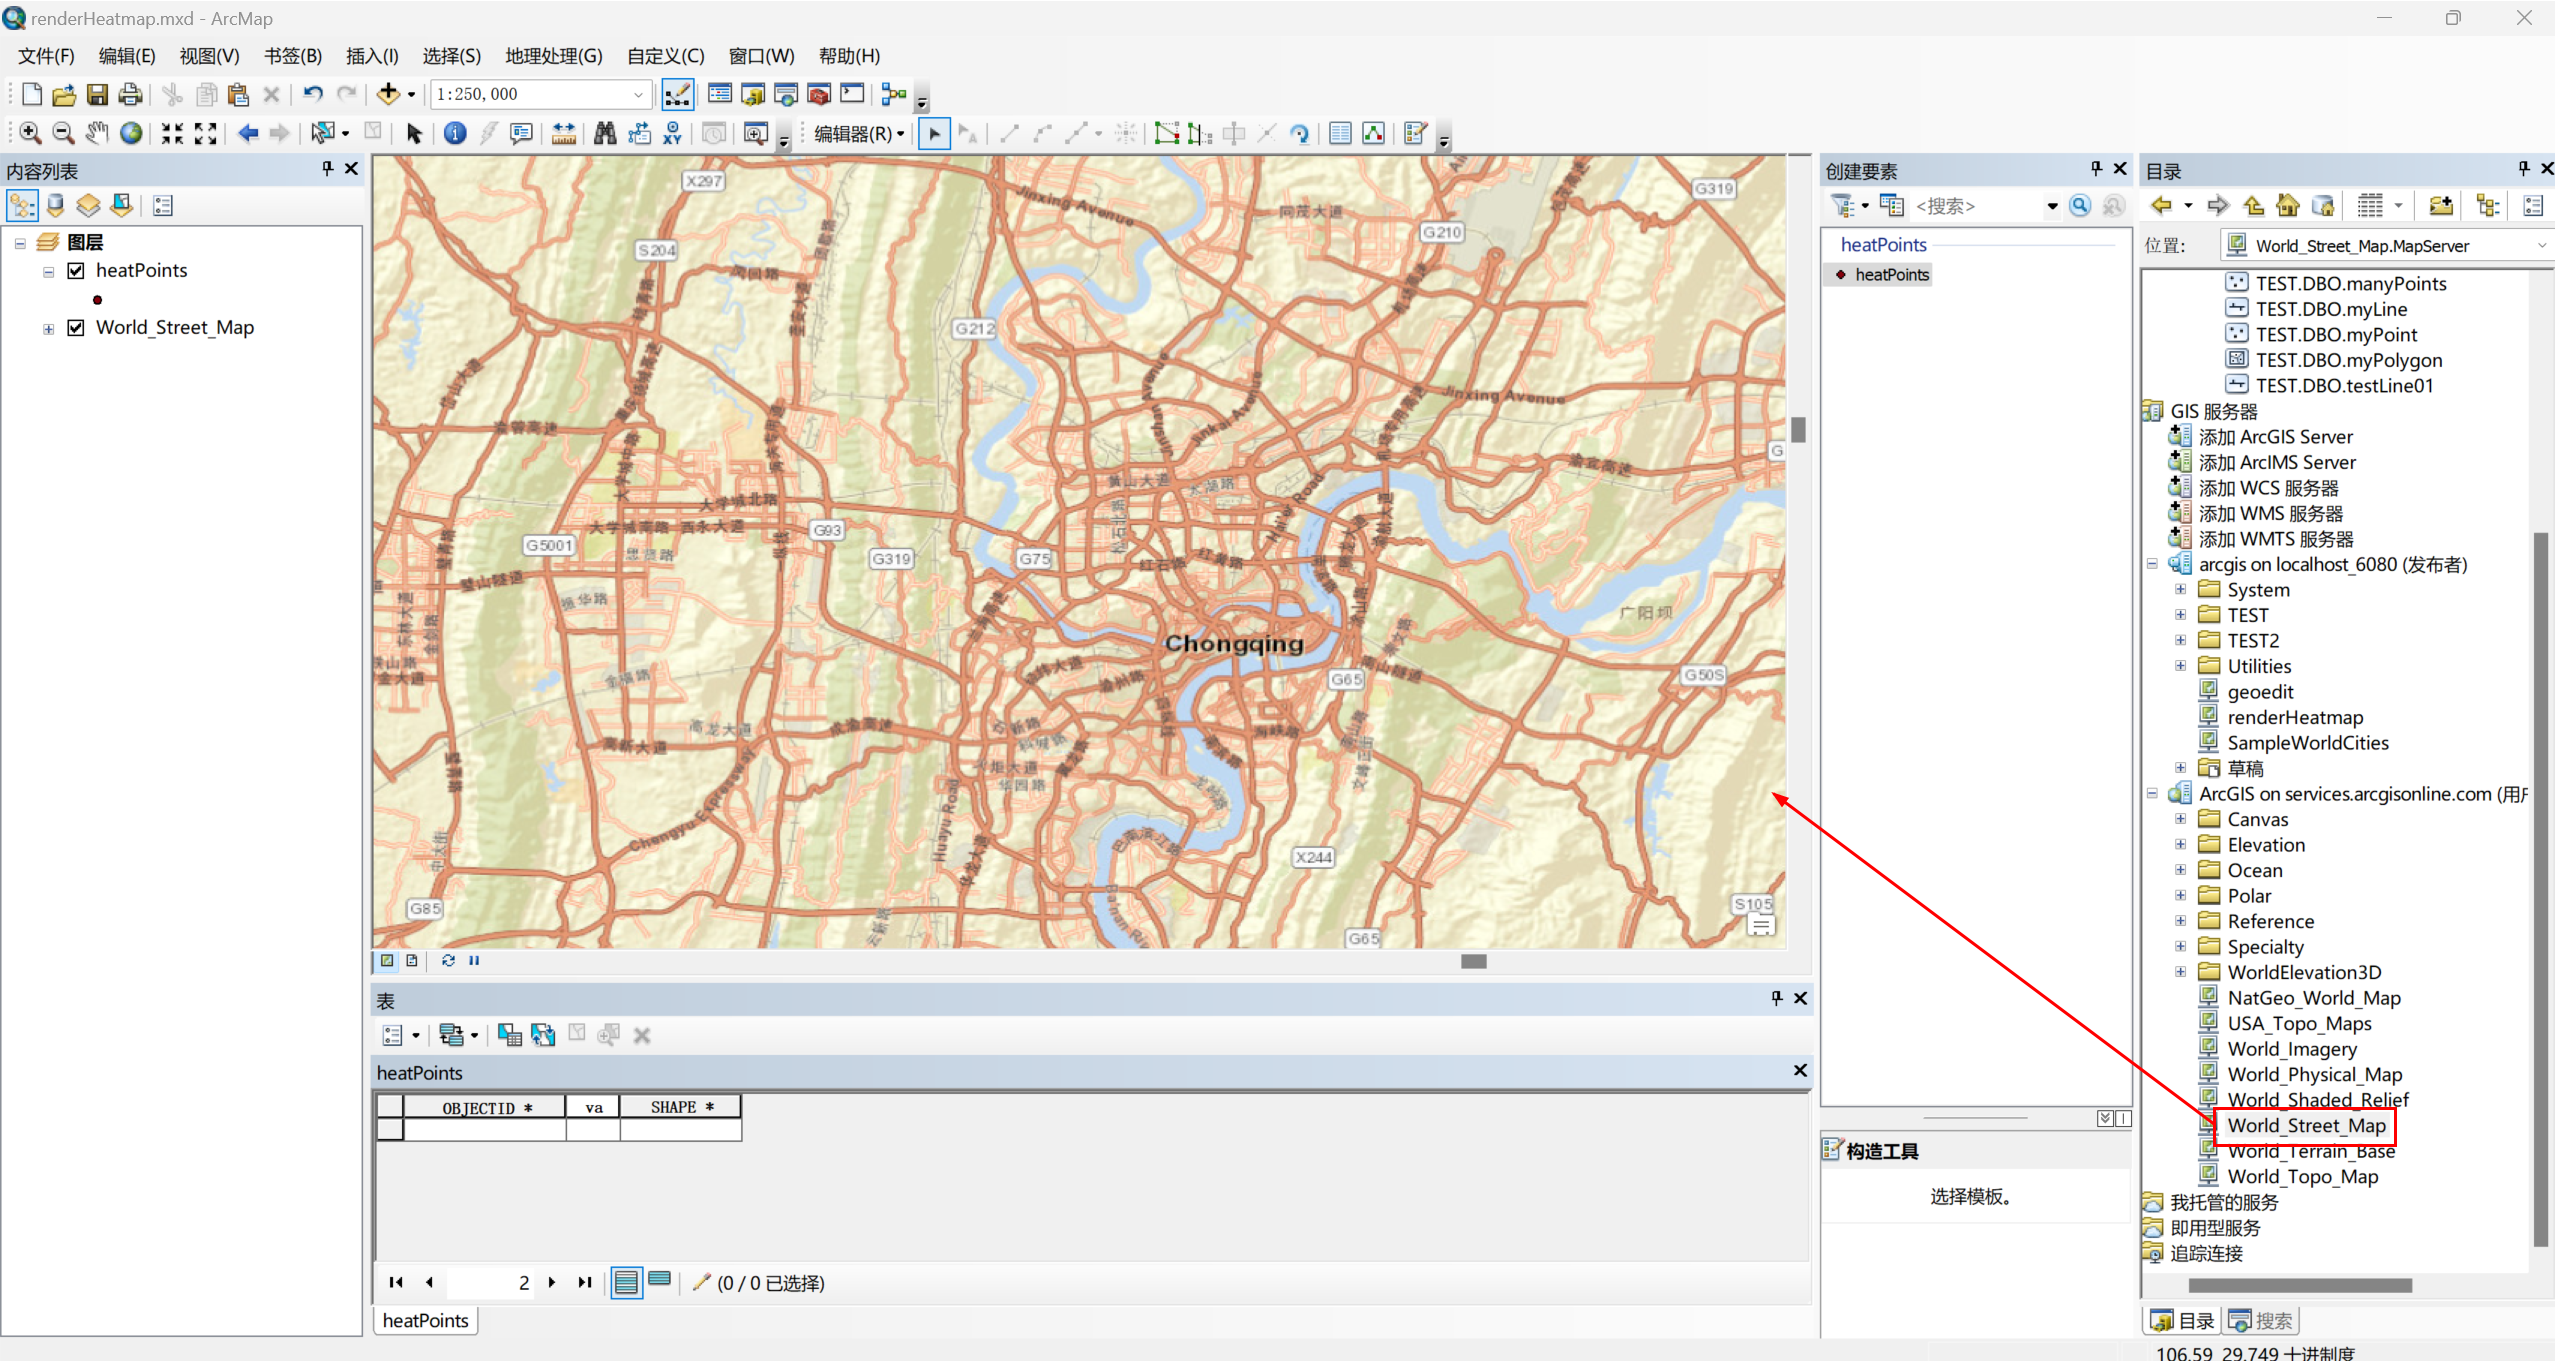
(4)添加编辑要素的底图
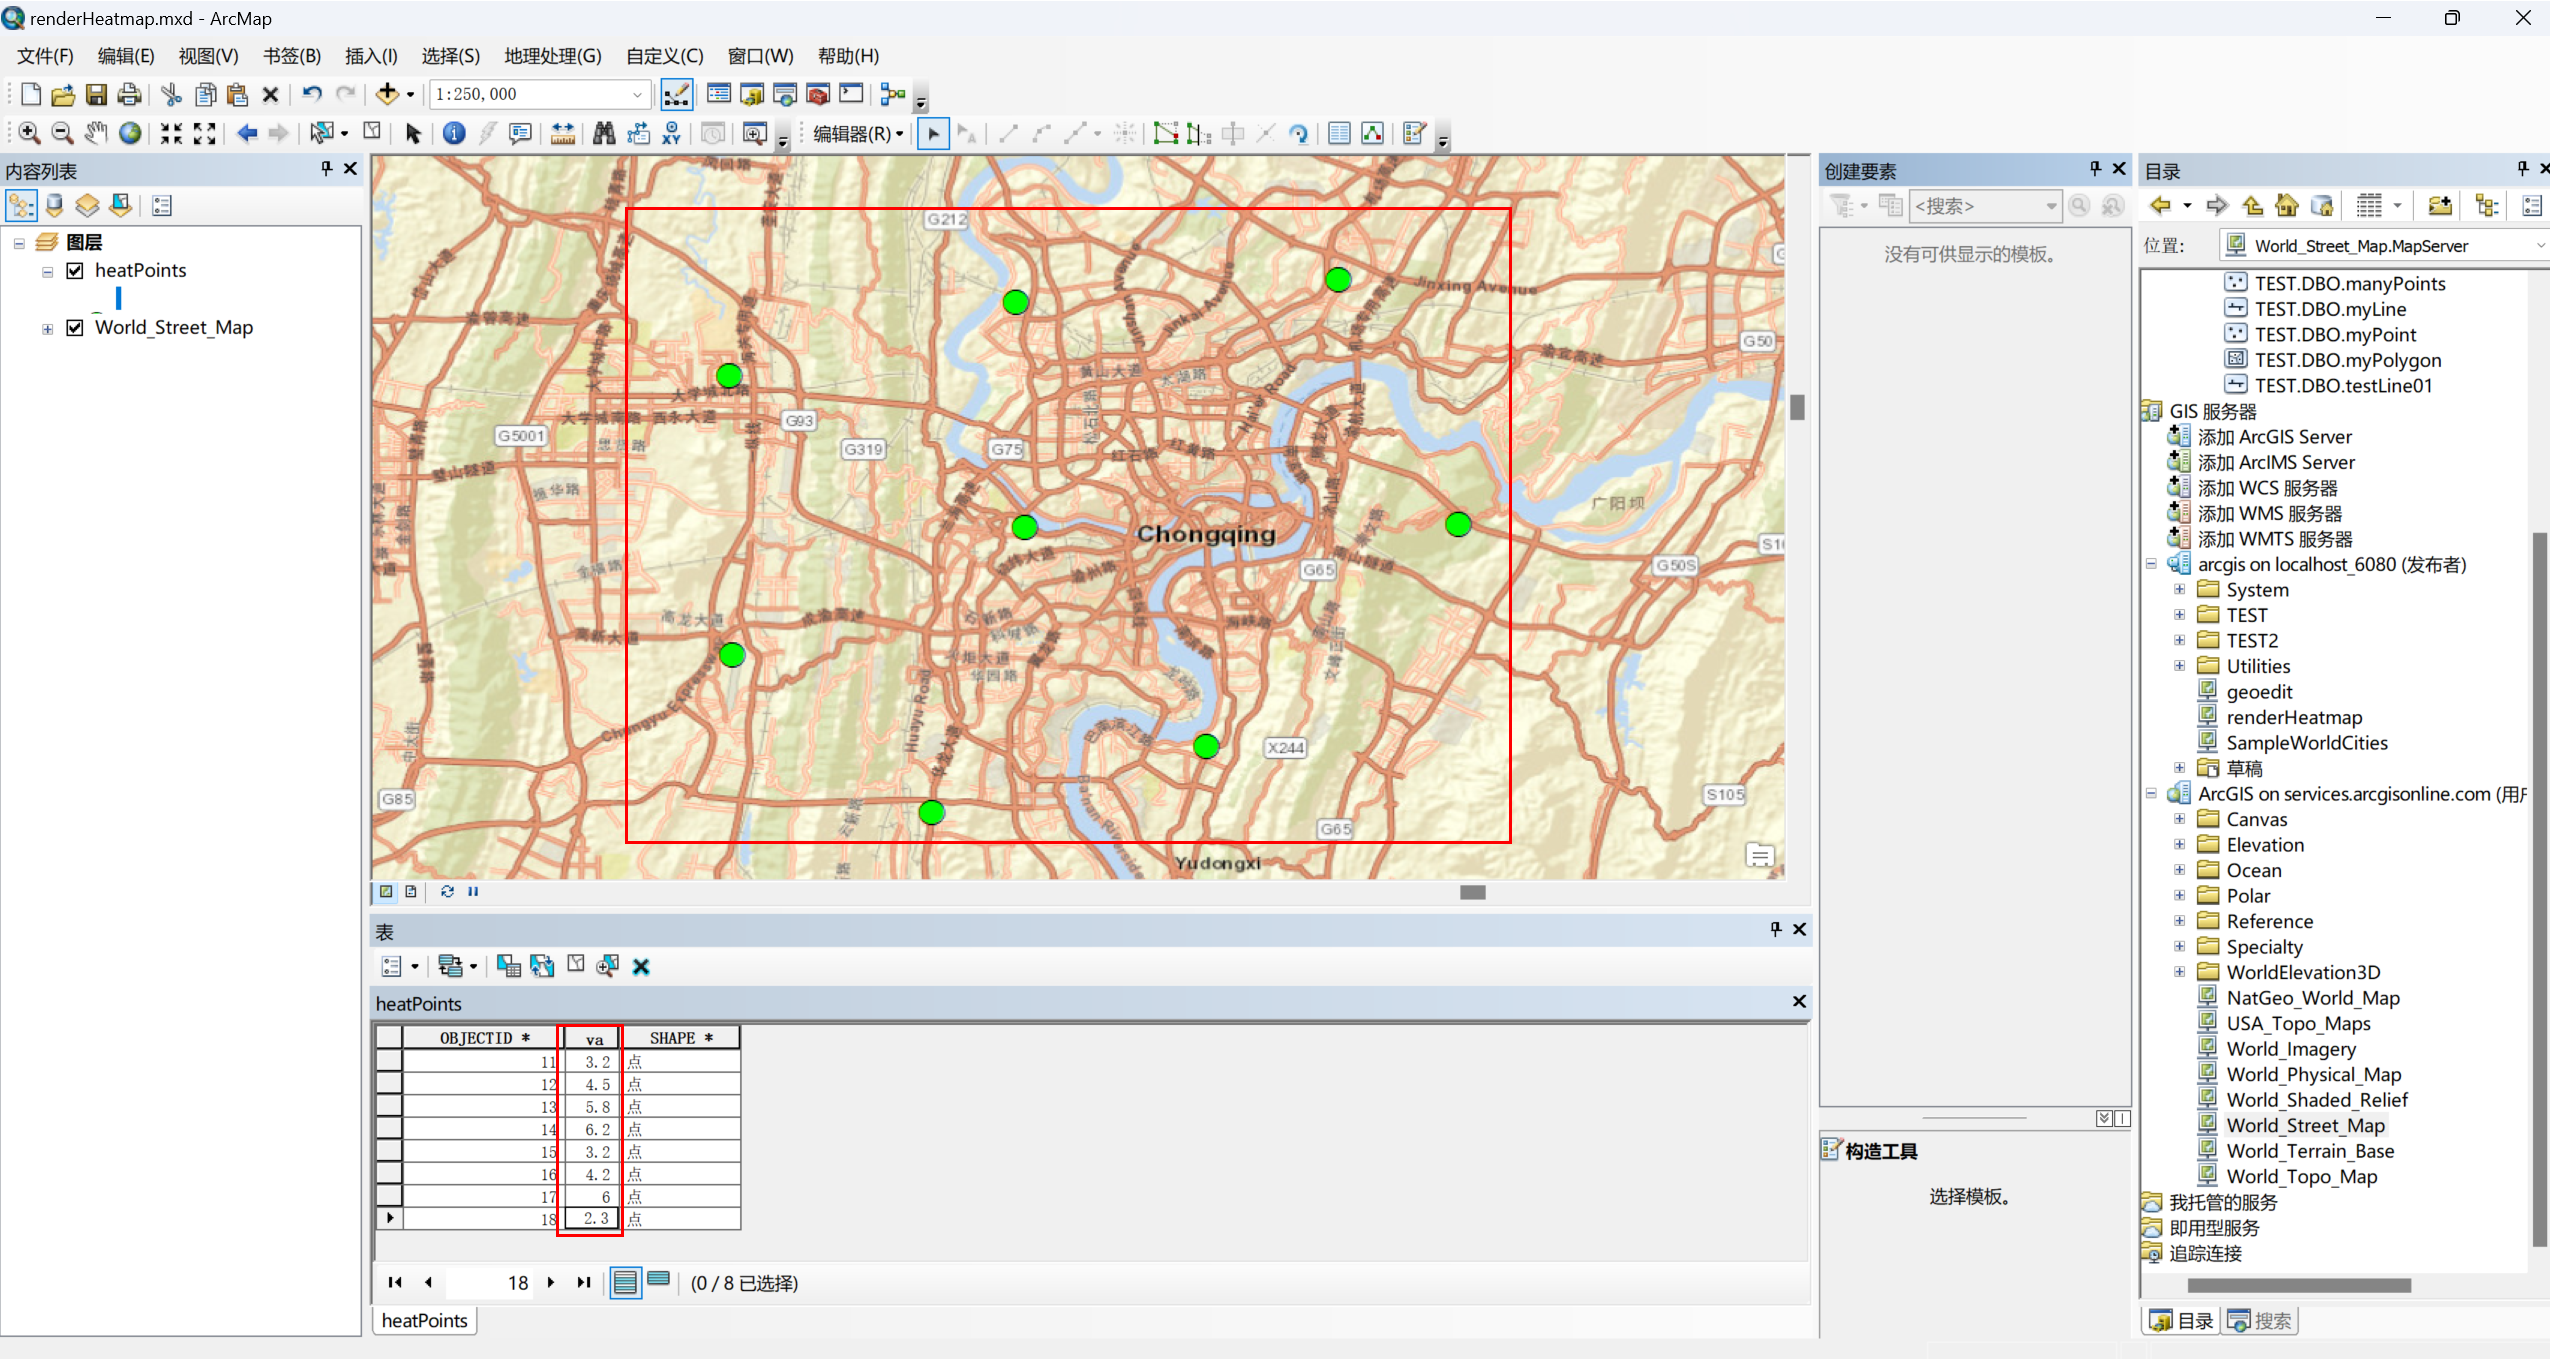
(5)编辑点要素并添加属性值
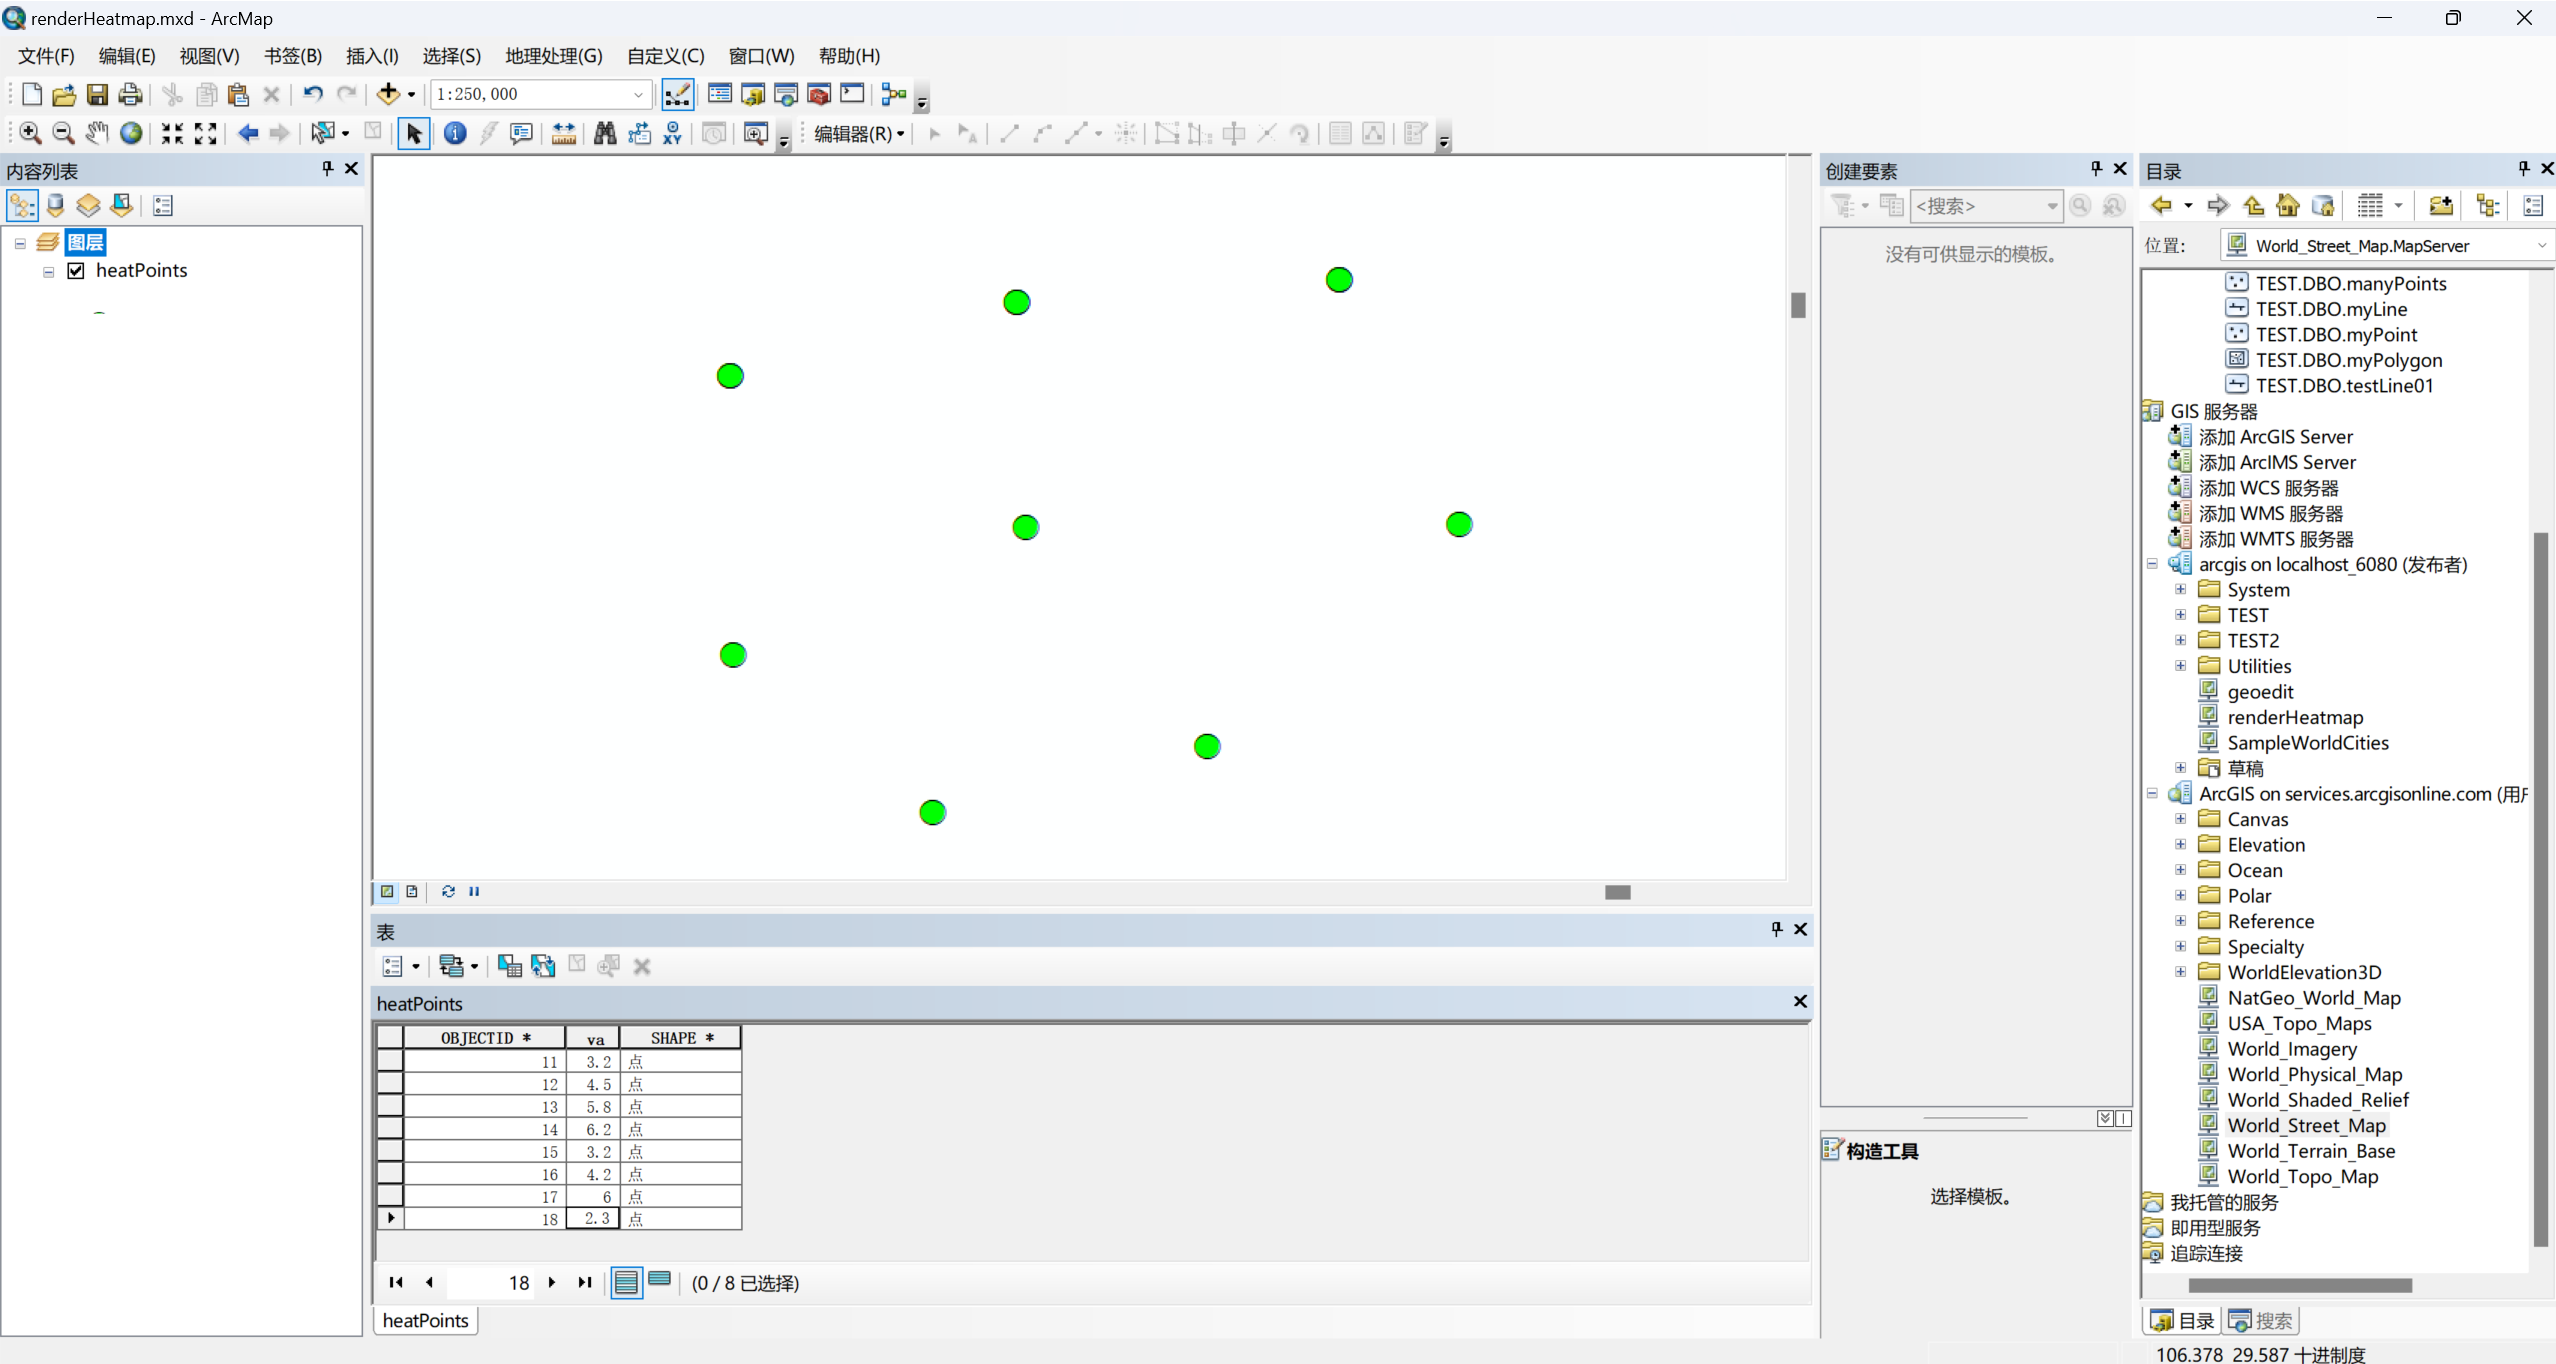
(6)移除底图图层
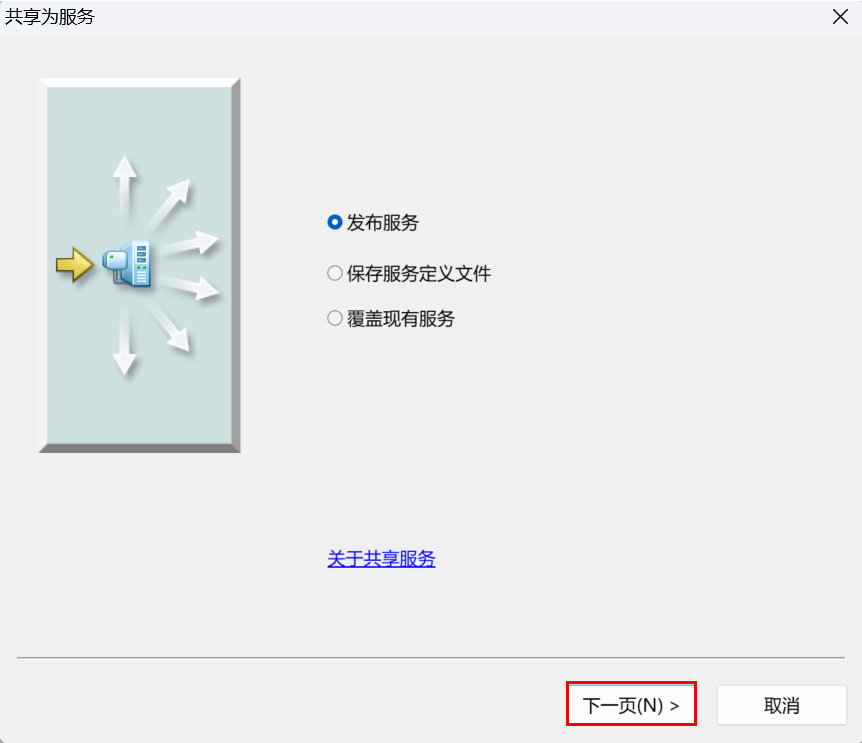
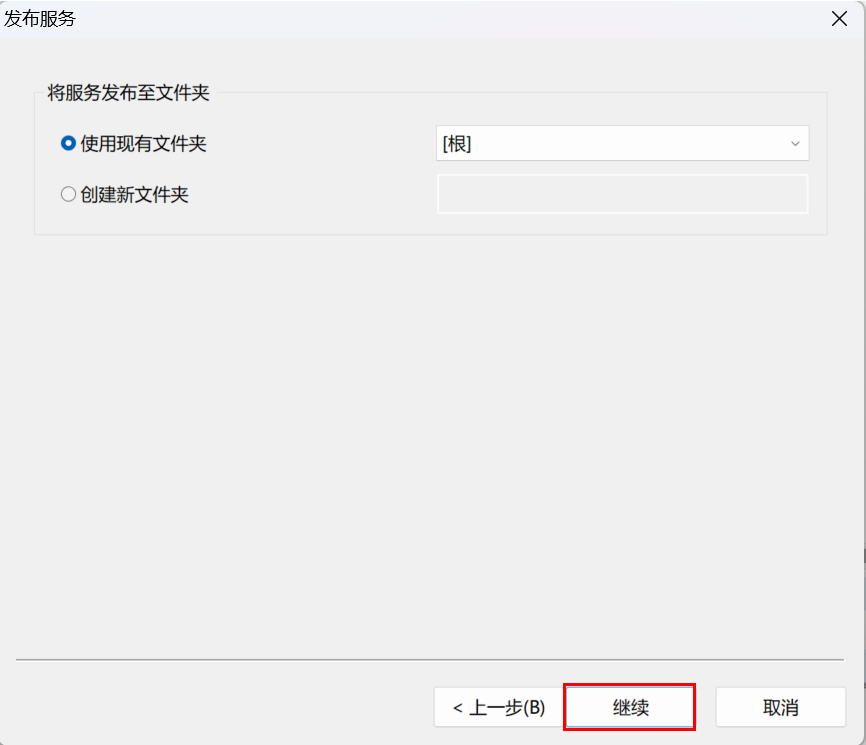
2.ArcGIS Server发布点要素

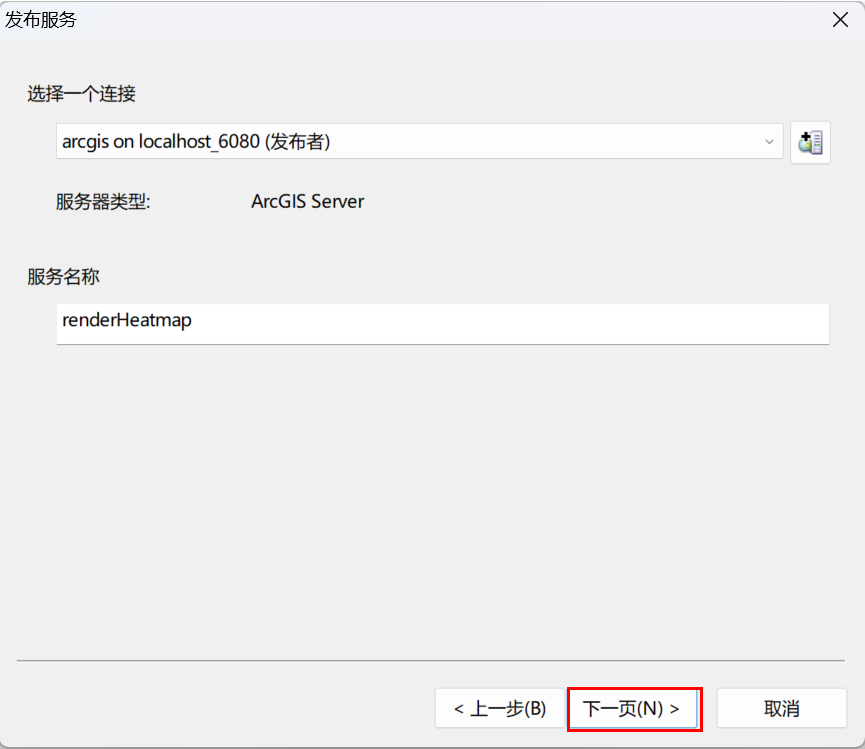
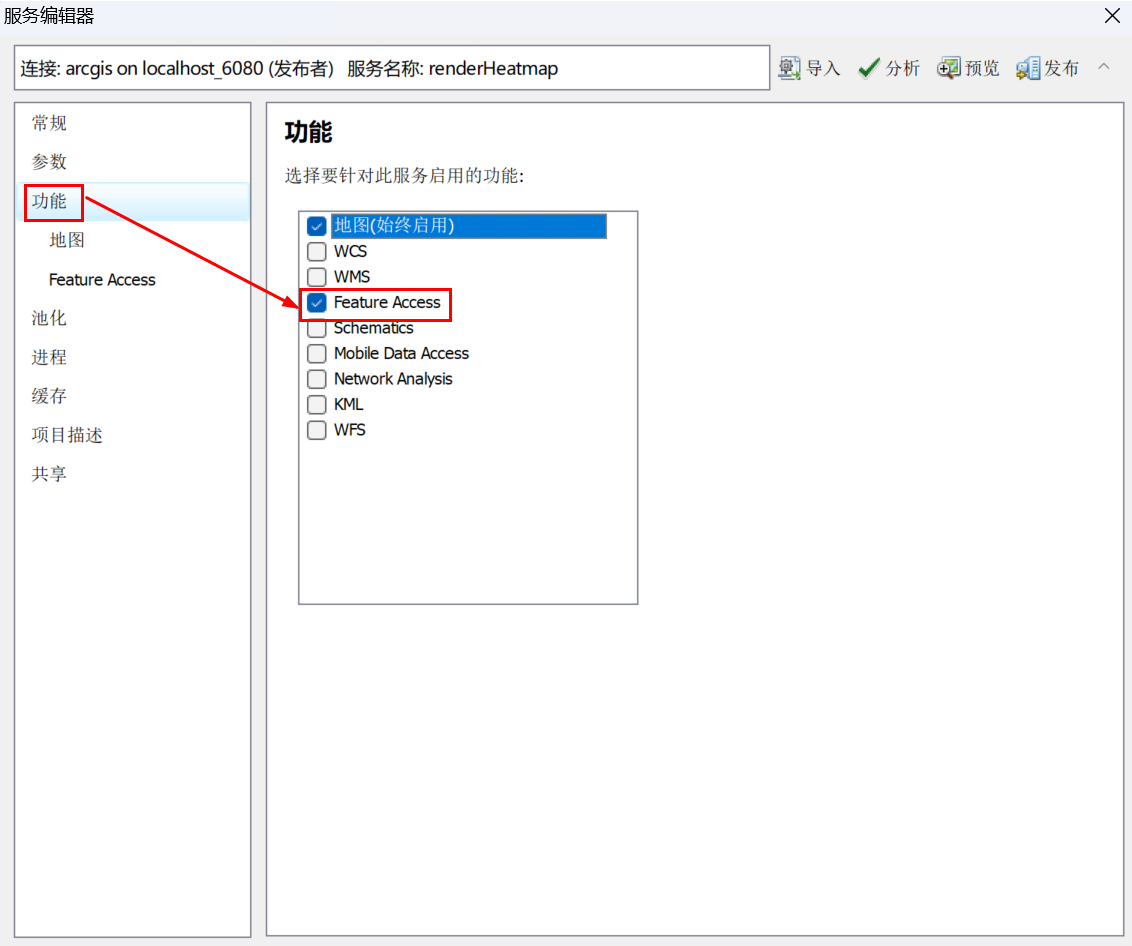
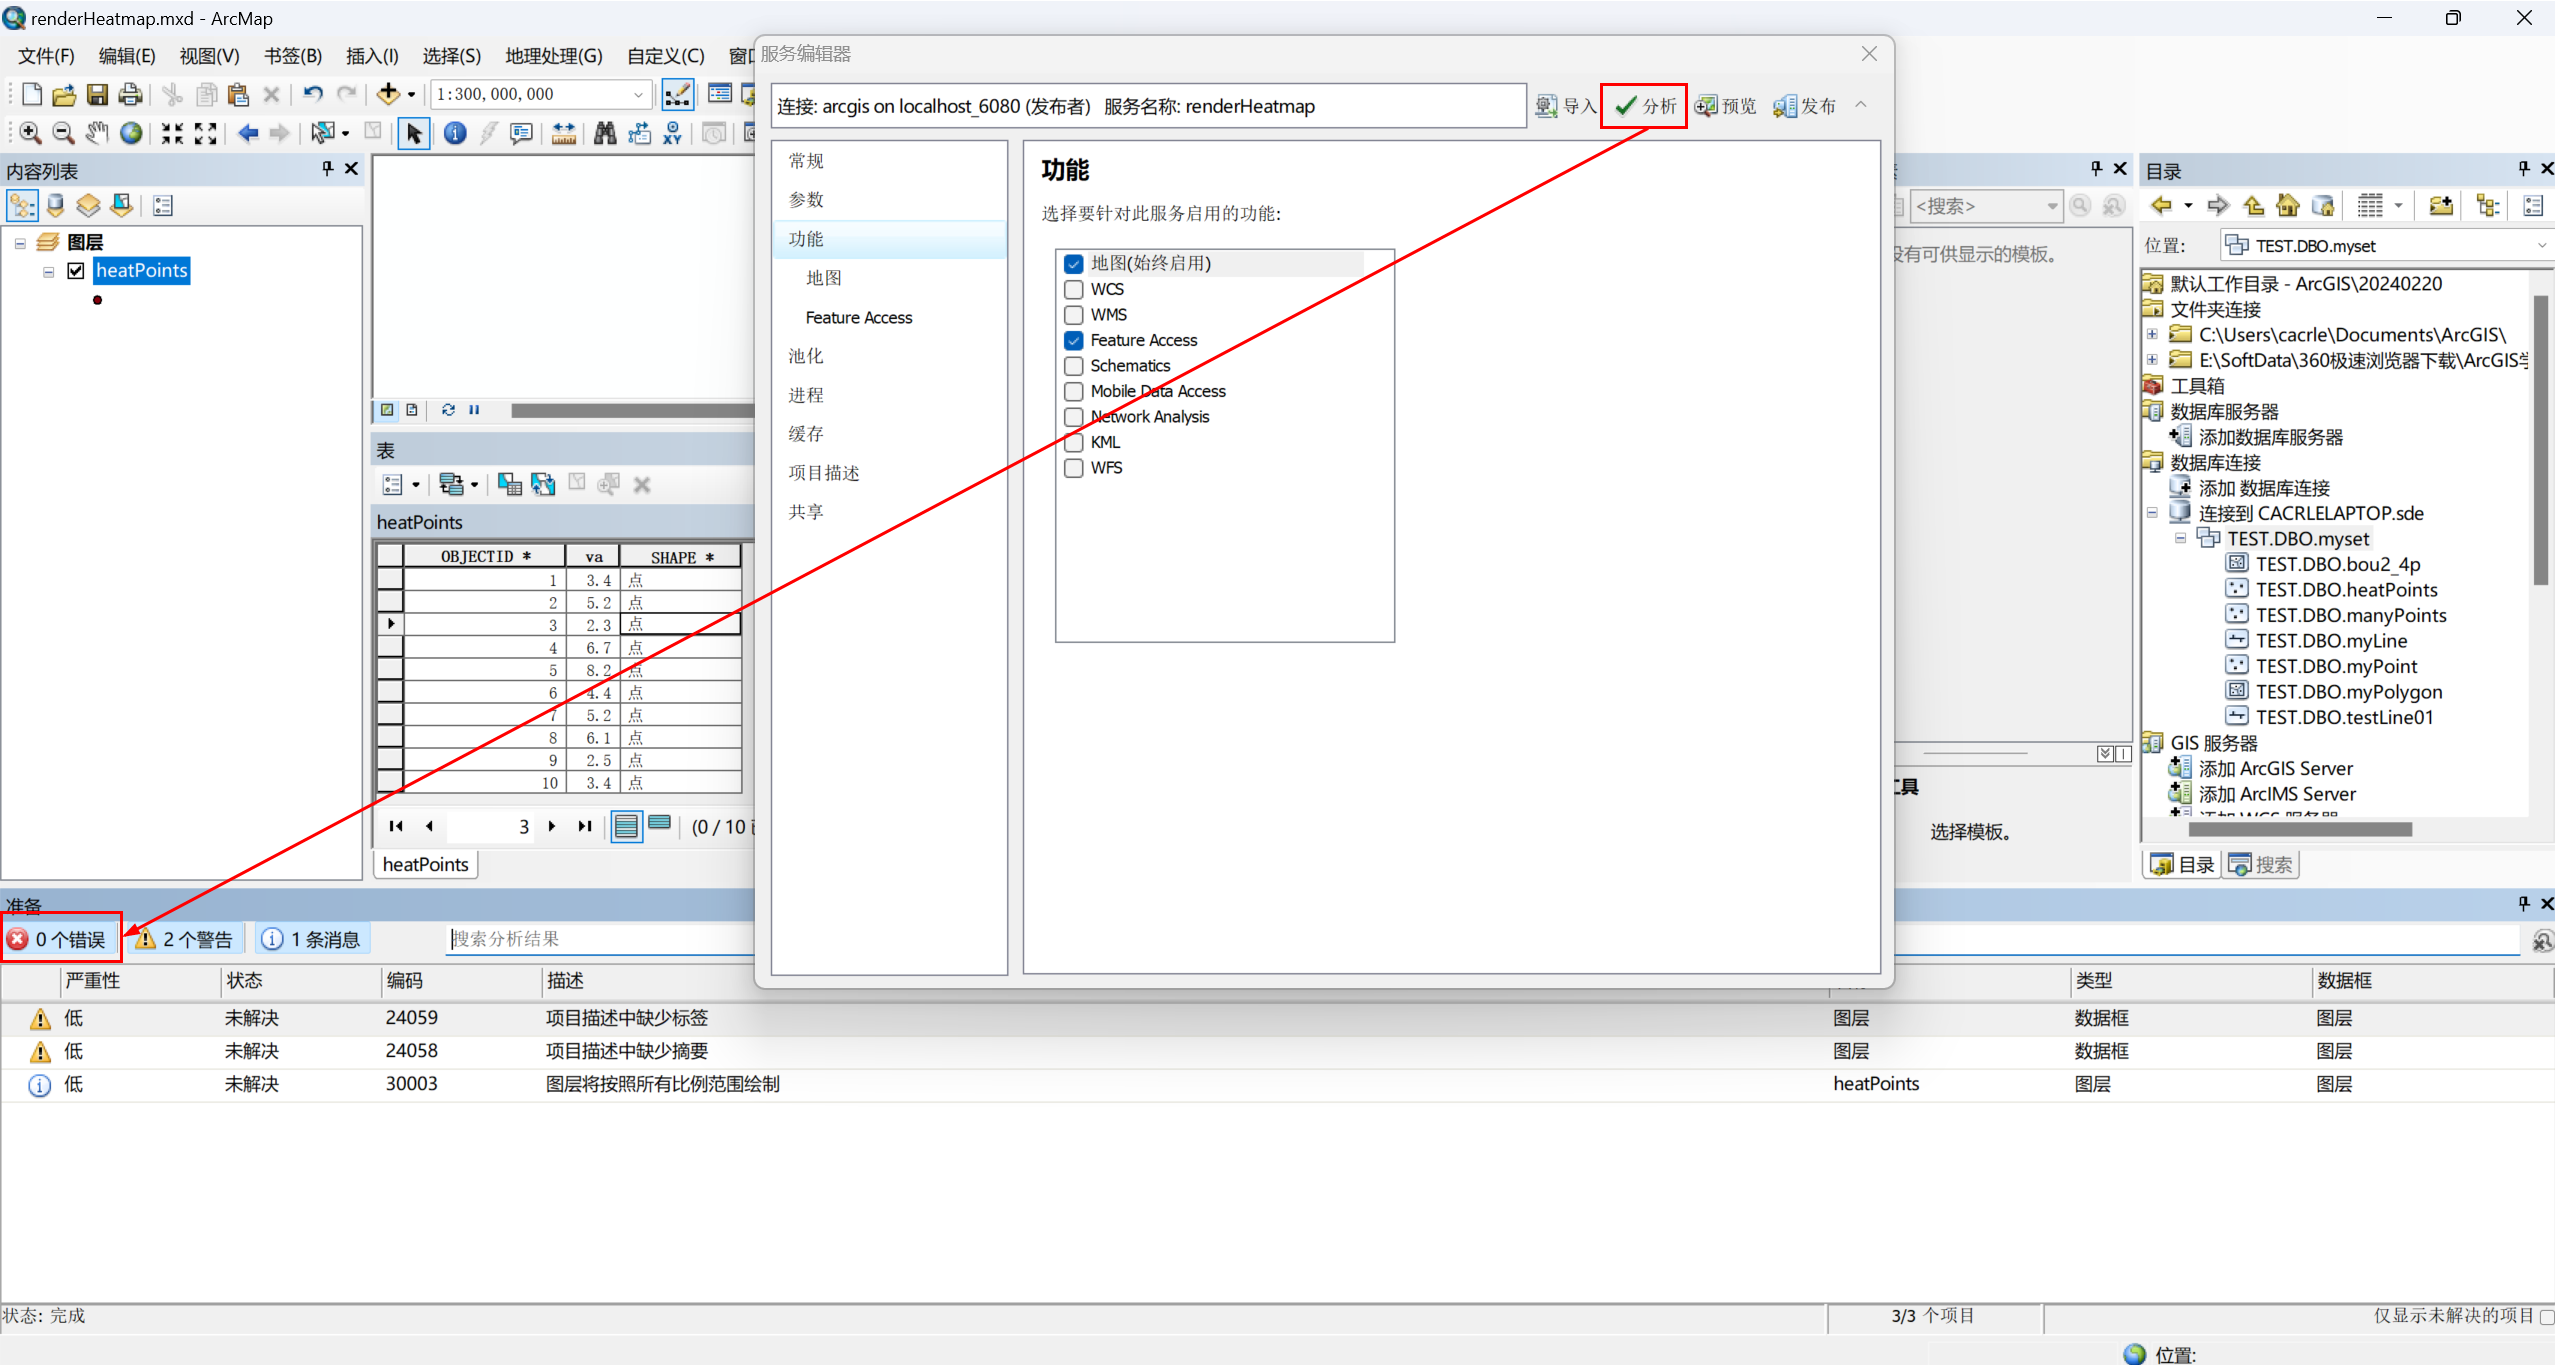
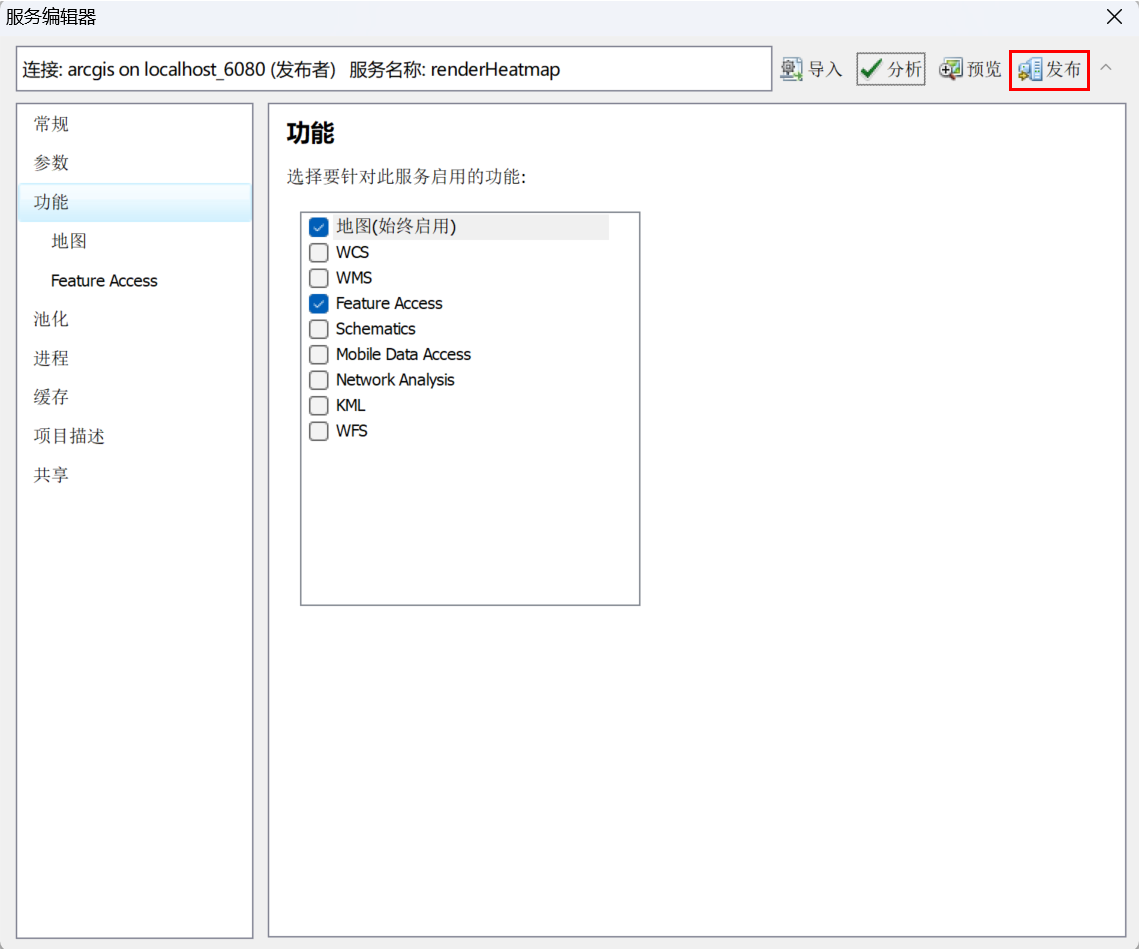
在ArcGIS Server中查看。
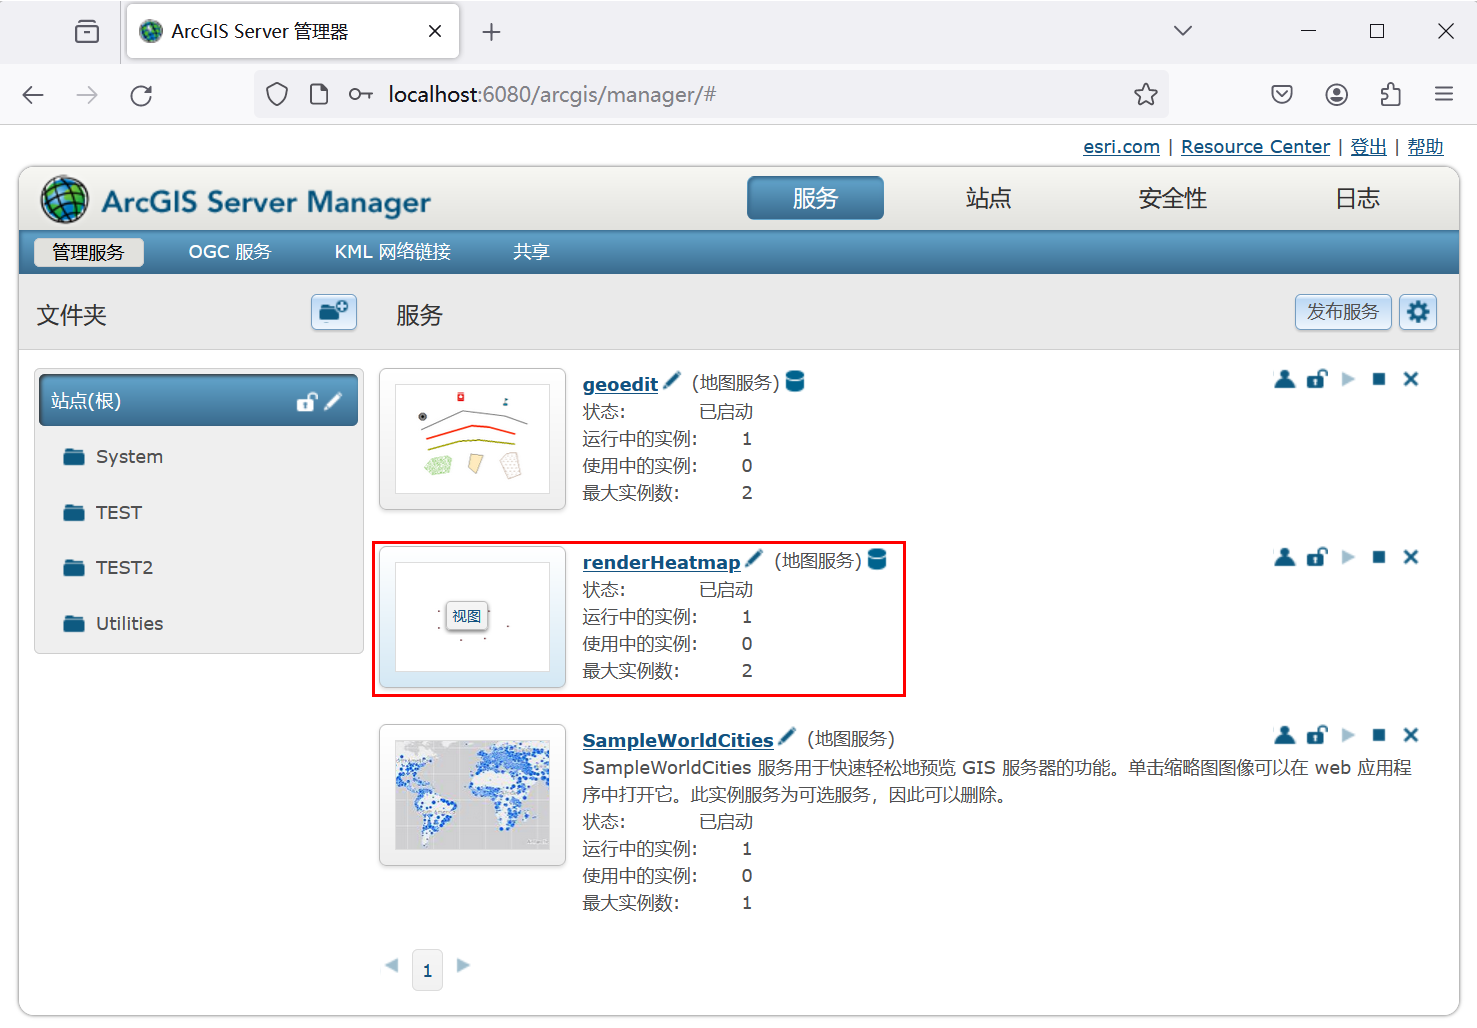
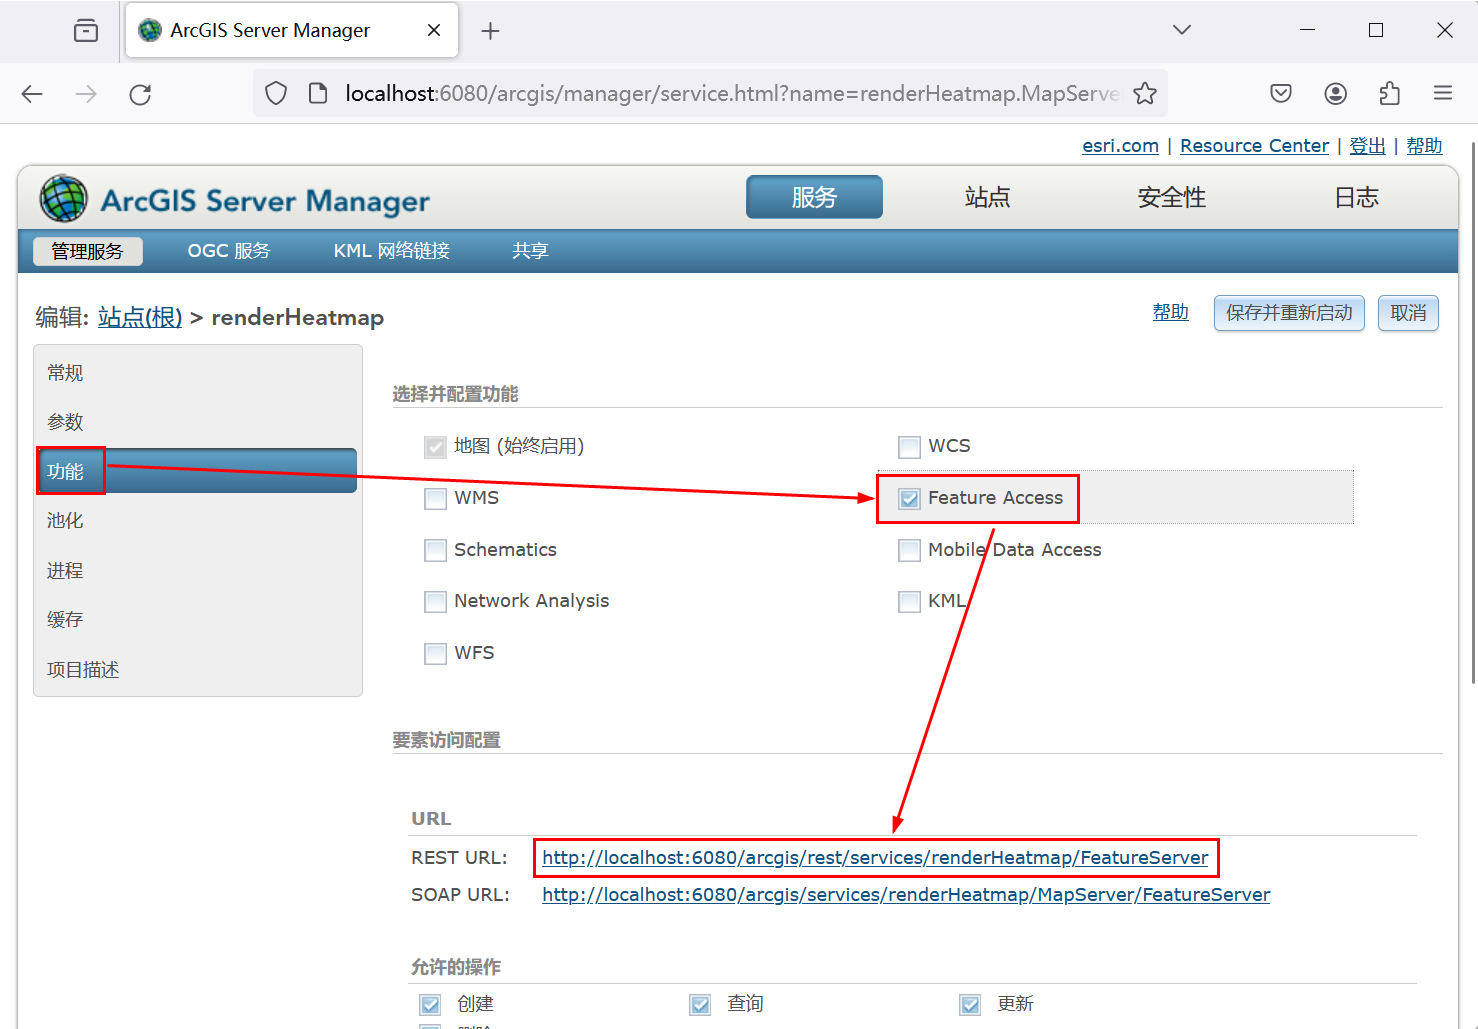
REST URL:http://localhost:6080/arcgis/rest/services/renderHeatmap/FeatureServer
3.ArcgisForJS将ArcGIS创建的点要素渲染为热力图
(1)实现代码
<html lang="en">
<head>  <meta charset="utf-8" />  <meta name="viewport" content="initial-scale=1,maximum-scale=1,user-scalable=no" />  <title>Intro to heatmap | Sample | ArcGIS Maps SDK for JavaScript 4.28</title>  <link rel="stylesheet" href="https://js.arcgis.com/4.28/esri/themes/light/main.css" />  <style>  html,  body,  #viewDiv {  padding: 0;  margin: 0;  height: 100%;  width: 100%;  }  </style>  <script src="https://js.arcgis.com/4.28/"></script>  <script>  require(["esri/Map", "esri/layers/FeatureLayer", "esri/views/MapView", "esri/widgets/Legend"], (  Map,  FeatureLayer,  MapView,  Legend  ) => {  const url="http://localhost:6080/arcgis/rest/services/renderHeatmap/FeatureServer";  // Paste the url into a browser's address bar to download and view the attributes  // in the CSV file. These attributes include:  // * mag - magnitude  // * type - earthquake or other event such as nuclear test  // * place - location of the event  // * time - the time of the event  const template = {  title: "标题",  content: "值为{va}。"  };  // The heatmap renderer assigns each pixel in the view with  // an intensity value. The ratio of that intensity value  // to the maxPixel intensity is used to assign a color  // from the continuous color ramp in the colorStops property  const renderer = {  type: "heatmap",  field: "va",  colorStops: [  { color: "rgba(63, 40, 102, 0)", ratio: 0 },  { color: "#472b77", ratio: 0.083 },  { color: "#4e2d87", ratio: 0.166 },  { color: "#563098", ratio: 0.249 },  { color: "#5d32a8", ratio: 0.332 },  { color: "#6735be", ratio: 0.415 },  { color: "#7139d4", ratio: 0.498 },  { color: "#7b3ce9", ratio: 0.581 },  { color: "#853fff", ratio: 0.664 },  { color: "#a46fbf", ratio: 0.747 },  { color: "#c29f80", ratio: 0.83 },  { color: "#e0cf40", ratio: 0.913 },  { color: "#ffff00", ratio: 1 }  ],  maxDensity: 0.01,  minDensity: 0  };  const layer = new FeatureLayer({  url: url,  title: "test heatmap",  popupTemplate: template,  renderer: renderer,  labelsVisible: true,  labelingInfo: [  {  symbol: {  type: "text", // autocasts as new TextSymbol()  color: "white",  font: {  family: "Noto Sans",  size: 8  },  haloColor: "#472b77",  haloSize: 0.75  },  labelPlacement: "center-center",  labelExpressionInfo: {  expression: "Text($feature.va, '#.0')"  },  where: "va > 4"  }  ]  });  const map = new Map({  basemap: "gray-vector",  layers: [layer]  });  const view = new MapView({  container: "viewDiv",  center: [106.49446091380375, 29.559187456407138],  zoom: 10,  map: map  });  view.ui.add(  new Legend({  view: view  }),  "bottom-left"  );  点击地图获取经纬度坐标  //view.on("click", evt => {  //    let mapPoint = evt.mapPoint;  //    alert(`经度:${mapPoint.longitude},纬度${mapPoint.latitude}`);  //});  });  </script>
</head>  <body>  <div id="viewDiv"></div>
</body>
</html>
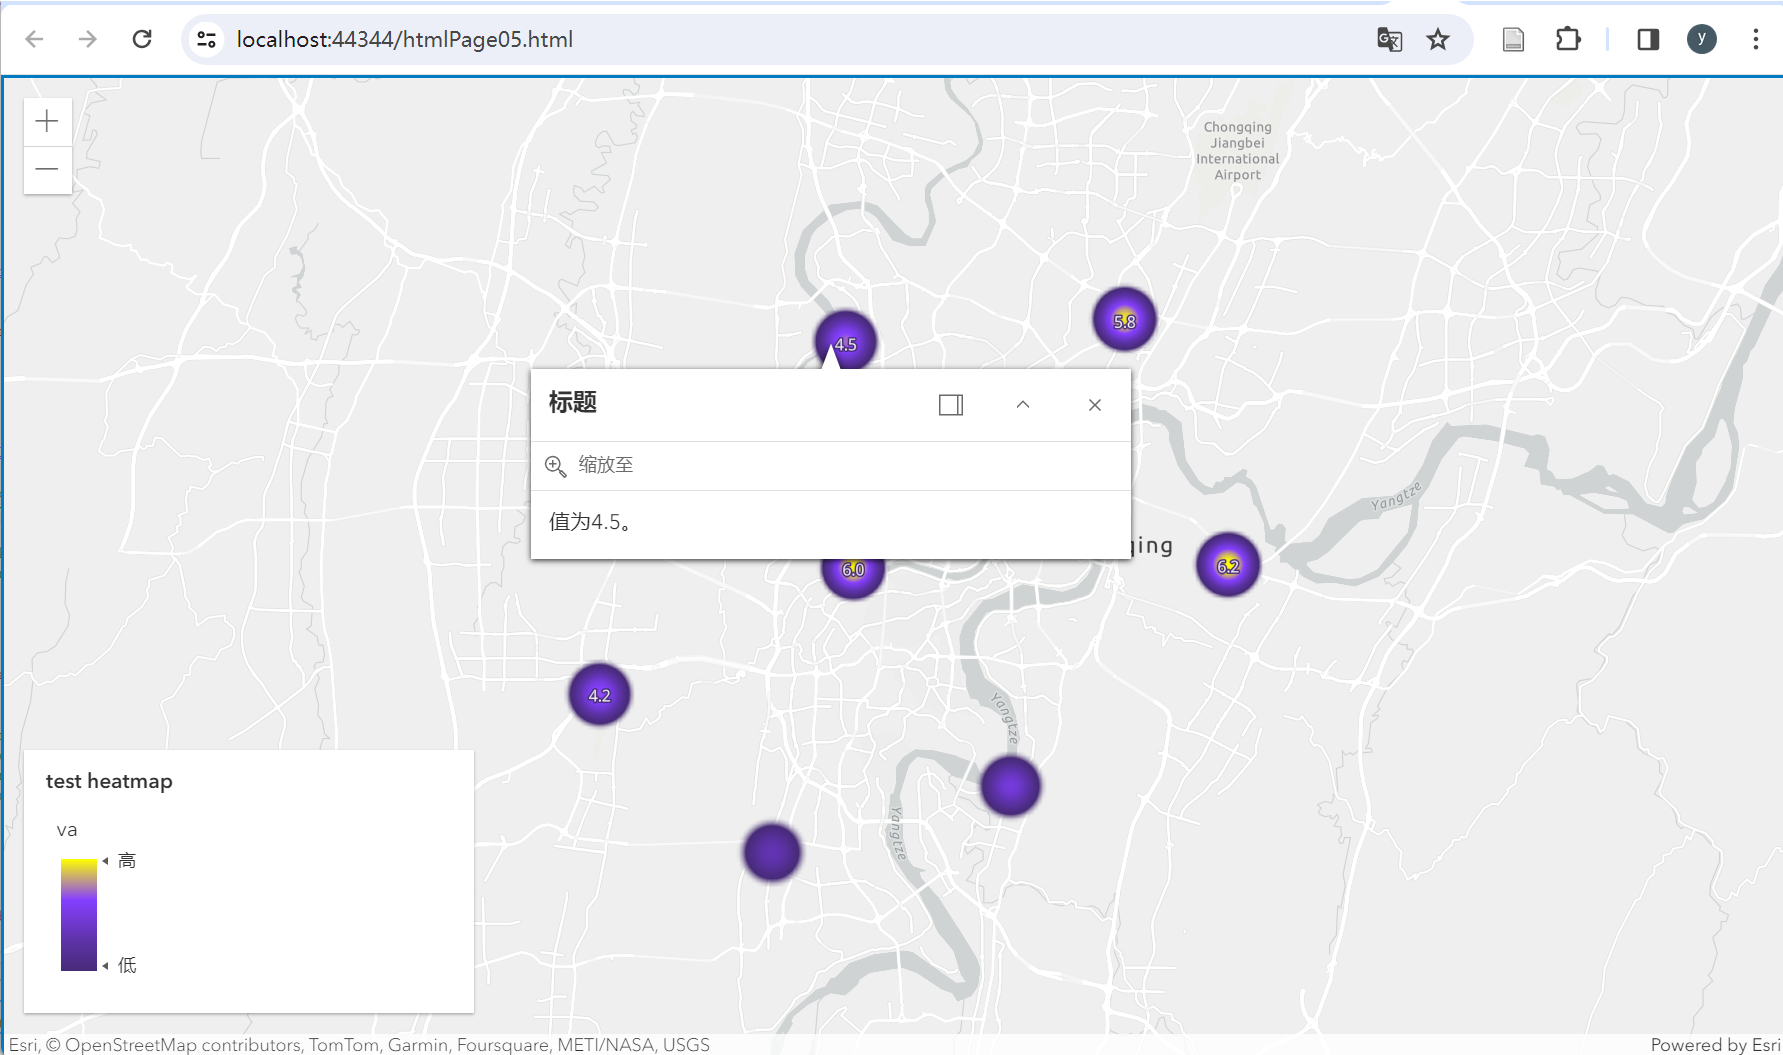
(2)实现结果
参考资料:
[1] 一入GIS深似海. 不一样的前端,JavaScript之arcgis api教程; 2020-11-02 [accessed 2024-02-24].
[2] HPUGIS. ArcGIS API For JS 之render(符号渲染); 2018-07-03 [accessed 2024-02-24].
[3] 风衡. JS API 4.0地图渲染之符号(一); 2016-08-22 [accessed 2024-02-24].
[4] GIS_KHF. JS API 4.x地图渲染之符号(二)(转载); 2016-11-10 [accessed 2024-02-24].
[5] 不睡觉的怪叔叔. ArcGIS API For JavaScript官方文档(二十)之图形和要素图层——③符号和渲染器; 2018-04-13 [accessed 2024-02-24].