Prometheus+grafana配置监控系统
使用docker compose安装
方便拓展, 配置信息都放在在 /docker/prometheus 目录下
1.目录结构如下
.
├── conf
│   └── prometheus.yml
├── grafana_data
├── prometheus_data
└── prometheus_grafana.yaml
2.创建目录文件
mkdir /docker/prometheus && chmod 777 /docker/prometheuscd /docker/prometheus && mkdir grafana_data prometheus_data && chmod 777 grafana_data prometheus_data2.1 创建docker compose文件
touch prometheus_grafana.yaml
写入
version: "3.7"networks:prometheus:services:node-exporter:image: prom/node-exporter:latestcontainer_name: "node-exporter0"ports:- "9101:9100" #按需修改, 宿主机端口: 容器端口restart: alwaysnetworks:- prometheusprometheus:image: prom/prometheus:latestcontainer_name: "prometheus0"restart: alwaysports:- "9090:9090"volumes:- "./conf/prometheus.yml:/etc/prometheus/prometheus.yml"- "./prometheus_data:/prometheus"networks:- prometheusgrafana:image: grafana/grafana:latestcontainer_name: "grafana0"ports:- "3000:3000"restart: alwaysvolumes:- "./grafana_data:/var/lib/grafana"networks:- prometheus
2.2在/docker/prometheus 目录下
mkdir conf && touch conf/prometheus.ymlvim mkdir conf && touch conf/prometheus.yml
写入配置, 注意修改中文注释位置
global:scrape_interval: 15s # Set the scrape interval to every 15 seconds. Default is every 1 minute.evaluation_interval: 15s # Evaluate rules every 15 seconds. The default is every 1 minute.# scrape_timeout is set to the global default (10s).# Alertmanager configuration
alerting:alertmanagers:- static_configs:- targets:# - alertmanager:9093# Load rules once and periodically evaluate them according to the global 'evaluation_interval'.
rule_files:
# - "first_rules.yml"
# - "second_rules.yml"# A scrape configuration containing exactly one endpoint to scrape:
# Here it's Prometheus itself.
scrape_configs:- job_name: 'prometheus'static_configs:- targets: [ 'localhost:9090' ]- job_name: test            #按需修改, 任务名static_configs:- targets: ['ip:9101']      #端口, 上面prometheus_grafana的node-exporter的port设置是9101labels:instance: ins-1         #实例名
启动
docker-compose -f prometheus_grafana.yaml up -d
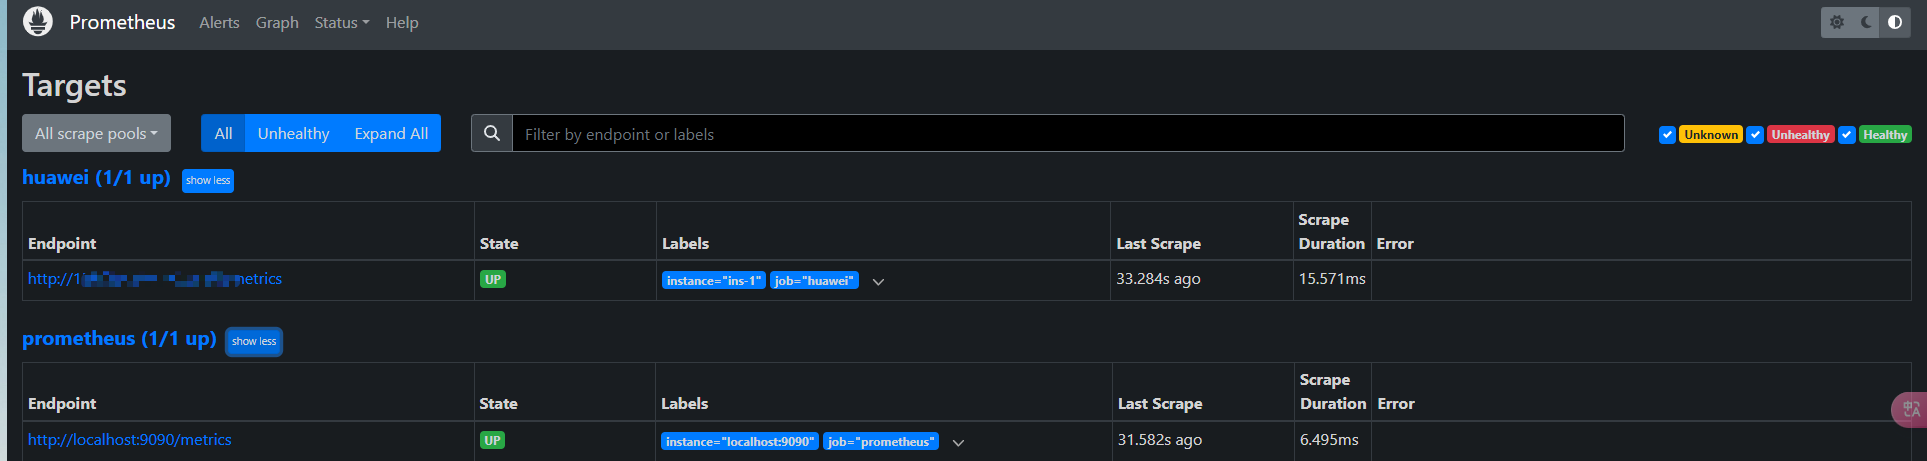
3.prometheus信息
访问http://ip:9090/targets
能看到node-exporter的推送信息
4.登录grafana
访问http://ip:3000
账号密码默认admin
4.1配置数据源
在connection–> datasource–> Add data source选择 Prometheus
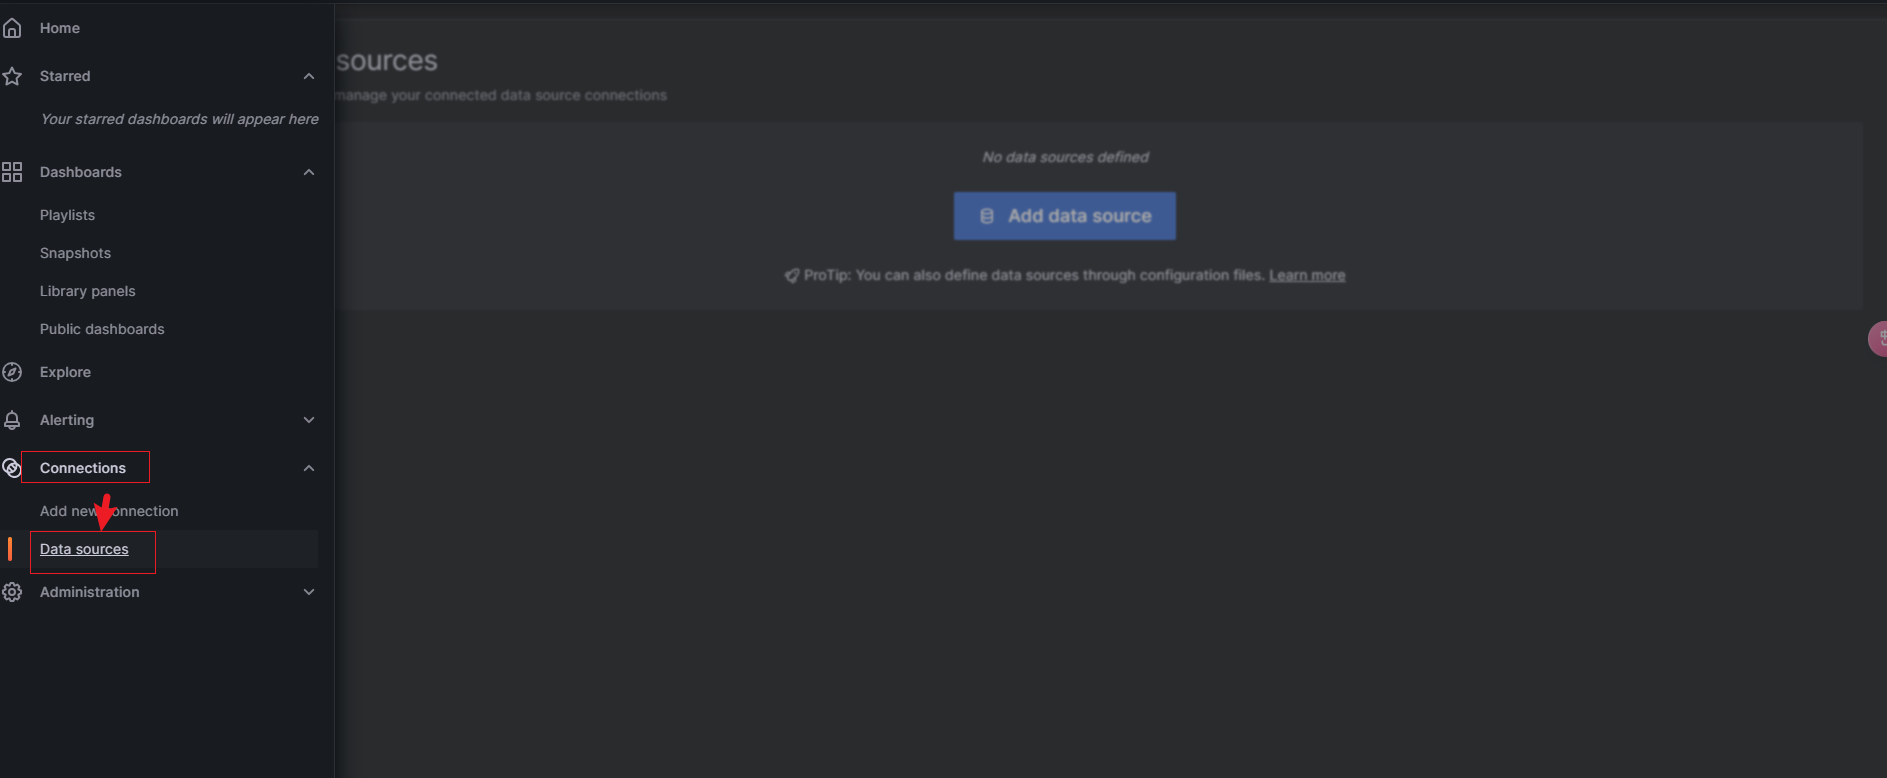
输入Prometheus地址, 测试成功

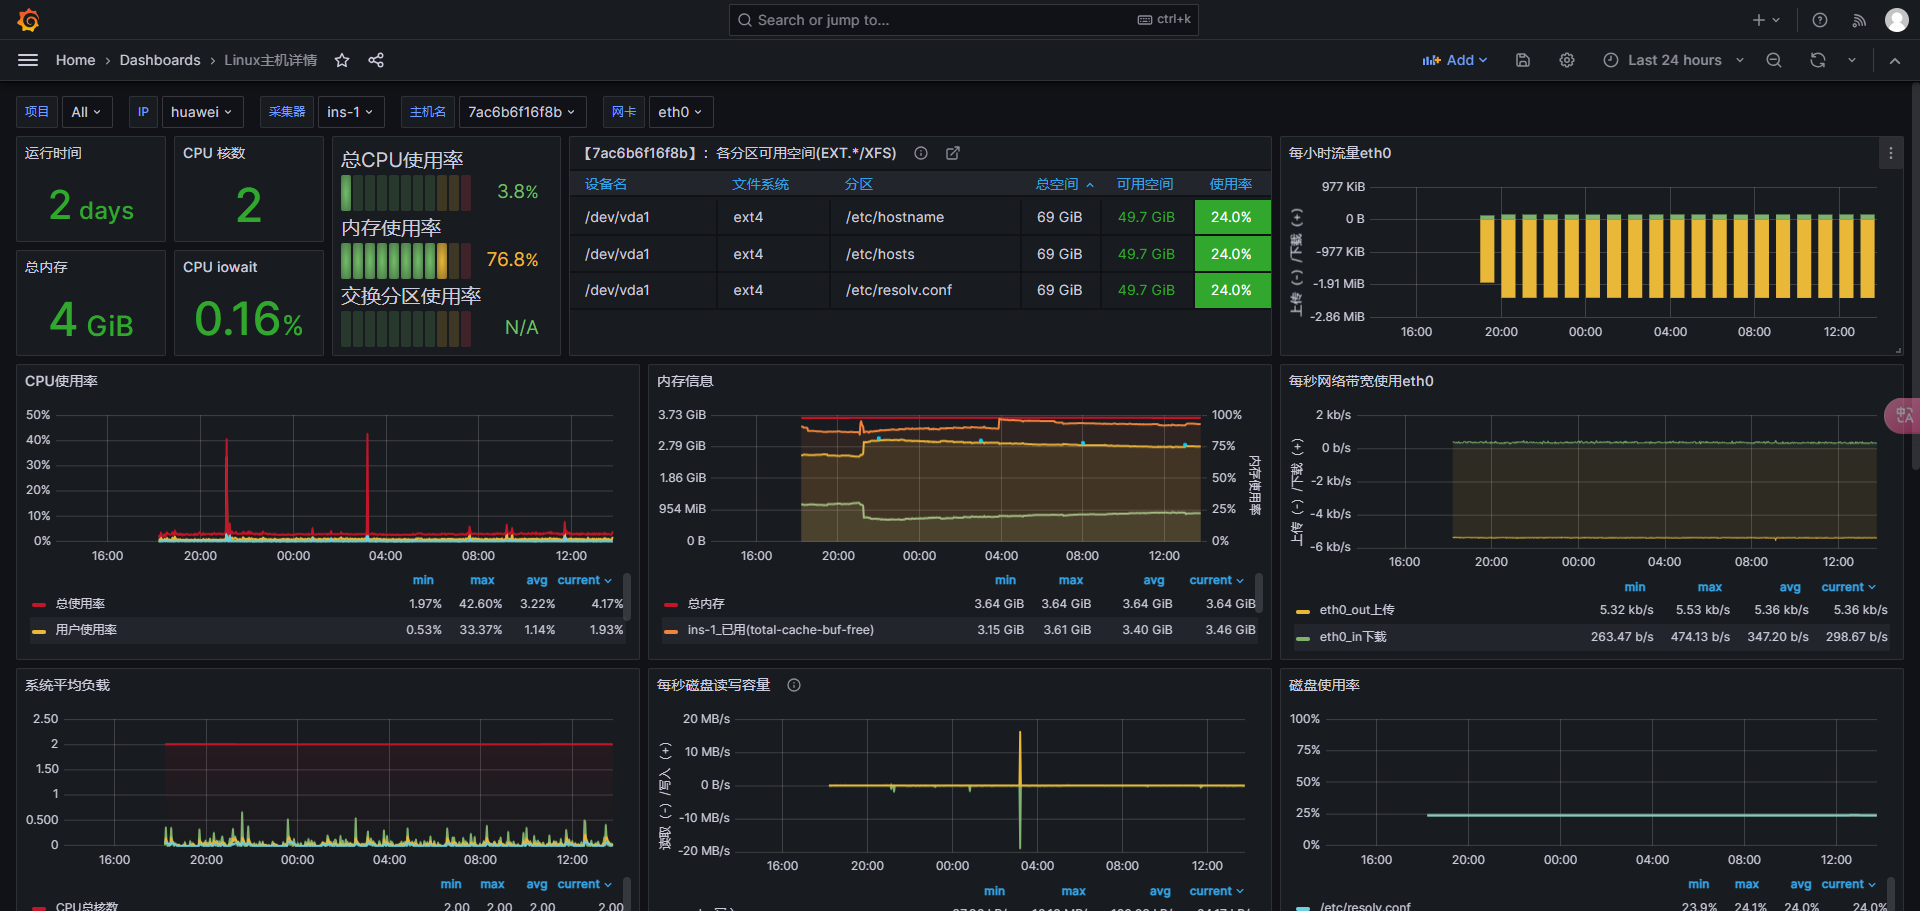
4.2. 配置dashboard
回到datasource页面, Build a dashboard–>Import a dashboard–>输入12633选择一个面板, 导入刚刚Prometheus


就能看到监控面板了