R语言【paleobioDB】——pbdb_orig_ext():绘制随着时间变化而出现的新类群
Package paleobioDB version 0.7.0
paleobioDB 包在2020年已经停止更新,该包依赖PBDB v1 API。
可以选择在Index of /src/contrib/Archive/paleobioDB (r-project.org)下载安装包后,执行本地安装。
Usage
pbdb_orig_ext (data, rank,
temporal_extent, res, orig_ext,
colour="#0000FF30", bord="#0000FF", do.plot=TRUE)
Arguments
参数【data】:输入的数据,数据帧格式。可以通过 pbdb_occurrences() 函数 传参 show = c("phylo", "ident") 获得数据。
参数【rank】:设置感兴趣的分类阶元。可选项包括:“species”,“genus”,“family”,“order”,“class” 和 “phylum”。默认值为 “species”。
参数【temporal_extent】:设置时间范围,向量型(min,max)。
参数【res】:数值型。设置时间范围的时间段刻度。
参数【orig_ext】:1 表示出现,2 表示灭绝。
参数【colour】:改变图中柱子的颜色。默认为 skyblue2。
参数【bord】:设置图形边界的颜色。
参数【do.plot】:TRUE/FALSE。默认为 TRUE。
Value
返回一个数据帧,在选定的时间范围内,展示目标分类阶元的第一次出现次数和灭绝次数。并且绘制图形。
Example
library(paleobioDB)
library(RCurl)options(RCurlOptions = list(cainfo = system.file("CurlSSL", "cacert.pem", package = "RCurl")))canidae<-  pbdb_occurrences (limit="all", vocab="pbdb",
+                              base_name="Canidae", show=c("phylo", "ident"))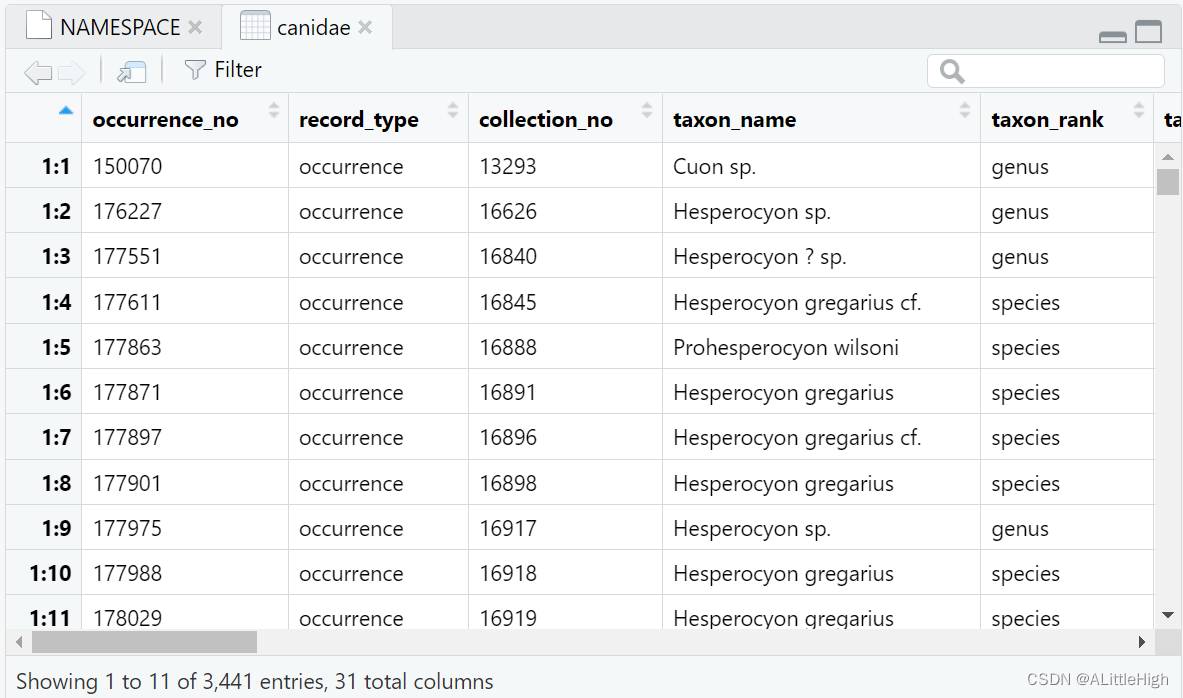
> pbdb_orig_ext (canidae, rank="genus", temporal_extent=c(0, 10),
+                res=1, orig_ext=1) new ext
1-2 to 0-1    2   2
2-3 to 1-2    0   0
3-4 to 2-3    3   2
4-5 to 3-4    8   6
5-6 to 4-5    3   4
6-7 to 5-6    5   0
7-8 to 6-7    0   0
8-9 to 7-8    0   0
9-10 to 8-9   0   0
> pbdb_orig_ext (canidae, rank="species", temporal_extent=c(0, 10),
+                res=1, orig_ext=2) new ext
1-2 to 0-1    7  14
2-3 to 1-2   10  14
3-4 to 2-3   39  13
4-5 to 3-4   24  16
5-6 to 4-5   14   9
6-7 to 5-6   21   0
7-8 to 6-7    0   0
8-9 to 7-8    1   0
9-10 to 8-9   2   0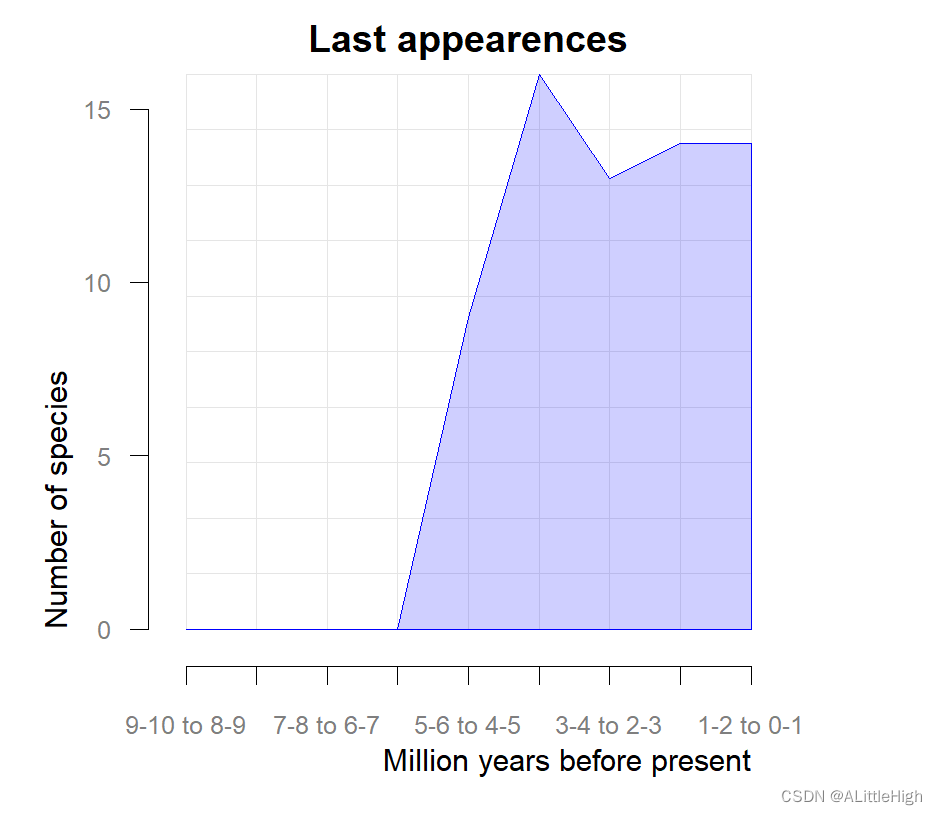
Page
function (data, rank, temporal_extent, res, orig_ext = 1, colour = "#0000FF30", bord = "#0000FF", do.plot = TRUE)
{temporal_range <- pbdb_temp_range(data = data, rank = rank, do.plot = FALSE)te <- temporal_extentsequence <- seq(from = min(te), to = (max(te)), by = res)intv <- data.frame(min = sequence[1:length(sequence) - 1], max = sequence[2:length(sequence)])labels1 <- paste(intv[, 1], intv[, 2], sep = "-")labels2 <- paste(labels1[2:(length(labels1))], labels1[1:(length(labels1) - 1)], sep = " to ")res_sp <- list()for (i in 1:dim(intv)[1]) {intvv <- intv[i, ]cases1 <- which(as.numeric(temporal_range$min) >= intvv$min & as.numeric(temporal_range$min) <= intvv$max & as.numeric(temporal_range$max) >= intvv$max)cases2 <- which(as.numeric(temporal_range$min) <= intvv$min & as.numeric(temporal_range$max) <= intvv$max & as.numeric(temporal_range$max) >= intvv$min)cases3 <- which(as.numeric(temporal_range$min) <= intvv$min & as.numeric(temporal_range$max) >= intvv$max)cases <- unique(c(cases1, cases2, cases3))sps <- temporal_range[cases, ]res_sp[[i]] <- sps}change <- data.frame()for (i in length(res_sp):2) {new_taxa <- length(setdiff(row.names(res_sp[[i - 1]]), row.names(res_sp[[i]])))ext <- length(setdiff(row.names(res_sp[[i]]), row.names(res_sp[[i - 1]])))col <- c(new_taxa, ext)change <- rbind(change, col)}names(change) <- c("new", "ext")change <- change[rev(as.numeric(row.names(change))), ]row.names(change) <- labels2if (do.plot == TRUE) {ymx <- max(change[, orig_ext])ymn <- min(change[, orig_ext])xmx <- sequence[length(sequence) - 1]xmn <- sequence[2]plot.new()par(mar = c(5, 5, 2, 5), font.lab = 1, col.lab = "grey20", col.axis = "grey50", cex.axis = 0.8)plot.window(xlim = c(xmx, xmn), xaxs = "i", ylim = c(ymn, ymx), yaxs = "i")abline(v = seq(xmn, xmx, by = res), col = "grey90", lwd = 1)abline(h = seq(0, ymx, by = (ymx/10)), col = "grey90", lwd = 1)xx <- c(xmn, sequence[2:(length(sequence) - 1)], xmx)yy <- c(0, change[, orig_ext], 0)polygon(xx, yy, col = colour, border = bord)axis(1, line = 1, labels = labels2, at = xx[-c(1, length(xx))])axis(2, line = 1, las = 1)mtext("Million years before present", line = 3, adj = 1, side = 1)mtext(paste("Number of ", rank, sep = ""), line = 3, adj = 0, side = 2)title(ifelse(orig_ext == 1, "First appearences", "Last appearences"))}return(change)
}