【ECharts】折线图
文章目录
- 折线图1
- 折线图2
- 折线图3
- 示例
参考:
Echarts官网
Echarts 配置项
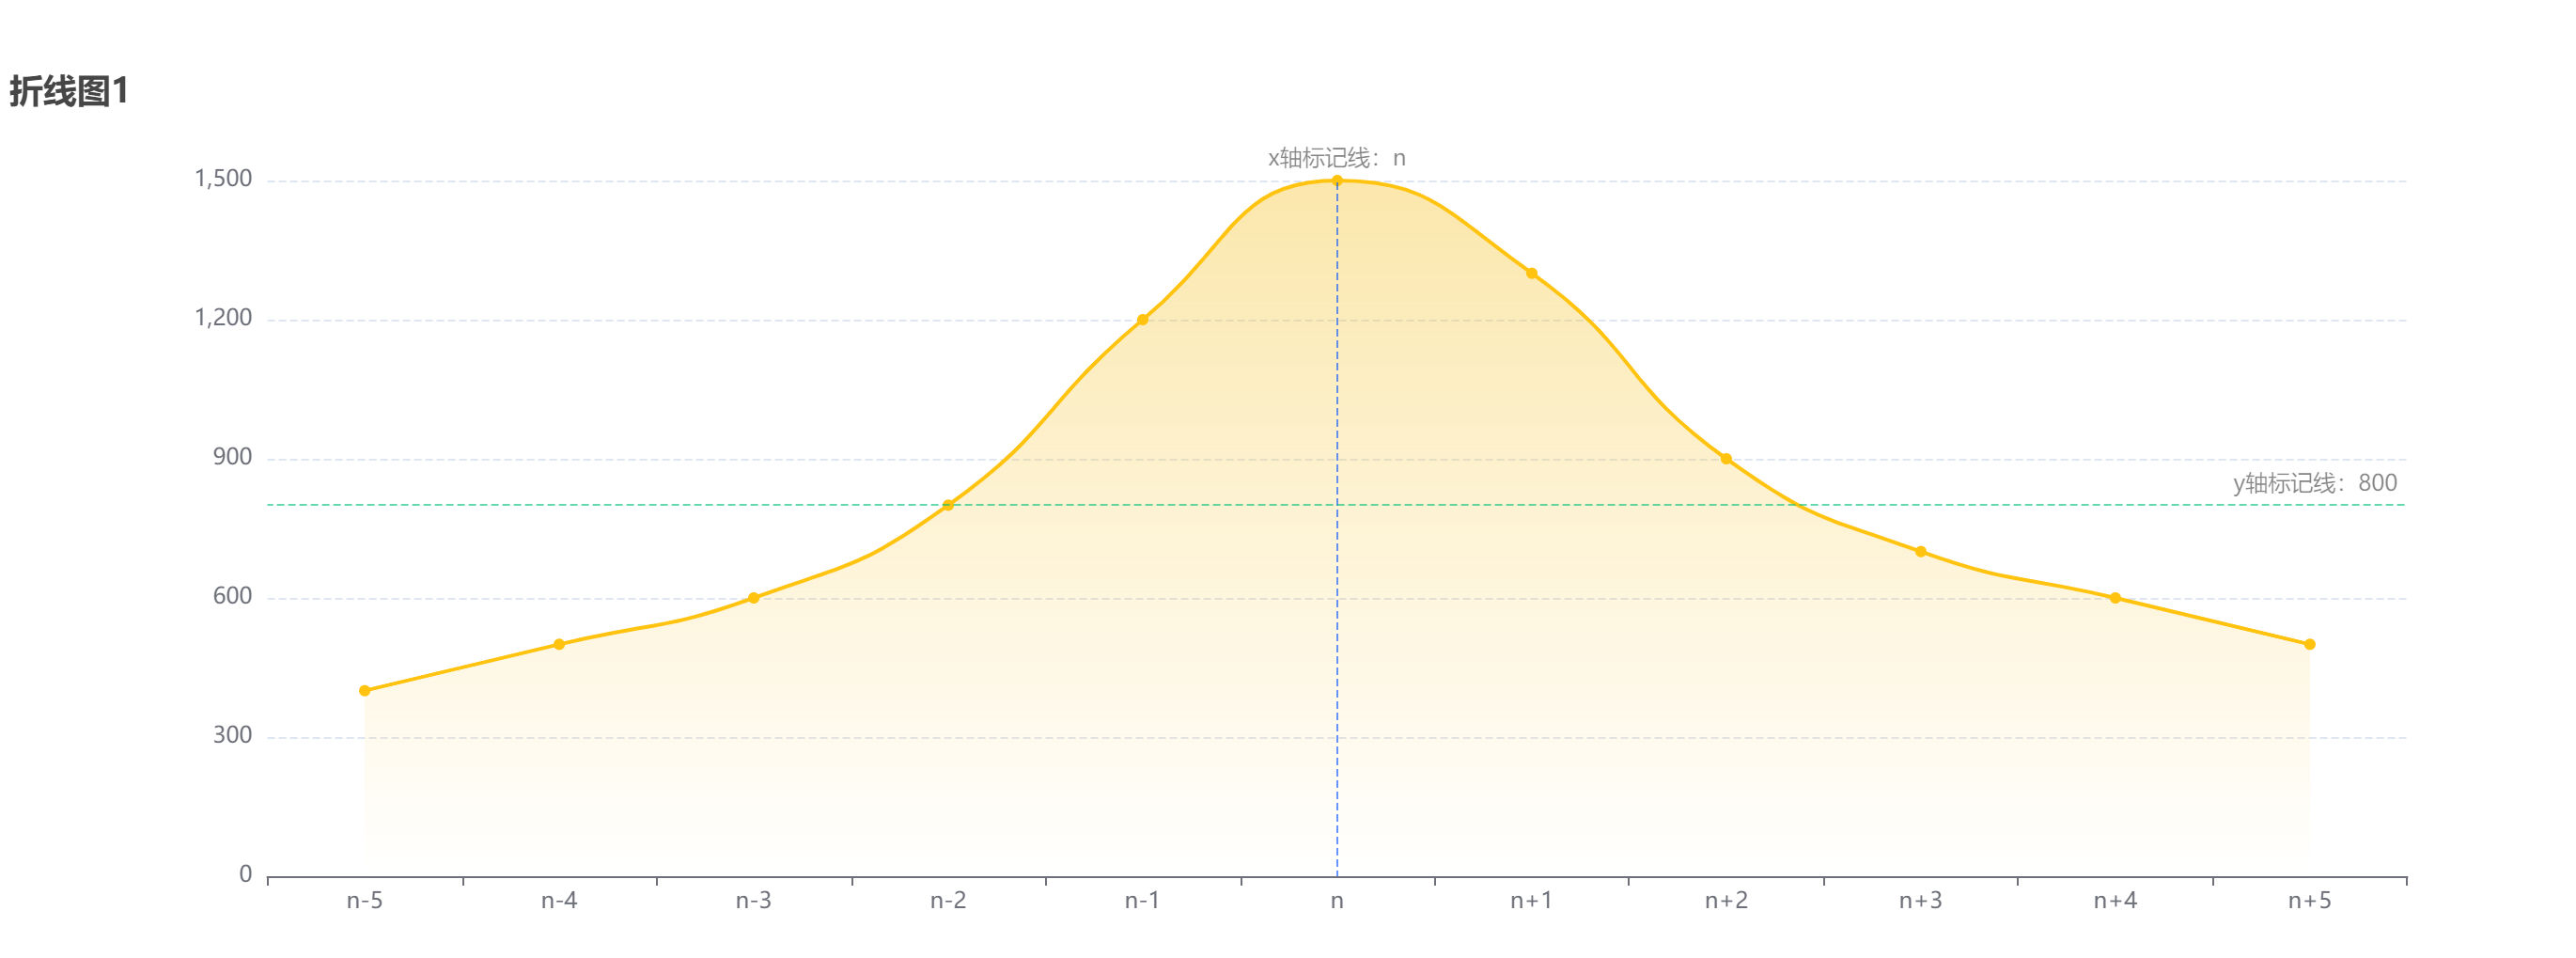
折线图1
带X轴、Y轴标记线,其中X轴是’category’ 类目轴,适用于离散的类目数据。

let myChart = echarts.init(this.$refs.line_chart2);
let yList = [400, 500, 600, 800, 1200, 1500, 1300, 900, 700, 600, 500];
let xList = ['n-5', 'n-4', 'n-3', 'n-2', 'n-1', 'n', 'n+1', 'n+2', 'n+3', 'n+4', 'n+5'];
let option = {title: {text: '折线图2',},tooltip: { show: true },xAxis: {type: 'category',trigger: 'axis',axisPointer: {type: 'cross',},data: xList,},yAxis: {type: 'value',//网格线splitLine: {lineStyle: {type: 'dashed', //设置网格线类型 dotted:虚线 solid:实线},},},series: [{type: 'line',smooth: true,symbolSize: 6,symbol: 'circle',data: yList,color: '#FFC310',//区域填充样式areaStyle: {//线性渐变,前4个参数分别是x0,y0,x2,y2(范围0~1);相当于图形包围盒中的百分比。如果最后一个参数是‘true’,则该四个值是绝对像素位置。color: new echarts.graphic.LinearGradient(0, 0, 0, 1, [{offset: 0,color: 'rgba(246,198,56, 0.6)',},{offset: 1,color: 'rgba(246,198,56, 0)',},]),},markLine: {silent: true,symbol: ['none', 'none'],lineStyle: {type: 'dashed',dashOffset: 1,width: 1,opacity: 0.6,},data: [{name: 'x轴标记线',xAxis: 'n',label: {formatter: '{b}:{c}',},lineStyle: {color: '#0050FF',},},{name: 'y轴标记线',yAxis: 800,label: {formatter: '{b}:{c}',position: 'insideEndTop',},lineStyle: {color: '#00C078',},},],},},],
};myChart.setOption(option);
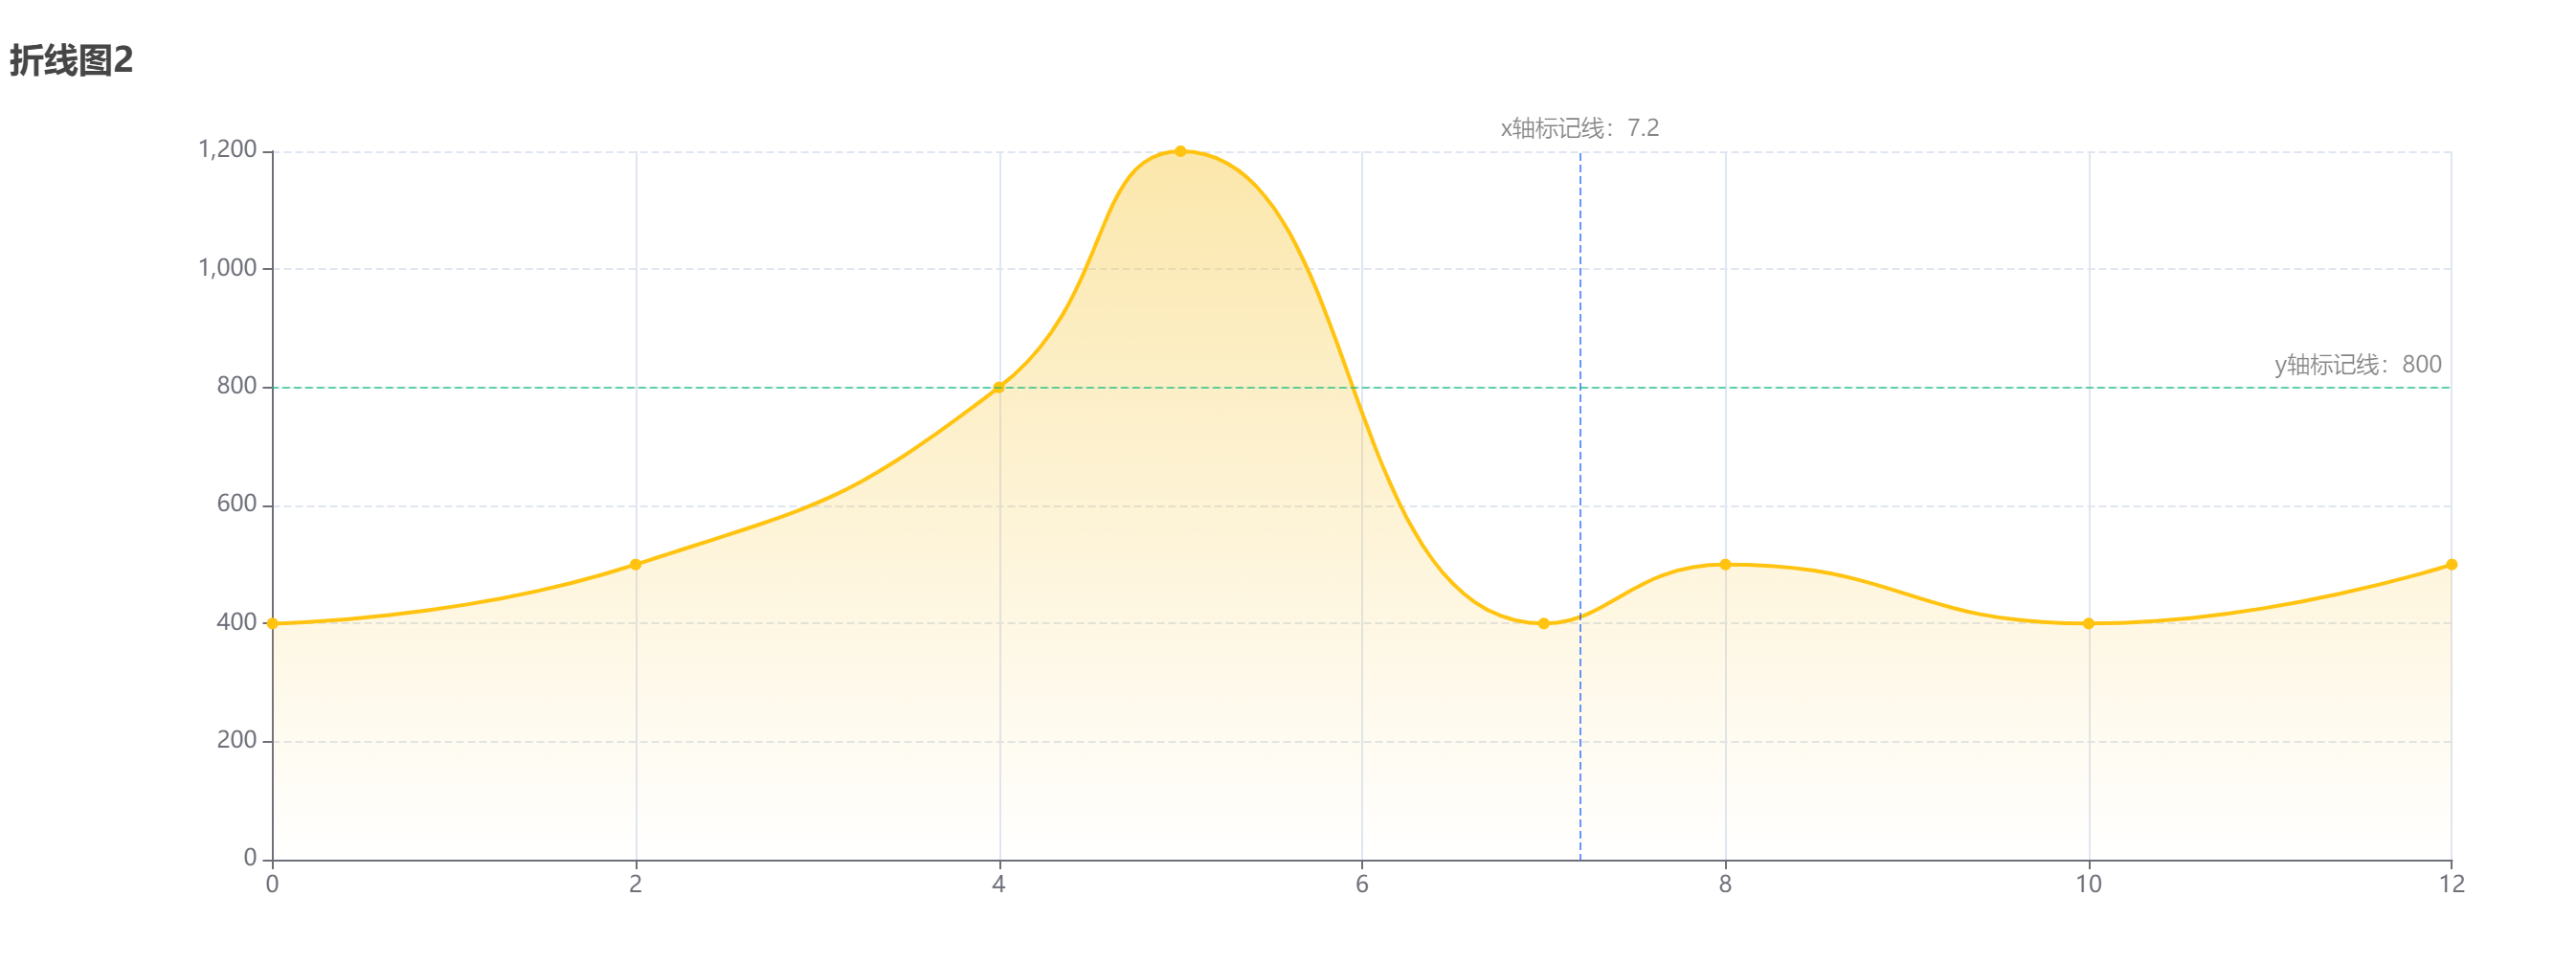
折线图2
带X轴、Y轴标记线,其中’value’ 数值轴,适用于连续数据。

let myChart = echarts.init(this.$refs.line_chart3);
let intervalNum = 2;
//  数据类型为二维数组
let dataArray = [[0, 400],[2, 500],[4, 800],[5, 1200],[7, 400],[8, 500],[10, 400],[12, 500],
];
let option = {title: {text: '折线图2',},tooltip: {show: true,trigger: 'axis',axisPointer: {type: 'cross',},formatter: '{c}',},xAxis: {type: 'value',axisTick: {// 文字对准刻度alignWithLabel: true,color: '#C1C7D0',},minInterval: intervalNum,maxssInterval: intervalNum,},yAxis: {type: 'value',//网格线splitLine: {lineStyle: {type: 'dashed', //设置网格线类型 dotted:虚线 solid:实线},},},series: [{type: 'line',smooth: true,symbolSize: 6,symbol: 'circle',data: dataArray,color: '#FFC310',//区域填充样式areaStyle: {//线性渐变,前4个参数分别是x0,y0,x2,y2(范围0~1);相当于图形包围盒中的百分比。如果最后一个参数是‘true’,则该四个值是绝对像素位置。color: new echarts.graphic.LinearGradient(0, 0, 0, 1, [{offset: 0,color: 'rgba(246,198,56, 0.6)',},{offset: 1,color: 'rgba(246,198,56, 0)',},]),},markLine: {silent: true,symbol: ['none', 'none'],lineStyle: {color: '#FFC310',type: 'dashed',dashOffset: 1,width: 1,opacity: 0.6,},data: [{name: 'x轴标记线',xAxis: 7.2,label: {formatter: '{b}:{c}',},lineStyle: {color: '#0050FF',},},{name: 'y轴标记线',yAxis: 800,label: {formatter: '{b}:{c}',position: 'insideEndTop',},lineStyle: {color: '#00C078',},},],},},],
};
myChart.setOption(option);
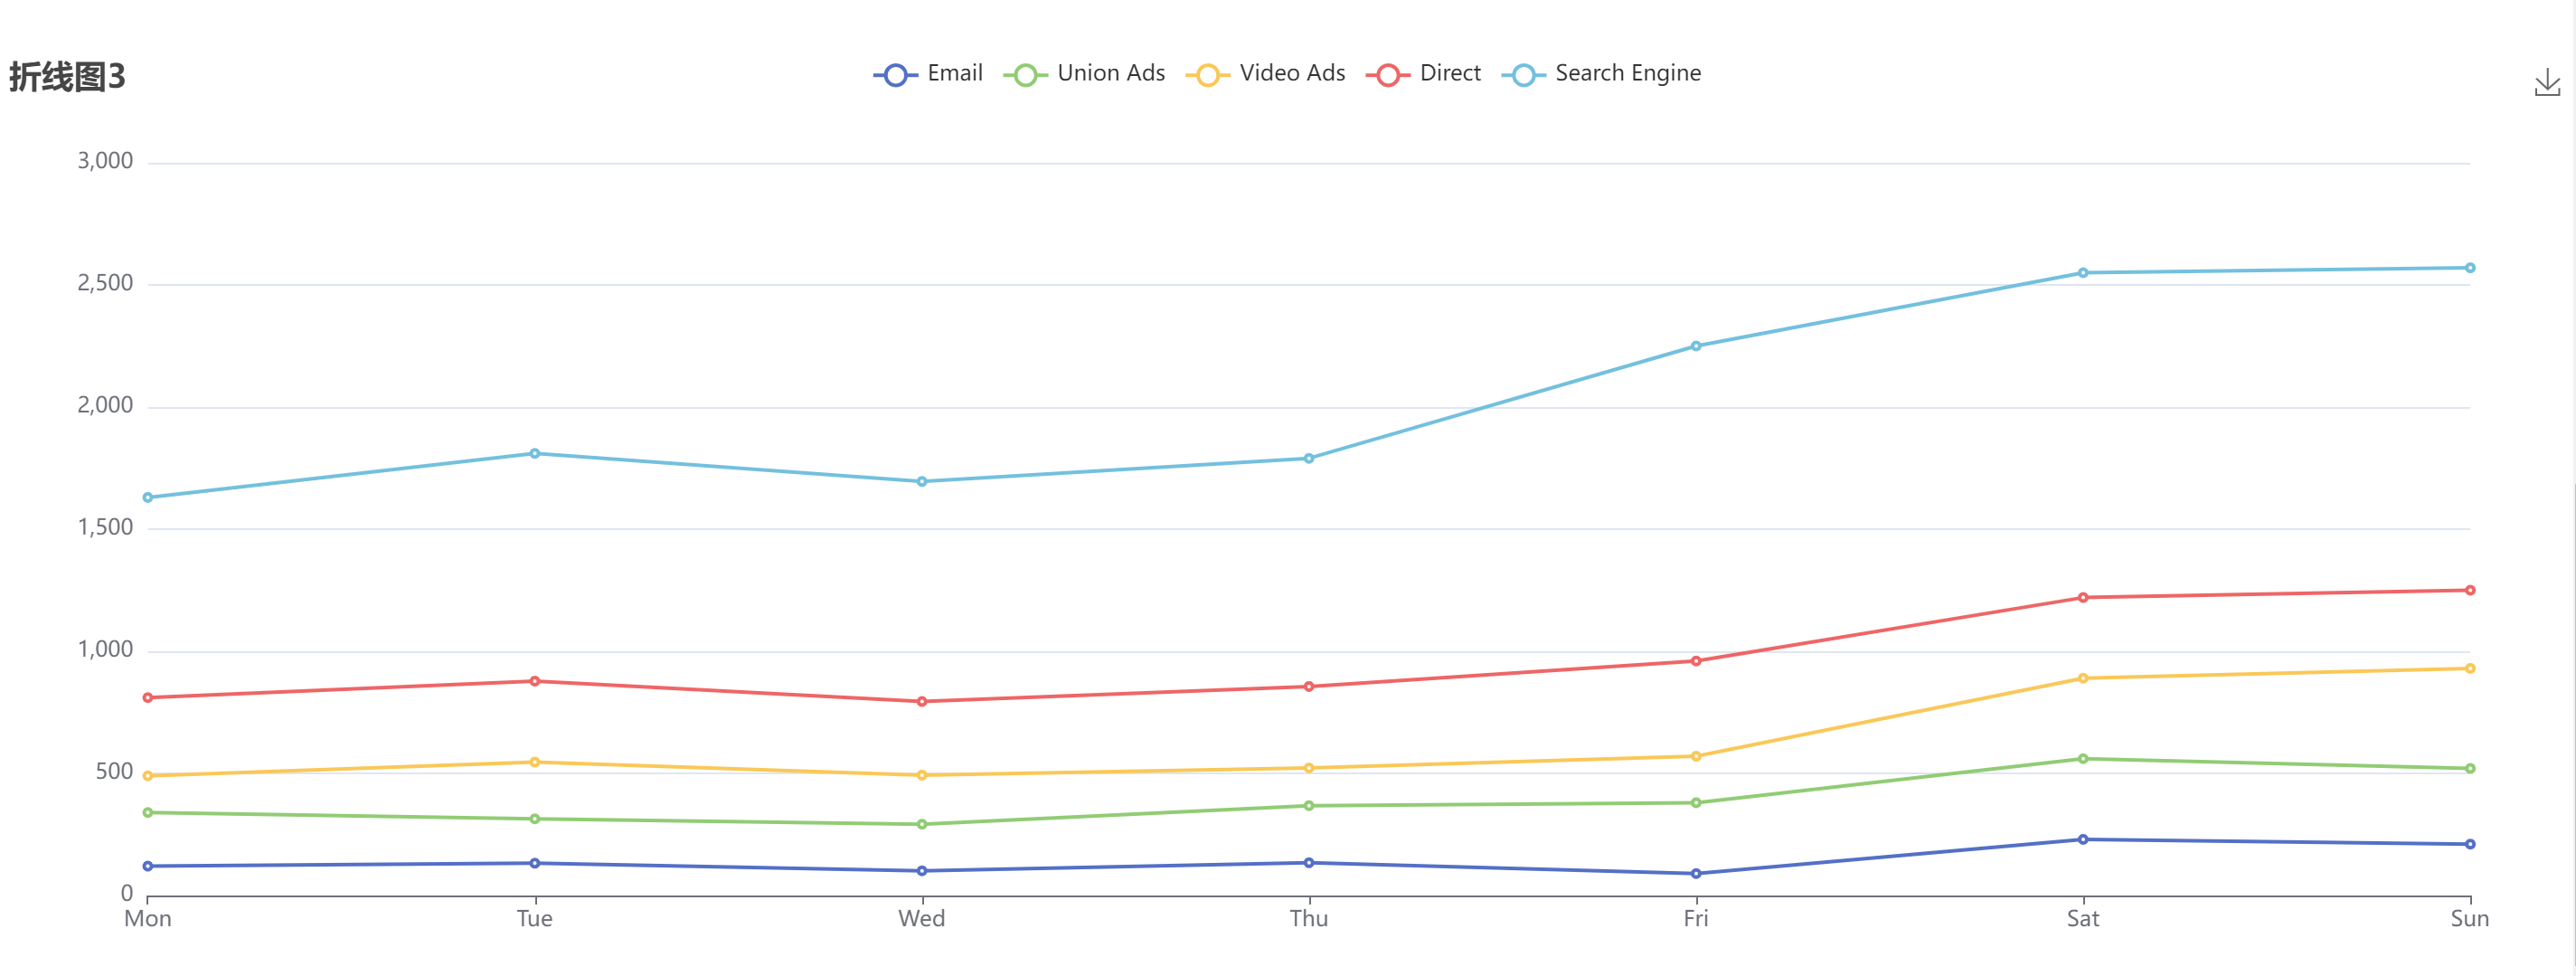
折线图3
多条折线图

let myChart = echarts.init(this.$refs.line_chart4);let option = {title: {text: '折线图3',},tooltip: {trigger: 'axis',valueFormatter: value => value + '个',},legend: {data: ['Email', 'Union Ads', 'Video Ads', 'Direct', 'Search Engine'],},grid: {left: '3%',right: '4%',bottom: '3%',containLabel: true,},toolbox: {feature: {saveAsImage: {},},},xAxis: {type: 'category',boundaryGap: false,data: ['Mon', 'Tue', 'Wed', 'Thu', 'Fri', 'Sat', 'Sun'],},yAxis: {type: 'value',},series: [{name: 'Email',type: 'line',stack: 'Total',data: [120, 132, 101, 134, 90, 230, 210],},{name: 'Union Ads',type: 'line',stack: 'Total',data: [220, 182, 191, 234, 290, 330, 310],},{name: 'Video Ads',type: 'line',stack: 'Total',data: [150, 232, 201, 154, 190, 330, 410],},{name: 'Direct',type: 'line',stack: 'Total',data: [320, 332, 301, 334, 390, 330, 320],},{name: 'Search Engine',type: 'line',stack: 'Total',data: [820, 932, 901, 934, 1290, 1330, 1320],},],};myChart.setOption(option);
示例
 <!--* @Description: * @Author: HMM* @Date: 2023-05-22 10:49:48* @FilePath: \vue-antd-project2\src\views\LineChart.vue
-->
<template><div class="lineChart"><div ref="line_chart1" style="width: 100%; height: 500px"></div><div ref="line_chart2" style="width: 100%; height: 500px"></div><div ref="line_chart3" style="width: 100%; height: 500px"></div><div ref="line_chart4" style="width: 100%; height: 500px"></div><br /></div>
</template>
<script>
import * as echarts from 'echarts';
export default {methods: {initLineChart1() {let myChart = echarts.init(this.$refs.line_chart1);let xData = ['9:00', '11:00', '', '15:00', '17:00', '', '20:00'];let valueData = [6.0, 8.5, 7.6, 3.5, 10.0, 9.5, 11.0];let option = {title: [{text: '恭喜您超过50%的组员!',top: '0',left: '20',textStyle: {color: '#FFA000',fontSize: 13,},},],grid: {top: '50',left: '20',right: '20',bottom: '8%',containLabel: true,},xAxis: [{type: 'category',boundaryGap: false,axisLine: { show: false },axisLabel: {//坐标轴刻度标签的相关设置textStyle: {color: '#000000',margin: 15,},},axisTick: { show: false },data: xData,},],yAxis: [{type: 'value',// min: 1,// max: 100,splitLine: { show: false },axisLine: { show: false },axisLabel: { show: false },axisTick: { show: false },},],series: [{name: '金额',type: 'line',smooth: true, //是否平滑曲线显示symbol: 'none',color: '#1874FF',//区域填充样式areaStyle: {color: 'rgba(24,116,255, 0.2)',shadowColor: 'rgba(24,116,255, 0.9)',shadowBlur: 20,},data: valueData,markLine: {silent: true,symbol: ['none', 'none'],lineStyle: {width: 2,type: 'dotted',color: '#E9E9E9',},data: [{name: '组均',yAxis: 8,label: {position: 'insideStartTop',formatter: '组均:{c} ',},},{name: '我的',yAxis: 10,label: {position: 'insideStartTop',formatter: '我的:{c} ',},},{name: '测试',yAxis: 100,label: {position: 'insideStartTop',formatter: '测试:{c} ',},},],},},],};myChart.setOption(option);},initLineChart2() {let myChart = echarts.init(this.$refs.line_chart2);let yList = [400, 500, 600, 800, 1200, 1500, 1300, 900, 700, 600, 500];let xList = ['n-5', 'n-4', 'n-3', 'n-2', 'n-1', 'n', 'n+1', 'n+2', 'n+3', 'n+4', 'n+5'];let option = {title: {text: '折线图1',},tooltip: { show: true },xAxis: {type: 'category',trigger: 'axis',axisPointer: {type: 'cross',},data: xList,},yAxis: {type: 'value',//网格线splitLine: {lineStyle: {type: 'dashed', //设置网格线类型 dotted:虚线 solid:实线},},},series: [{type: 'line',smooth: true,symbolSize: 6,symbol: 'circle',data: yList,color: '#FFC310',//区域填充样式areaStyle: {//线性渐变,前4个参数分别是x0,y0,x2,y2(范围0~1);相当于图形包围盒中的百分比。如果最后一个参数是‘true’,则该四个值是绝对像素位置。color: new echarts.graphic.LinearGradient(0, 0, 0, 1, [{offset: 0,color: 'rgba(246,198,56, 0.6)',},{offset: 1,color: 'rgba(246,198,56, 0)',},]),},markLine: {silent: true,symbol: ['none', 'none'],lineStyle: {type: 'dashed',dashOffset: 1,width: 1,opacity: 0.6,},data: [{name: 'x轴标记线',xAxis: 'n',label: {formatter: '{b}:{c}',},lineStyle: {color: '#0050FF',},},{name: 'y轴标记线',yAxis: 800,label: {formatter: '{b}:{c}',position: 'insideEndTop',},lineStyle: {color: '#00C078',},},],},},],};myChart.setOption(option);},initLineChart3() {let myChart = echarts.init(this.$refs.line_chart3);let intervalNum = 2;let dataArray = [[0, 400],[2, 500],[4, 800],[5, 1200],[7, 400],[8, 500],[10, 400],[12, 500],];let option = {title: {text: '折线图2',},tooltip: {show: true,trigger: 'axis',axisPointer: {type: 'cross',},formatter: '{c}',},xAxis: {type: 'value',axisTick: {// 文字对准刻度alignWithLabel: true,color: '#C1C7D0',},minInterval: intervalNum,maxssInterval: intervalNum,},yAxis: {type: 'value',//网格线splitLine: {lineStyle: {type: 'dashed', //设置网格线类型 dotted:虚线 solid:实线},},},series: [{type: 'line',smooth: true,symbolSize: 6,symbol: 'circle',data: dataArray,color: '#FFC310',//区域填充样式areaStyle: {//线性渐变,前4个参数分别是x0,y0,x2,y2(范围0~1);相当于图形包围盒中的百分比。如果最后一个参数是‘true’,则该四个值是绝对像素位置。color: new echarts.graphic.LinearGradient(0, 0, 0, 1, [{offset: 0,color: 'rgba(246,198,56, 0.6)',},{offset: 1,color: 'rgba(246,198,56, 0)',},]),},markLine: {silent: true,symbol: ['none', 'none'],lineStyle: {color: '#FFC310',type: 'dashed',dashOffset: 1,width: 1,opacity: 0.6,},data: [{name: 'x轴标记线',xAxis: 7.2,label: {formatter: '{b}:{c}',},lineStyle: {color: '#0050FF',},},{name: 'y轴标记线',yAxis: 800,label: {formatter: '{b}:{c}',position: 'insideEndTop',},lineStyle: {color: '#00C078',},},],},},],};myChart.setOption(option);},initLineChart4() {let myChart = echarts.init(this.$refs.line_chart4);let option = {title: {text: '折线图3',},tooltip: {trigger: 'axis',valueFormatter: value => value + '个',},legend: {data: ['Email', 'Union Ads', 'Video Ads', 'Direct', 'Search Engine'],},grid: {left: '3%',right: '4%',bottom: '3%',containLabel: true,},toolbox: {feature: {saveAsImage: {},},},xAxis: {type: 'category',boundaryGap: false,data: ['Mon', 'Tue', 'Wed', 'Thu', 'Fri', 'Sat', 'Sun'],},yAxis: {type: 'value',},series: [{name: 'Email',type: 'line',stack: 'Total',data: [120, 132, 101, 134, 90, 230, 210],},{name: 'Union Ads',type: 'line',stack: 'Total',data: [220, 182, 191, 234, 290, 330, 310],},{name: 'Video Ads',type: 'line',stack: 'Total',data: [150, 232, 201, 154, 190, 330, 410],},{name: 'Direct',type: 'line',stack: 'Total',data: [320, 332, 301, 334, 390, 330, 320],},{name: 'Search Engine',type: 'line',stack: 'Total',data: [820, 932, 901, 934, 1290, 1330, 1320],},],};myChart.setOption(option);},},mounted() {this.initLineChart1();this.initLineChart2();this.initLineChart3();this.initLineChart4();},
};
</script>
<style style="less" scoped></style>