【OpenCV实现图像:制作酷炫的动画效果】
文章目录
- 概要
- 生成背景图
- 添加点动画
- 添加文本显示
- 小结
概要
首先,通过导入必要的库,包括NumPy用于数学运算和Matplotlib库用于数据可视化。随后,创建图形和轴,初始化点的位置,以及编写初始化函数和更新函数。
初始化函数负责设置图形的初始状态,包括坐标轴的范围等。更新函数则定义了动画每一帧的变化,这里以cos函数为例,计算点的新坐标位置。
通过FuncAnimation类,设置动画的帧数、初始化函数、更新函数等参数,最后调用plt.show()显示动画。
生成背景图
在绘制动画之前,首先需要生成cos函数的背景图。这个步骤非常简单,与通常使用Matplotlib进行绘图的方法相似。
import numpy as np
import matplotlib.pyplot as pltdef generate_background():x = np.linspace(0, 2 * np.pi, 100)y = np.cos(x)# 创建图形并绘制cos函数fig = plt.figure()plt.plot(x, y)# 添加网格线plt.grid(ls='--')# 保存生成的背景图plt.savefig("cos_background.png")# 显示图形(可选)plt.show()# 调用函数生成背景图
generate_background()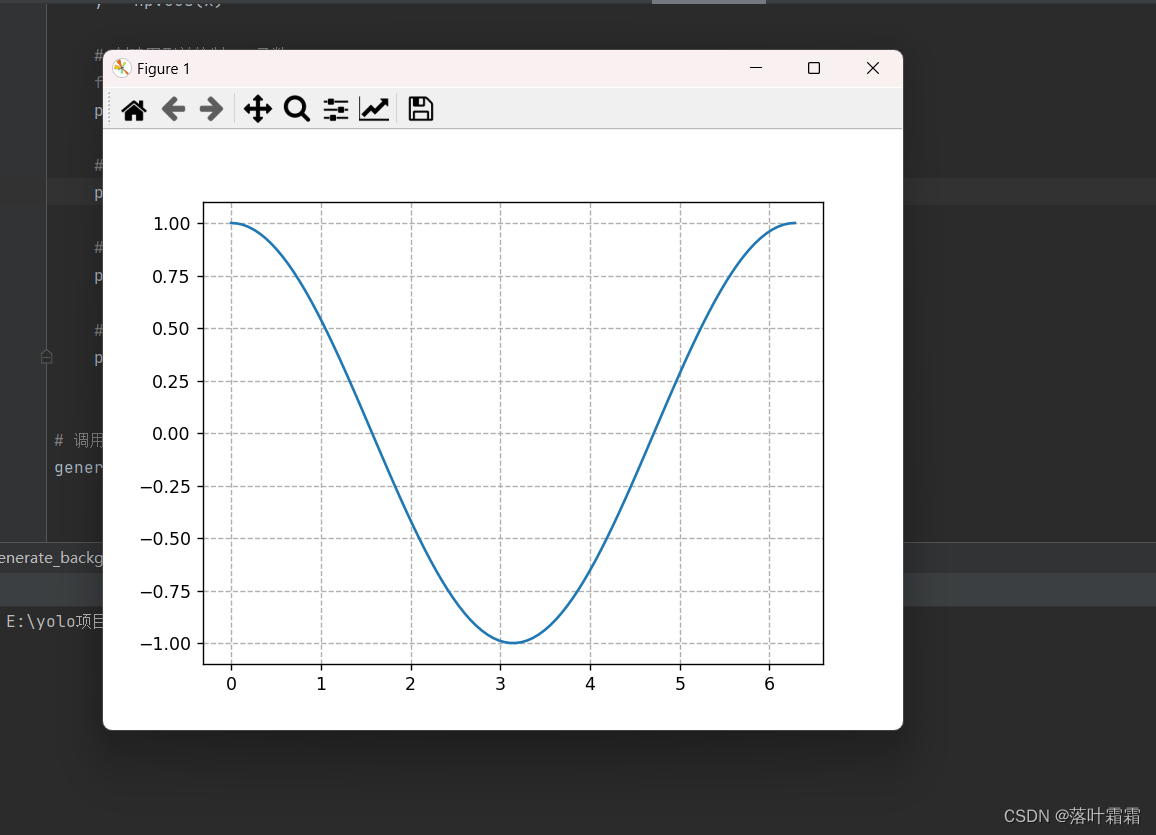
添加点动画
这一步使用animation库,往代码里添加动画点。
import numpy as np
import matplotlib.pyplot as plt
import matplotlib.animation as animationdef update_points(num):point_ani.set_data(x[num], y[num])return point_ani,def add_animation_points():global point_ani, x, yx = np.linspace(0, 2 * np.pi, 100)y = np.cos(x)# 创建图形并绘制cos函数fig = plt.figure()plt.plot(x, y)# 初始化动画点point_ani, = plt.plot(x[0], y[0], "ro")# 添加网格线plt.grid(ls="--")# 创建动画ani = animation.FuncAnimation(fig, update_points, np.arange(0, 100), interval=100, blit=True)# 保存动画为gif文件ani.save('cos_animation.gif', writer='imagemagick', fps=10)# 显示动画(可选)plt.show()# 调用函数添加动画点
add_animation_points()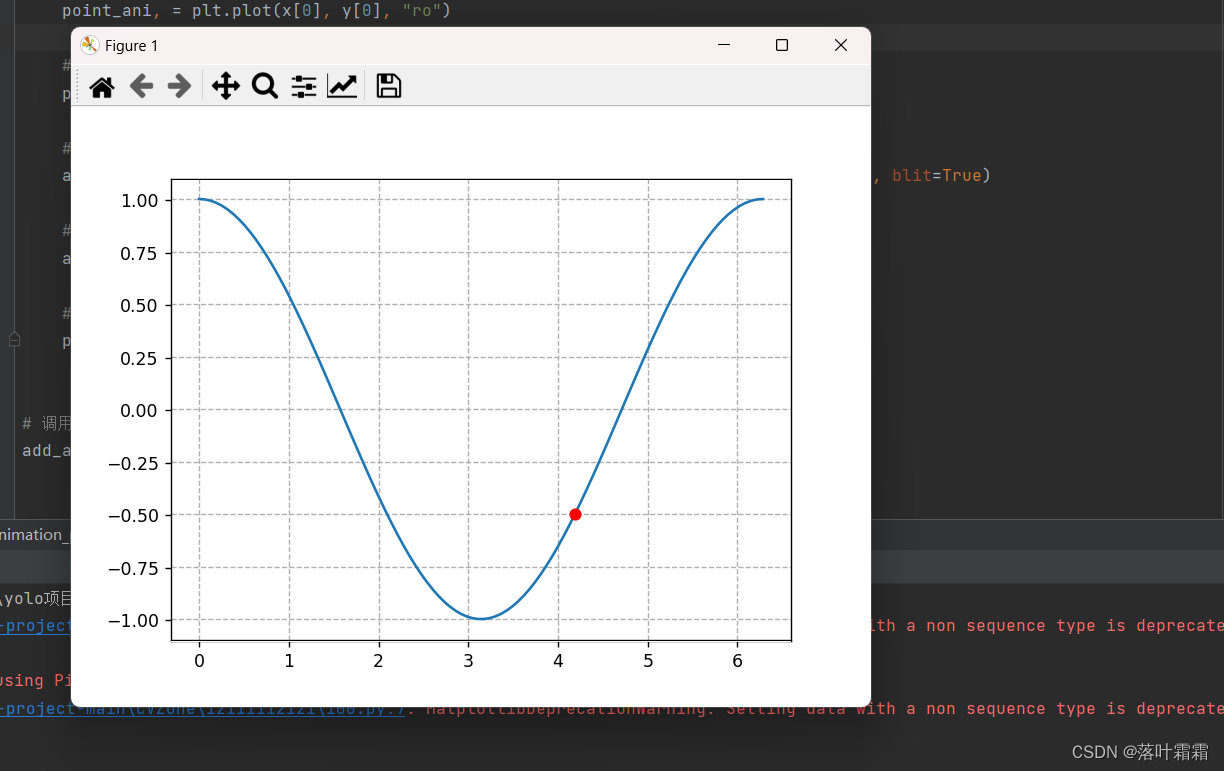
解释:
在以上代码中,首先定义了一个名为 update_points 的函数,该函数用于更新绘制图像中的数据点。函数的输入参数 num 代表当前动画的第几帧,函数的返回值即为我们需要更新的对象。
接下来,将该函数传入 FuncAnimation 函数中,其主要参数介绍如下:
fig: 当前绘图对象
update_points: 更新动画的函数
np.arange(0, 100): 动画帧数,这里需要是一个可以迭代的对象
interval: 动画的时间间隔
blit: 是否开启动画渲染
最后,保存动画为 GIF 文件,并可以选择显示动画效果。
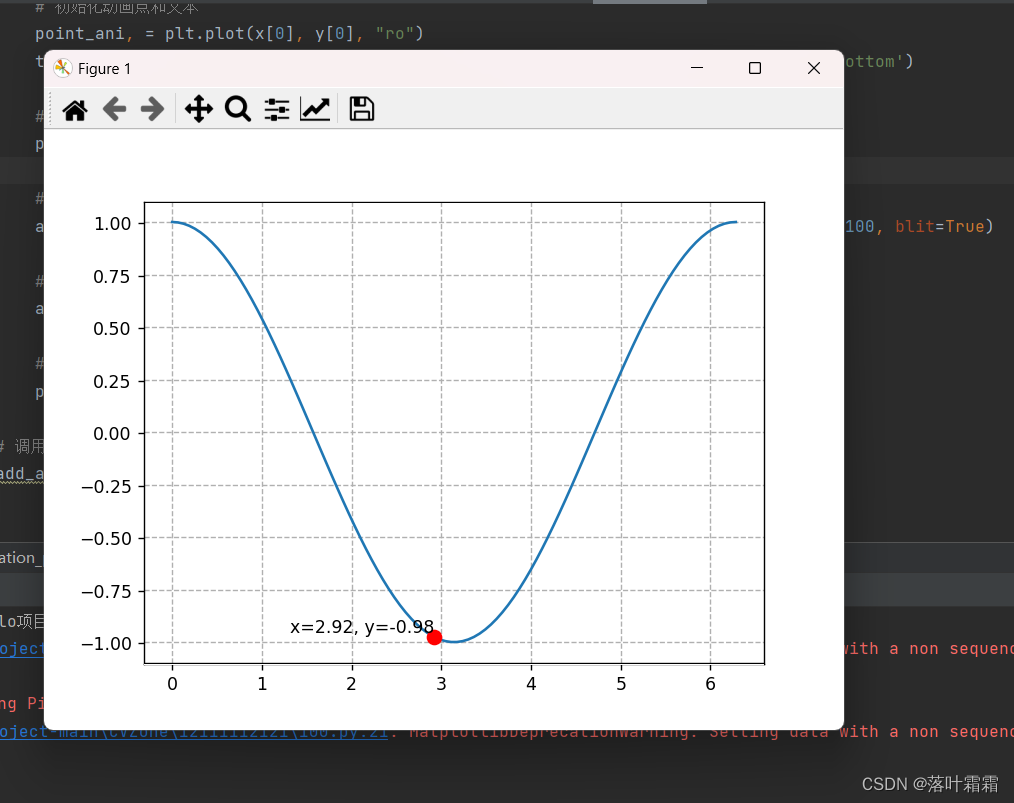
添加文本显示
上述代码已经实现了简单的点动画效果。`
可以对上述代码进行少量修改,以支持文本的显示,并在不同条件下展示不同的点样式。
在 update_points 函数中添加一些额外的代码逻辑即可实现上述效果。
def update_points_v3(num):point_ani.set_data(x[num], y[num])if num % 5 == 0:point_ani.set_marker("*")point_ani.set_markersize(12)else:point_ani.set_marker("o")point_ani.set_markersize(8)text_pt.set_position((x[num], y[num]))text_pt.set_text("x=%.2f, y=%.2f" % (x[num], y[num]))return point_ani, text_pt,完整代码:
import numpy as np
import matplotlib.pyplot as plt
import matplotlib.animation as animationdef update_points(num):point_ani.set_data(x[num], y[num])text_pt.set_position((x[num], y[num]))text_pt.set_text("x=%.2f, y=%.2f" % (x[num], y[num]))return point_ani, text_ptdef update_points_v2(num):# 每隔5帧改变点的样式if num % 5 == 0:point_ani.set_marker("*")point_ani.set_markersize(12)else:point_ani.set_marker("o")point_ani.set_markersize(8)# 更新动画点和文本显示point_ani.set_data(x[num], y[num])text_pt.set_position((x[num], y[num]))text_pt.set_text("x=%.2f, y=%.2f" % (x[num], y[num]))return point_ani, text_ptdef add_animation_points():global point_ani, text_pt, x, yx = np.linspace(0, 2 * np.pi, 100)y = np.cos(x)# 创建图形并绘制cos函数fig = plt.figure()plt.plot(x, y)# 初始化动画点和文本point_ani, = plt.plot(x[0], y[0], "ro")text_pt = plt.text(x[0], y[0], "x=%.2f, y=%.2f" % (x[0], y[0]), ha='right', va='bottom')# 添加网格线plt.grid(ls="--")# 创建动画ani = animation.FuncAnimation(fig, update_points_v2, np.arange(0, 100), interval=100, blit=True)# 保存动画为gif文件ani.save('cos_animation.gif', writer='imagemagick', fps=10)# 显示动画(可选)plt.show()# 调用函数添加动画点
add_animation_points()
结果
import numpy as np
import matplotlib.pyplot as plt
import matplotlib.animation as animation# 定义常量
g = 9.8  # 重力加速度
length = 1.0  # 钟摆长度
theta0 = np.pi / 4.0  # 初始摆角
time_interval = 0.05  # 时间间隔# 计算角速度
omega0 = 0.0
omega = omega0# 初始化时间和角度
t = 0.0
theta = theta0# 创建画布和子图
fig, ax = plt.subplots()
ax.set_xlim(-1.5, 1.5)
ax.set_ylim(-1.5, 1.5)# 初始化绘制的对象
line, = ax.plot([], [], 'o-', lw=2)
time_template = 'time = %.1fs'
time_text = ax.text(0.05, 0.9, '', transform=ax.transAxes)# 更新函数,用于每一帧的绘制
def update(frame):global theta, omega, t# 计算新的角度和角速度alpha = -g / length * np.sin(theta)omega += alpha * time_intervaltheta += omega * time_interval# 更新绘制的数据x = [0, length * np.sin(theta)]y = [0, -length * np.cos(theta)]line.set_data(x, y)# 更新时间文本t += time_intervaltime_text.set_text(time_template % t)return line, time_text# 创建动画
ani = animation.FuncAnimation(fig, update, frames=range(0, 100), interval=time_interval * 1000, blit=True)# 显示动画
plt.show()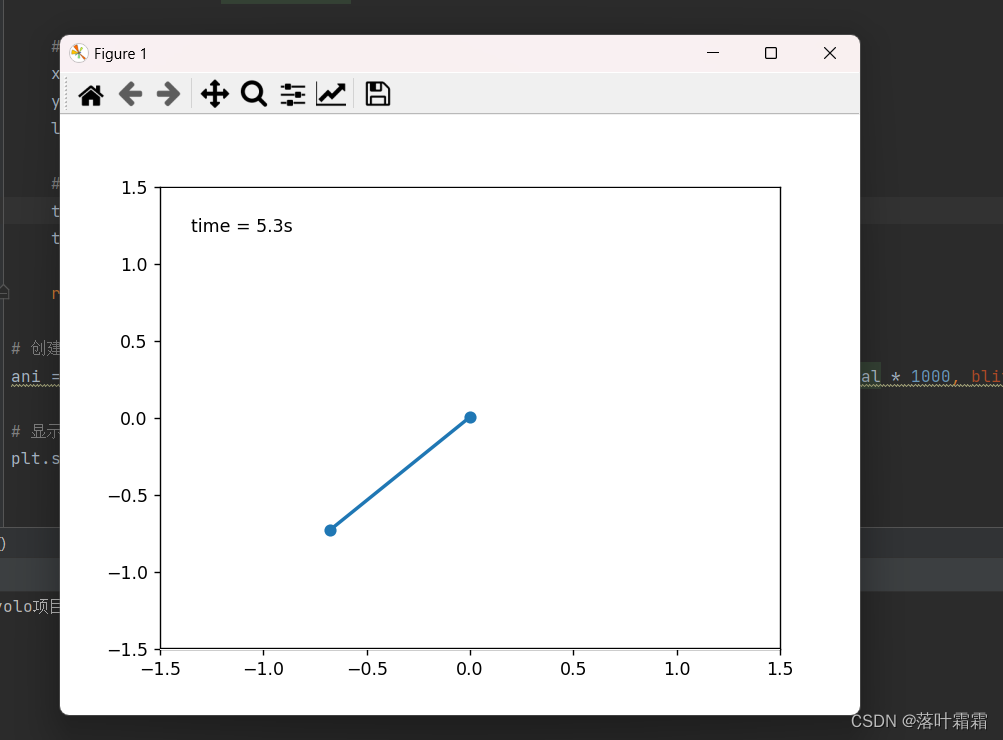
小结
cos函数为例进行讲解,一步一步地实现了点随cos曲线运动的动画效果
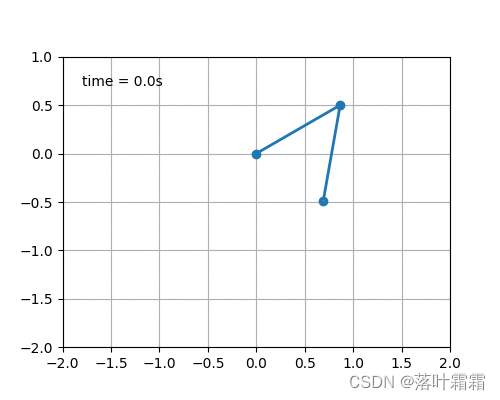
物理模型: 使用了简单的物理模型描述了两根相互连接的钟摆系统。每根钟摆都受到重力的作用,同时第一根钟摆的运动会传递给第二根钟摆。
数学建模: 应用了简单的物理方程,包括角速度、角度和牛顿的运动方程,来模拟钟摆的运动。
Matplotlib的Animation类: 利用Matplotlib的Animation类,实现了每一帧钟摆位置的更新和绘制。通过定时更新,我们得到了一个生动的钟摆摆动的动画效果。
交互式展示: 使用Matplotlib的plt.show()函数,动画可以在图形界面中实时展示,方便用户观察钟摆的运动。