将ECharts图表插入到Word文档中
文章目录
- 在后端调用JS代码
- 准备ECharts库
- 生成Word文档
- 项目地址
- 库封装
- 本文示例 EChartsGen_DocTemplateTool_Sample
如何通过ECharts在后台生成图片,然后插入到Word文档中?
首先要解决一个问题:总所周知,ECharts是前端的一个图表库,如何在后台调用JS代码?这里就要用到PhantomJS了。
PhantomJS是一个基于WebKit的JavaScript API,它使用QtWebKit作为核心浏览器的功能,使用WebKit编译、解释和执行JavaScript代码。任何可以在基于WebKit的浏览器上做的事情,它都能做到。它不仅是一个隐形的浏览器,提供了诸如CSS选择器、支持Web标准、DOM操作、JSON、HTML5、Canvas、SVG等功能,同时也提供了处理文件I/O的操作。
之前写过一个文档模板工具,其中可以通过占位符插入图片。
用PhantomJS生成ECharts图表的Png图片,利用文档模板工具插入图片即可实现这个需求。
下面就来看看如何实现。
在后端调用JS代码
创建一个.netstandard2.1的类库项目。为了方便调用,我们安装一个PhantomJS包装器:NReco.PhantomJS
dotnet add package NReco.PhantomJS --version 1.1.0
这只是一个包装器,因此还需要一个可执行文件,前往官网下载PhantomJS。
因为直接使用编译好的可执行文件,因此需要下载对应的平台版本,这里我下载了Windows以及Linux 64-bit版本。
将下载好的可执行文件解压放置在项目根目录下的libs目录中。

这样我们可以直接在.net中调用PhantomJS了。
准备ECharts库
jQuery
下载jquery-3.6.3.min.js: https://code.jquery.com/jquery-3.6.3.min.js
ECharts
下载echarts.min.js: https://github.com/apache/echarts/tree/5.4.3/dist
ECharts转换器
echarts-convert在github上有众多版本,echarts-convert的代码来源于这里:https://github.com/wadezhan/billfeller.github.io/issues/85
这里选择
(function () {var system = require('system');var fs = require('fs');var config = {// define the location of js filesJQUERY: 'jquery-3.6.3.min.js',//ESL: 'esl.js',ECHARTS: 'echarts.min.js',// default container width and heightDEFAULT_WIDTH: '1920',DEFAULT_HEIGHT: '800'}, parseParams, render, pick, usage;usage = function () {console.log("\nUsage: phantomjs echarts-convert.js -options options -outfile filename -width width -height height"+ "OR"+ "Usage: phantomjs echarts-convert.js -infile URL -outfile filename -width width -height height\n");};pick = function () {var args = arguments, i, arg, length = args.length;for (i = 0; i < length; i += 1) {arg = args[i];if (arg !== undefined && arg !== null && arg !== 'null' && arg != '0') {return arg;}}};parseParams = function () {var map = {}, i, key;console.log("--logs:\n")console.log(system.args)if (system.args.length < 2) {usage();phantom.exit();}for (i = 0; i < system.args.length; i += 1) {if (system.args[i].charAt(0) === '-') {key = system.args[i].substr(1, i.length);if (key === 'infile') {// get string from file// force translate the key from infile to options.key = 'options';try {map[key] = fs.read(system.args[i + 1]).replace(/^\s+/, '');} catch (e) {console.log('Error: cannot find file, ' + system.args[i + 1]);phantom.exit();}} else {map[key] = system.args[i + 1].replace(/^\s+/, '');}}}return map;};render = function (params) {var page = require('webpage').create(), createChart;var bodyMale = config.SVG_MALE;page.onConsoleMessage = function (msg) {console.log(msg);};page.onAlert = function (msg) {console.log(msg);};createChart = function (inputOption, width, height, config) {var counter = 0;function decrementImgCounter() {counter -= 1;if (counter < 1) {console.log(messages.imagesLoaded);}}function loadScript(varStr, codeStr) {var script = $('<script>').attr('type', 'text/javascript');script.html('var ' + varStr + ' = ' + codeStr);document.getElementsByTagName("head")[0].appendChild(script[0]);if (window[varStr] !== undefined) {console.log('Echarts.' + varStr + ' has been parsed');}}function loadImages() {var images = $('image'), i, img;if (./Assets/images.length > 0) {counter = images.length;for (i = 0; i < images.length; i += 1) {img = new Image();img.onload = img.onerror = decrementImgCounter;img.src = images[i].getAttribute('href');}} else {console.log('The images have been loaded');}}// load opitonsif (inputOption != 'undefined') {// parse the optionsloadScript('options', inputOption);// disable the animationoptions.animation = false;}// we render the image, so we need set background to white.$(document.body).css('backgroundColor', 'white');var container = $("<div>").appendTo(document.body);container.attr('id', 'container');container.css({width: width,height: height});// render the chartvar myChart = echarts.init(container[0]);myChart.setOption(options);// load imagesloadImages();return myChart.getDataURL();};// parse the paramspage.open("about:blank", function (status) {// inject the dependency jspage.injectJs(config.ESL);page.injectJs(config.JQUERY);page.injectJs(config.ECHARTS);var width = pick(params.width, config.DEFAULT_WIDTH);var height = pick(params.height, config.DEFAULT_HEIGHT);// create the chartvar base64 = page.evaluate(createChart, params.options, width, height, config);//fs.write("base64.txt", base64);// define the clip-rectanglepage.clipRect = {top: 0,left: 0,width: width,height: height};// render the imagepage.render(params.outfile);console.log('render complete:' + params.outfile);// exitphantom.exit();});};// get the argsvar params = parseParams();// validate the paramsif (params.options === undefined || params.options.length === 0) {console.log("ERROR: No options or infile found.");usage();phantom.exit();}// set the default out fileif (params.outfile === undefined) {var tmpDir = fs.workingDirectory + '/tmp';// exists tmpDir and is it writable?if (!fs.exists(tmpDir)) {try {fs.makeDirectory(tmpDir);} catch (e) {console.log('ERROR: Cannot make tmp directory');}}params.outfile = tmpDir + "/" + new Date().getTime() + ".png";}// render the imagerender(params);
}());
将上述文件放在项目根目录下的js目录中。

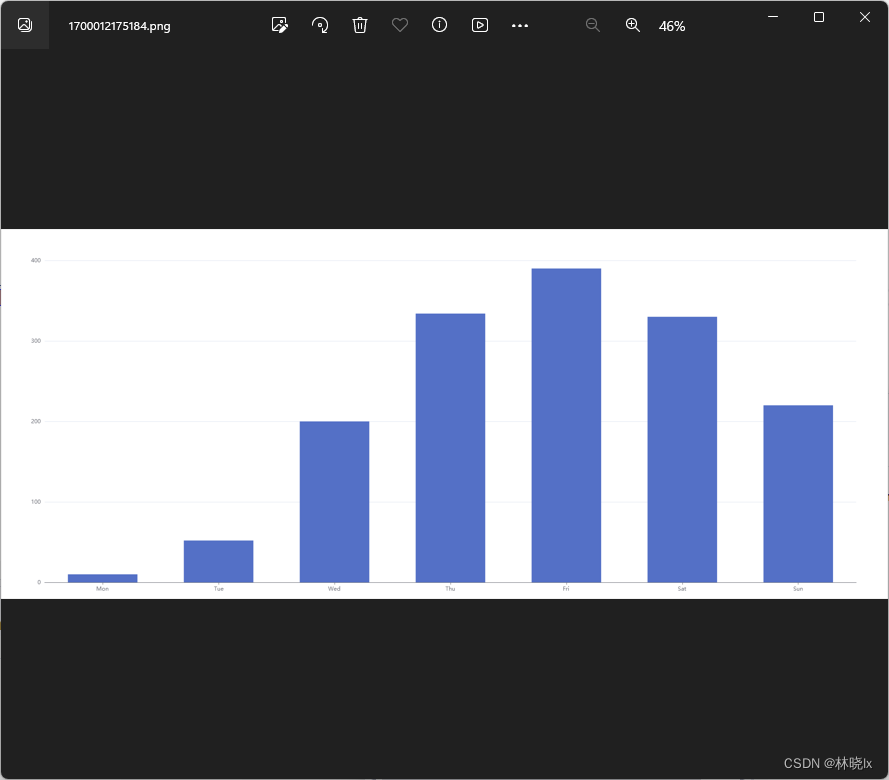
我们来测试一下是否能生成一个简单的ECharts图表。
创建一个option.json

首先指定一个option,在官方示例 https://echarts.apache.org/examples/zh/index.html 中,随意找一个柱状图的sample,复制option对象内容到新创建的option.json文件中
{"tooltip": {"trigger": "axis","axisPointer": {"type": "shadow"}},"grid": {"left": "3%","right": "4%","bottom": "3%","containLabel": true},"xAxis": [{"type": "category","data": [ "Mon", "Tue", "Wed", "Thu", "Fri", "Sat", "Sun" ],"axisTick": {"alignWithLabel": true}}],"yAxis": [{"type": "value"}],"series": [{"name": "Direct","type": "bar","barWidth": "60%","data": [ 10, 52, 200, 334, 390, 330, 220 ]}]
}
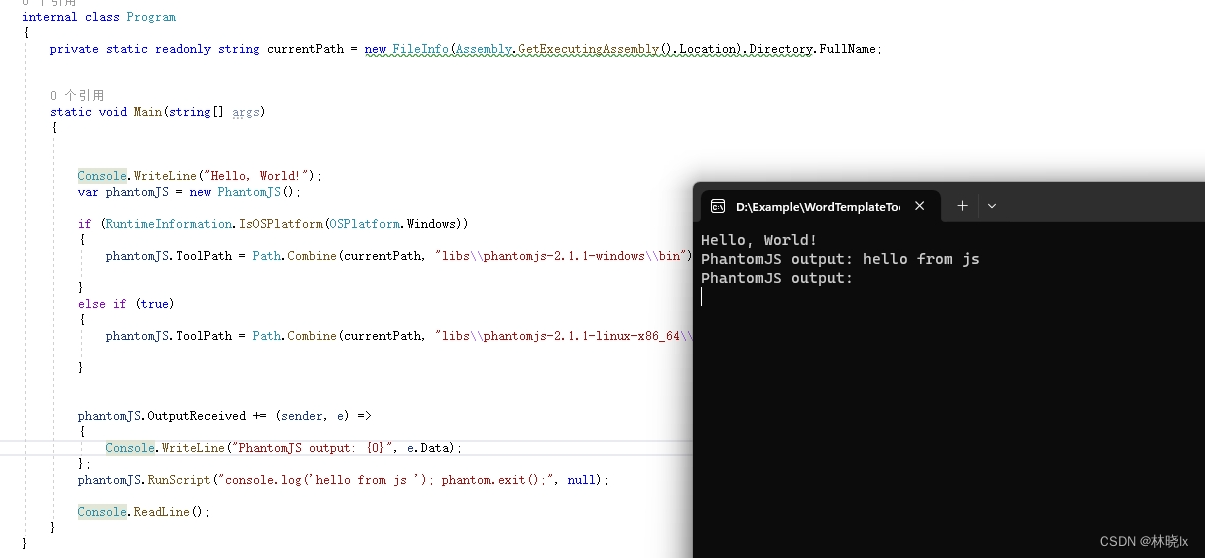
Program.cs中调用ECharts转换器:
static void Main(string[] args)
{var phantomJS = new PhantomJS();if (RuntimeInformation.IsOSPlatform(OSPlatform.Windows)){phantomJS.ToolPath = Path.Combine(basePath, "libs\\phantomjs-2.1.1-windows\\bin");}else if (RuntimeInformation.IsOSPlatform(OSPlatform.Linux)){phantomJS.ToolPath = Path.Combine(basePath, "libs\\phantomjs-2.1.1-linux-x86_64\\bin");}var scriptPath = Path.Combine(basePath, "js\\echarts-converts.js");var optionPath = Path.Combine(basePath, "js\\option.json");phantomJS.OutputReceived += (sender, e) =>{Console.WriteLine("PhantomJS output: {0}", e.Data);};phantomJS.Run(scriptPath, new string[] { "-infile", optionPath });phantomJS.Abort();}
打印如下

打开输出路径看到生成的图片。
生成Word文档
为了方便集成,我加.NET中构件ECharts中可能用的全部数据结构。
这里感谢https://github.com/idoku/EChartsSDK这个项目,代码基本都是从这里拷贝过来的。
这样可以通过指定ChartOption对象,生成图片。
var option = new ChartOption(){title = new List<Title>(){new Title (){text=title, left="center"}},tooltip = new ToolTip(),legend = new Legend(){orient = OrientType.vertical,left = "left"},series = new object[]{new {name= "Access From",type="pie",data=new object[]{new { value= failedCount, name="异常" },new { value= passCount, name="正常" },}}}}
根据Document Template Tool图片占位符格式:#字段名称[宽度,高度]#,
在上一章的Sample基础上,在ReportTemplate2.docx中添加图片占位符。
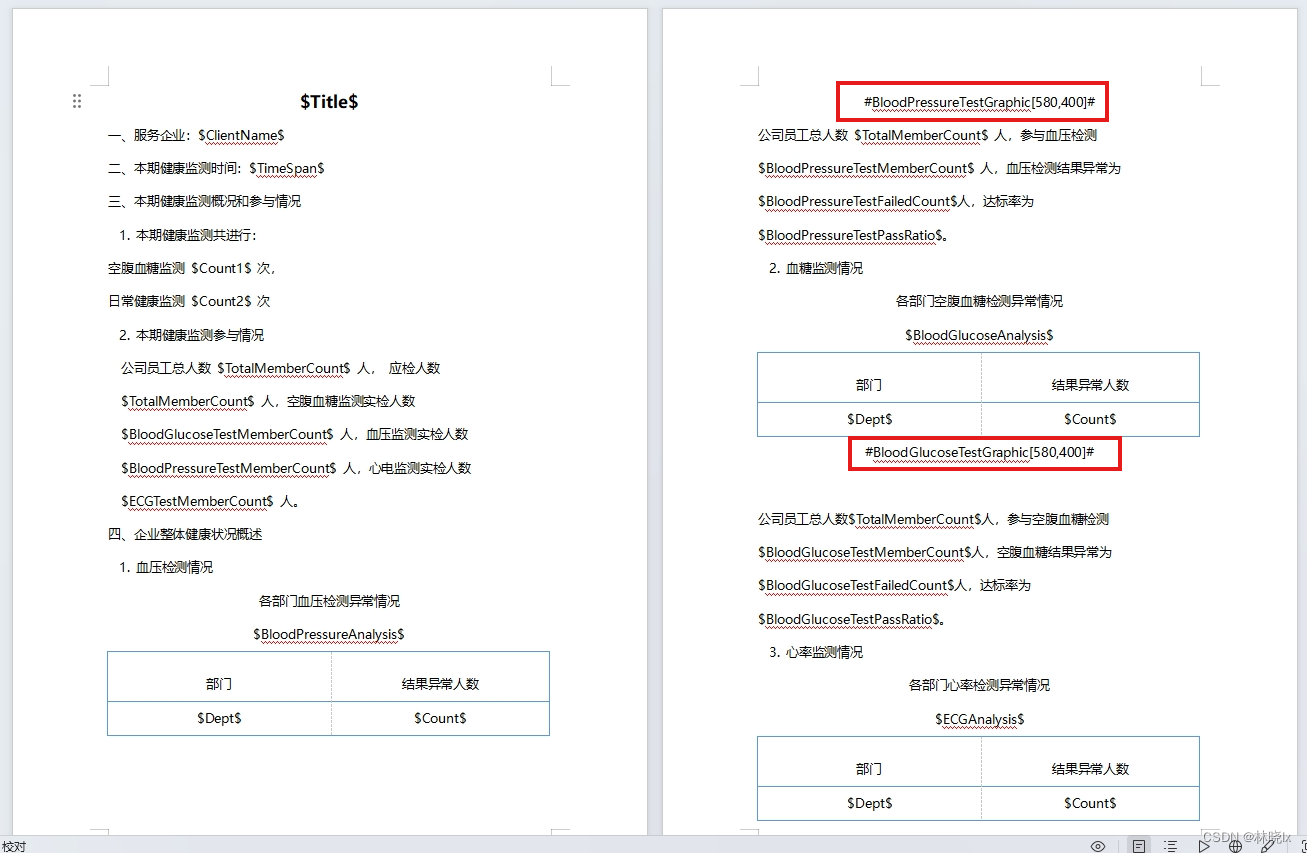
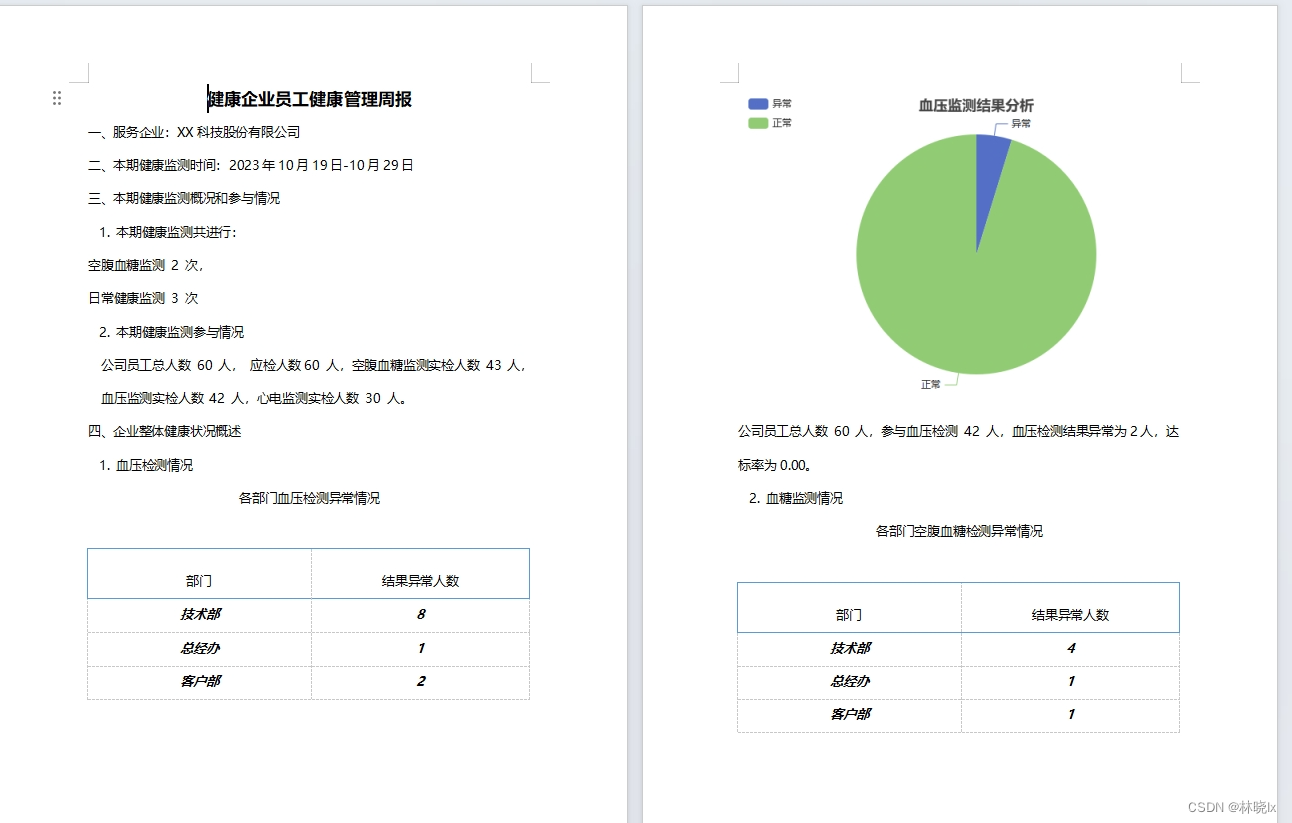
生成后的文档如下:
项目地址
库封装
https://github.com/jevonsflash/EChartsGen
本文示例 EChartsGen_DocTemplateTool_Sample
https://github.com/jevonsflash/EChartsGen/tree/master/EChartsGen_DocTemplateTool_Sample