浅谈前端自定义VectorGrid矢量瓦片样式
目录
前言
一、VectorGrid相关API介绍
1、VectorGrid
2、 LayerStyles样式详解
二、样式自动配置
1、页面定义
2、地图及PBF瓦片引入
3、矢量瓦片样式定义
4、鼠标事件交互
三、最终效果
1、自定义样式展示
2、鼠标交互
总结
前言
在上一篇博客中,详细讲述了在LeafLet.js中集成VectorGrid插件进行矢量瓦片渲染的案例,原文连接基于VectorGrid加载GeoServer发布的矢量瓦片实例,感兴趣的朋友可以直接点击链接进行查阅之前的博文。在上面的博文中,针对GeoServer发布的矢量瓦片,其内网样式和交互效果是固定的。
试想如果遇到以下场景,应该怎么满足。1、用户需要在前端自定义矢量瓦片的样式风格,比如自己调节填充颜色,填充线宽度等。2、需要根据不同的属性值进行个性化设置。在传统的预切型瓦片处理过程中,这种动态渲染的需求是很难满足的,因此需要一种支持客户端自定义的样式控制技术。下面是之前的效果:

本文将以Leaflet为例,深入讲解在VectorGrid控件中,如何在前端进行矢量瓦片的个性化定制,同时给出完整的示例代码,帮助各位用户掌握和使用源码更快速的掌握如何在前端实现矢量瓦片的动态自定义控制。
一、VectorGrid相关API介绍
要想使用VectorGrid进行矢量瓦片的渲染,样式必不可少。因此在熟悉讲解样式动态控制之前,必须要先将其底层的API进行相关的介绍,防止用户一下子不明就里。
1、VectorGrid
A VectorGrid is a generic, abstract class for displaying tiled vector data. it provides facilities for symbolizing and rendering the data in the vector tiles, but lacks the functionality to fetch the vector tiles from wherever they are. Extends Leaflet's L.GridLayer.
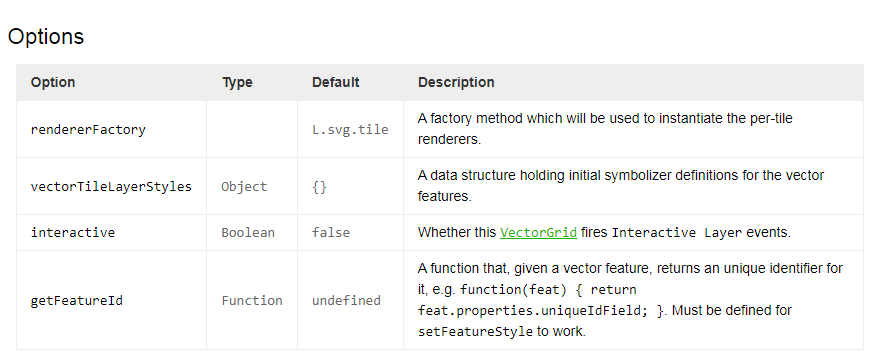
这里比较重要配置属性就是vectorTileLayerStyles,这个就是用来控制样式的属性。后面将重点围绕这个属性进行展开。
2、 LayerStyles样式详解
下面来重点介绍一下LayerStyles样式,先来看一下官网的说明,在矢量瓦片中,也是有图层的概念,跟leaflet中的图层概念有一点不一样,需要注意一下。
Vector tiles have a concept of "layer" different from the Leaflet concept of "layer".
In Leaflet, a "layer" is something that can be atomically added or removed from the map. In vector tiles, a "layer" is a named set of features (points, lines or polygons) which share a common theme.
A vector tile layer¹ can have several layers². In the mapbox-streets-v6 vector tiles layer¹ above, there are named layers² like admin, water or roads.
(¹ In Leaflet)
(² Groups of themed features)
Styling is done via per-layer² sets of L.Path options in the vectorTileLayerStyles layer¹ option:
官网给出了一个样式的样例,我们来看一下,需要注意的是,下面引用的landuse、admin、water都是发布的矢量数据中的一个图层,在Geoserver中可以找到(后面会详细讲解):
vectorTileLayerStyles: {// A plain set of L.Path options.landuse: {weight: 0,fillColor: '#9bc2c4',fillOpacity: 1,fill: true},// A function for styling features dynamically, depending on their// properties and the map's zoom leveladmin: function(properties, zoom) {var level = properties.admin_level;var weight = 1;if (level == 2) {weight = 4;}return {weight: weight,color: '#cf52d3',dashArray: '2, 6',fillOpacity: 0}},// A function for styling features dynamically, depending on their// properties, the map's zoom level, and the layer's geometry// dimension (point, line, polygon)water: function(properties, zoom, geometryDimension) {if (geometryDimension === 1) { // pointreturn ({radius: 5,color: '#cf52d3',});}if (geometryDimension === 2) { // linereturn ({weight: 1,color: '#cf52d3',dashArray: '2, 6',fillOpacity: 0});}if (geometryDimension === 3) { // polygonreturn ({weight: 1,fillColor: '#9bc2c4',fillOpacity: 1,fill: true});}},// An 'icon' option means that a L.Icon will be usedplace: {icon: new L.Icon.Default()},road: []}二、样式自动配置
在了解了以上的API后,我们开始进行相关代码的开发。闲言少叙,直入正题。
1、页面定义
同样的,我们首先进行html页面的定义,在页面中定义了基本的网页骨架。用来展示具体的底图以及叠加矢量瓦片。
<!DOCTYPE html>
<html>
<head><title>VectorGrid矢量瓦片样式自定义</title><meta charset="utf-8" /><meta name="viewport" content="width=device-width, initial-scale=1.0"><link rel="shortcut icon" type="image/x-icon" href="docs/images/favicon.ico" /><link rel="stylesheet" href="/2d/leaflet/leaflet.css" /><script src="/2d/leaflet/leaflet.js?v=1.0.0"></script><script src="https://unpkg.com/leaflet.vectorgrid@latest/dist/Leaflet.VectorGrid.bundled.js"></script><script src="https://unpkg.com/leaflet.vectorgrid@latest/dist/Leaflet.VectorGrid.js"></script><style>#map {margin: 0;padding: 0;position: absolute;width: 99%;height: 98%;}</style>
</head>
<body>
<div id="map"></div>
</body>
</html>
2、地图及PBF瓦片引入
要实现矢量瓦片的接入,本文以PBF瓦片为演示类型。需要在Map页面定义后,将影像底图和矢量瓦片实现动态叠加。
var mymap = L.map('map').setView([29.052934, 104.0625], 3);var tileLayer = L.tileLayer('http://localhost:8086/data/xxgc/q0403/{z}/{x}/{y}.png', {maxZoom: 7,minZoom:0});tileLayer.addTo(mymap);const pbfUrl = "http://localhost:8083/geoserver/gwc/service/tms/1.0.0/gisdev%3A2019_province_4326@EPSG%3A900913@pbf/{z}/{x}/{y}.pbf";3、矢量瓦片样式定义
按照第一章节的样式详解介绍,这里将完成矢量瓦片的样式具体定义。这里的演示数据是全国各省份、自治区、直辖市的矢量数据。空间信息如下:
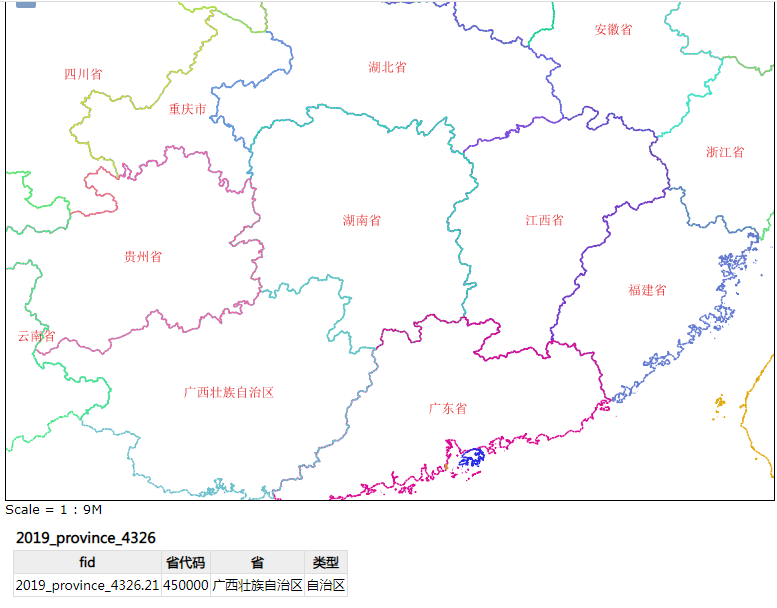
可以看到下面是矢量瓦片的属性信息,包括fid、省代码、省、类型等等。在GeoServer自带的预览控件中可以看到以上的信息。
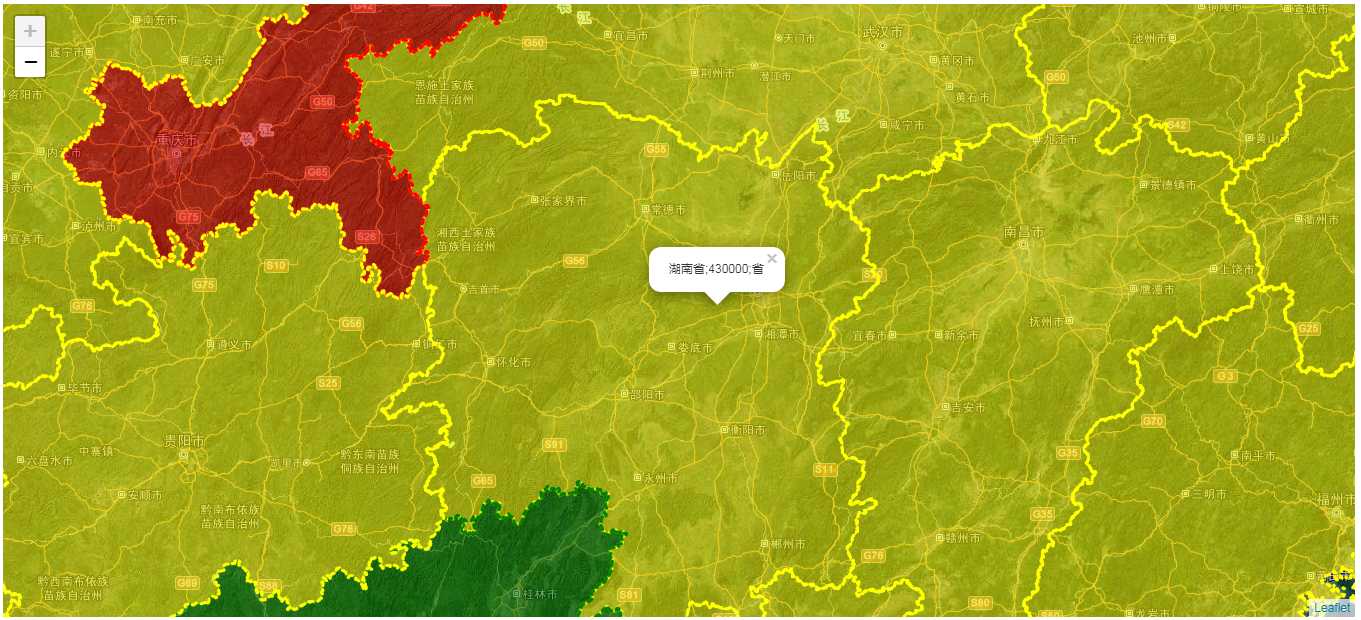
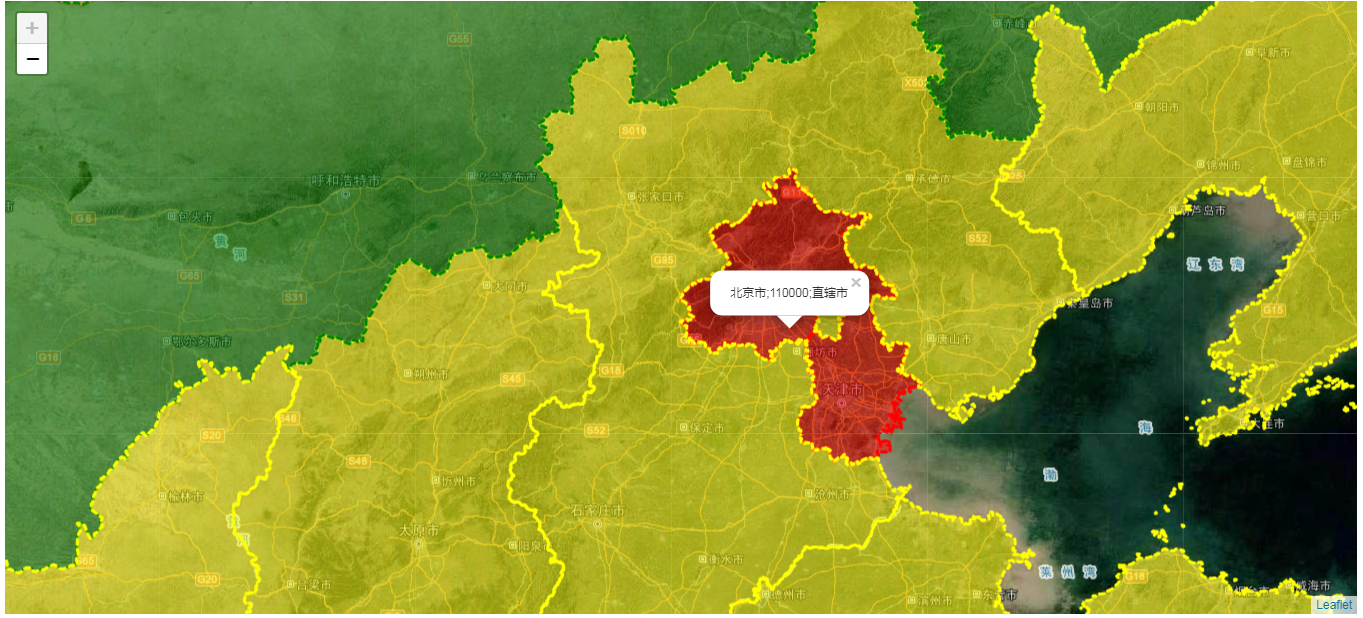
本文的需求就是要根据不同的行政区划类型进行控制:如果是类型是省则矢量瓦片展示为黄色、自治区瓦片使用绿色展示、直辖市则采用红色展示。同时还有另外一个需求,点击矢量瓦片的,可以悬浮展示不同省份的名称信息。
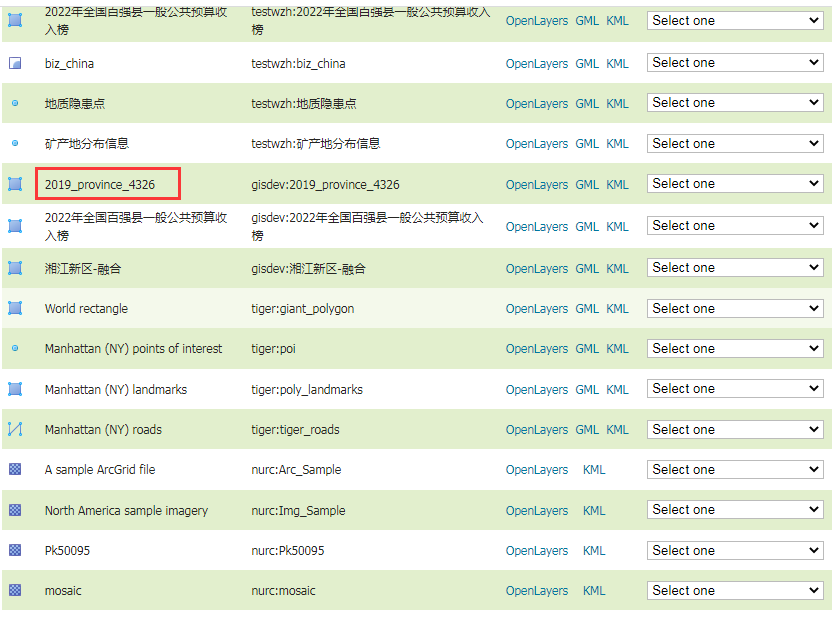
var vectorTileStyling = { '2019_province_4326': function (properties, zoom) { // tianhe 为切片图层名称 //var name = properties.Name; // 获取图层的 Name 属性if(properties.类型 == '省'){return { //color: '#ffd700', color: 'yellow', //fillColor: '#e6d933', fillColor: 'yellow', fillOpacity: 0.5, fill: true, opacity: 1, weight: 3, dashArray: '5', }}else if(properties.类型 == '自治区'){return { //color: '#ffd700', color: 'green', //fillColor: '#e6d933', fillColor: 'green', fillOpacity: 0.5, fill: true, opacity: 1, weight: 3, dashArray: '5', }} else if(properties.类型 == '直辖市' || properties.类型 == '特别行政区'){return { //color: '#ffd700', color: 'red', //fillColor: '#e6d933', fillColor: 'red', fillOpacity: 0.5, fill: true, opacity: 1, weight: 3, dashArray: '5', }}}}请注意,2019_province_4326表示在Geoserver发布的图层的名字。在GeoServer中可以查看到
4、鼠标事件交互
需求场景:这里需要定义地图交互事件,将鼠标悬浮到图层上展示省份的名称、编码以及类型。
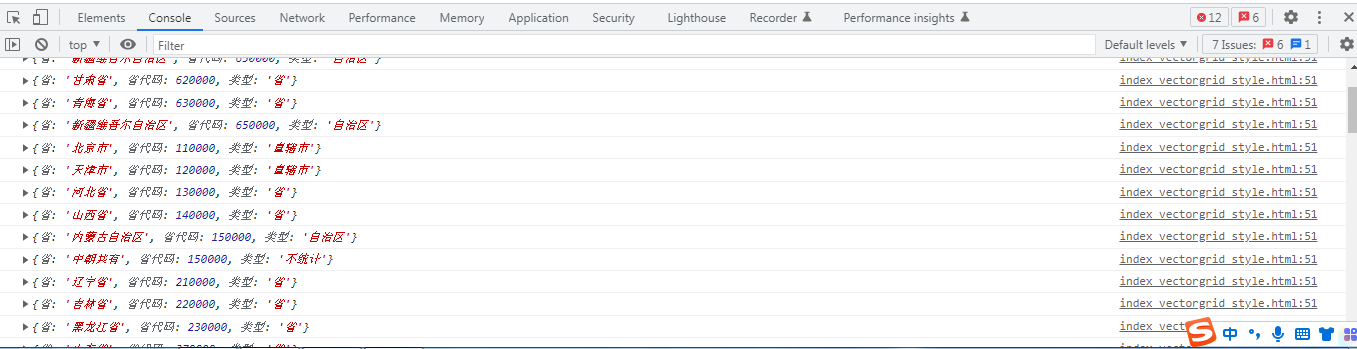
var vectorTileOptions = {layerURL: pbfUrl,rendererFactory: L.canvas.tile, tms: true, interactive: true, //开启VectorGrid触发mouse/pointer事件vectorTileLayerStyles: vectorTileStyling}; var vectorTile = new L.vectorGrid.protobuf(pbfUrl, vectorTileOptions).addTo(mymap)vectorTile.on('mouseover', function (e) { var properties = e.layer.properties; L.popup().setContent(properties.省+";" + properties.省代码+";" +properties.类型 ).setLatLng(e.latlng).openOn(mymap); });三、最终效果
1、自定义样式展示


2、鼠标交互
总结
以上就是本文的主要内容,本文将以Leaflet为例,深入讲解在VectorGrid控件中,如何在前端进行矢量瓦片的个性化定制,同时给出完整的示例代码,帮助各位用户掌握和使用源码更快速的掌握如何在前端实现矢量瓦片的动态自定义控制。